Analyzing Elastic Workplace Search usage in a Kibana dashboard
Let’s start off with some good news: since 7.9.0, your Elastic Workplace Search deployment has been collecting and logging product usage data for you and your team. Usage data like, what your users are searching for, what links they're actually clicking on, and which searches are falling short. And better yet, in a future release we’ll be putting a prebuilt Workplace Search analytics dashboard at your fingertips in Kibana, one of the most powerful visualization tools available. But until we can polish this experience and deliver it with Workplace Search, we’ll use this blog to walk through how to jump start your search analytics using saved objects in Kibana.
Kibana
Note: This Kibana verification step is not required and it may be easier to simply skip to the next section if you're not already comfortable with creating "system" index patterns in Kibana.
First, let’s make sure we’re working with the correct Kibana deployment. For Elastic Cloud users, this will simply be the Kibana instance within the same deployment as Workplace Search.
- Log into the Cloud console.
- Navigate to the deployment that's running Workplace Search.
- On the left side, click on Deployments > [deployment name] Kibana.
- Once in Kibana, verify via Discover that you can match on the following index pattern:
.ent-search-workplace-search-analytics-ecs-ilm-logs-*.
For other types of installations, we need to ensure that the Kibana deploy we’re working with is pointing at the same Elasticsearch cluster as Workplace Search. This is because Workplace Search stores analytics event data directly in Elasticsearch indices. Don’t worry, Workplace Search is making use of index lifecycle management to ensure older analytics data gets aged out.
Import the Workplace Search analytics dashboard
When we create and save index patterns, visualizations, and dashboards in Kibana, we’re persisting these as saved objects in Kibana. This is really handy, because we can import saved objects without having to manually create them ourselves.
Download the visualizations and dashboard
We’ve created a handful of Workplace Search visualizations, put them in a dashboard, and then exported everything as a saved object. You can download exactly that from this GitHub Gist. Download that ndjson file and keep it somewhere handy for the next step.
Upload the dashboard object using the Kibana UI
Next, we will take that ndjson file and plug it into Kibana using the UI.
- From the main sidebar of your Kibana instance, look near the bottom and find Stack Management.
- From there, we want to click into Saved Objects.
- Our next step is to click Import and select our ndjson file. Once you do so, you will see a green check mark that acknowledges success, followed by a new set of objects in the Saved Objects list.
With our objects in place, it is time to see our new dashboard.
View and share our dashboard
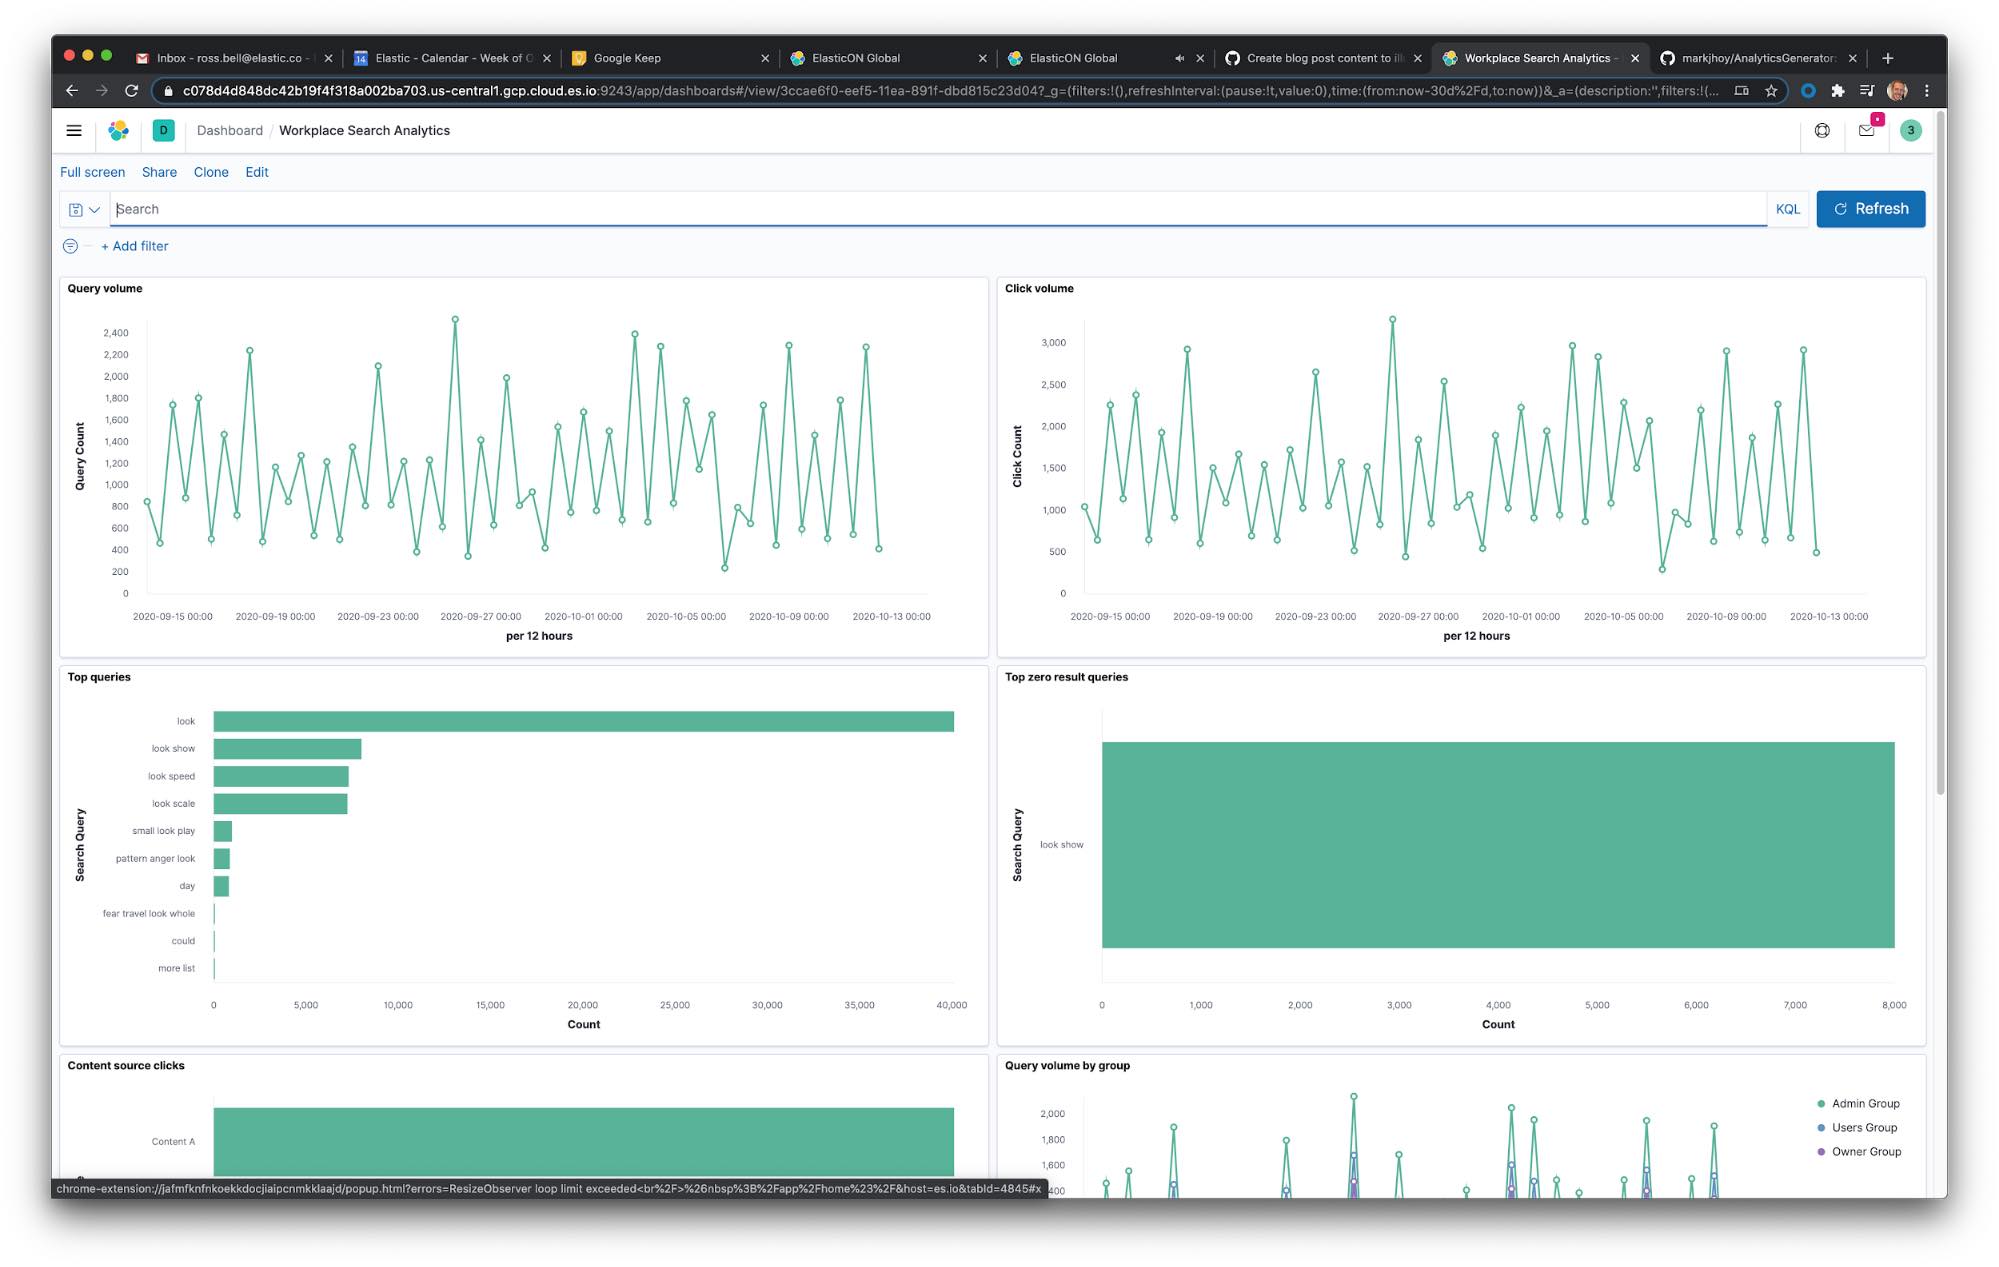
In Kibana, we can find our dashboards by clicking the upper left menu, and then choosing the Kibana > Dashboard option. We’ll see a dashboard called Workplace Search Analytics, which is the dashboard we just created. Once we navigate to that dashboard, we’ll see something like the following. Don’t forget, we can change the time range if we want to modify the reporting window.
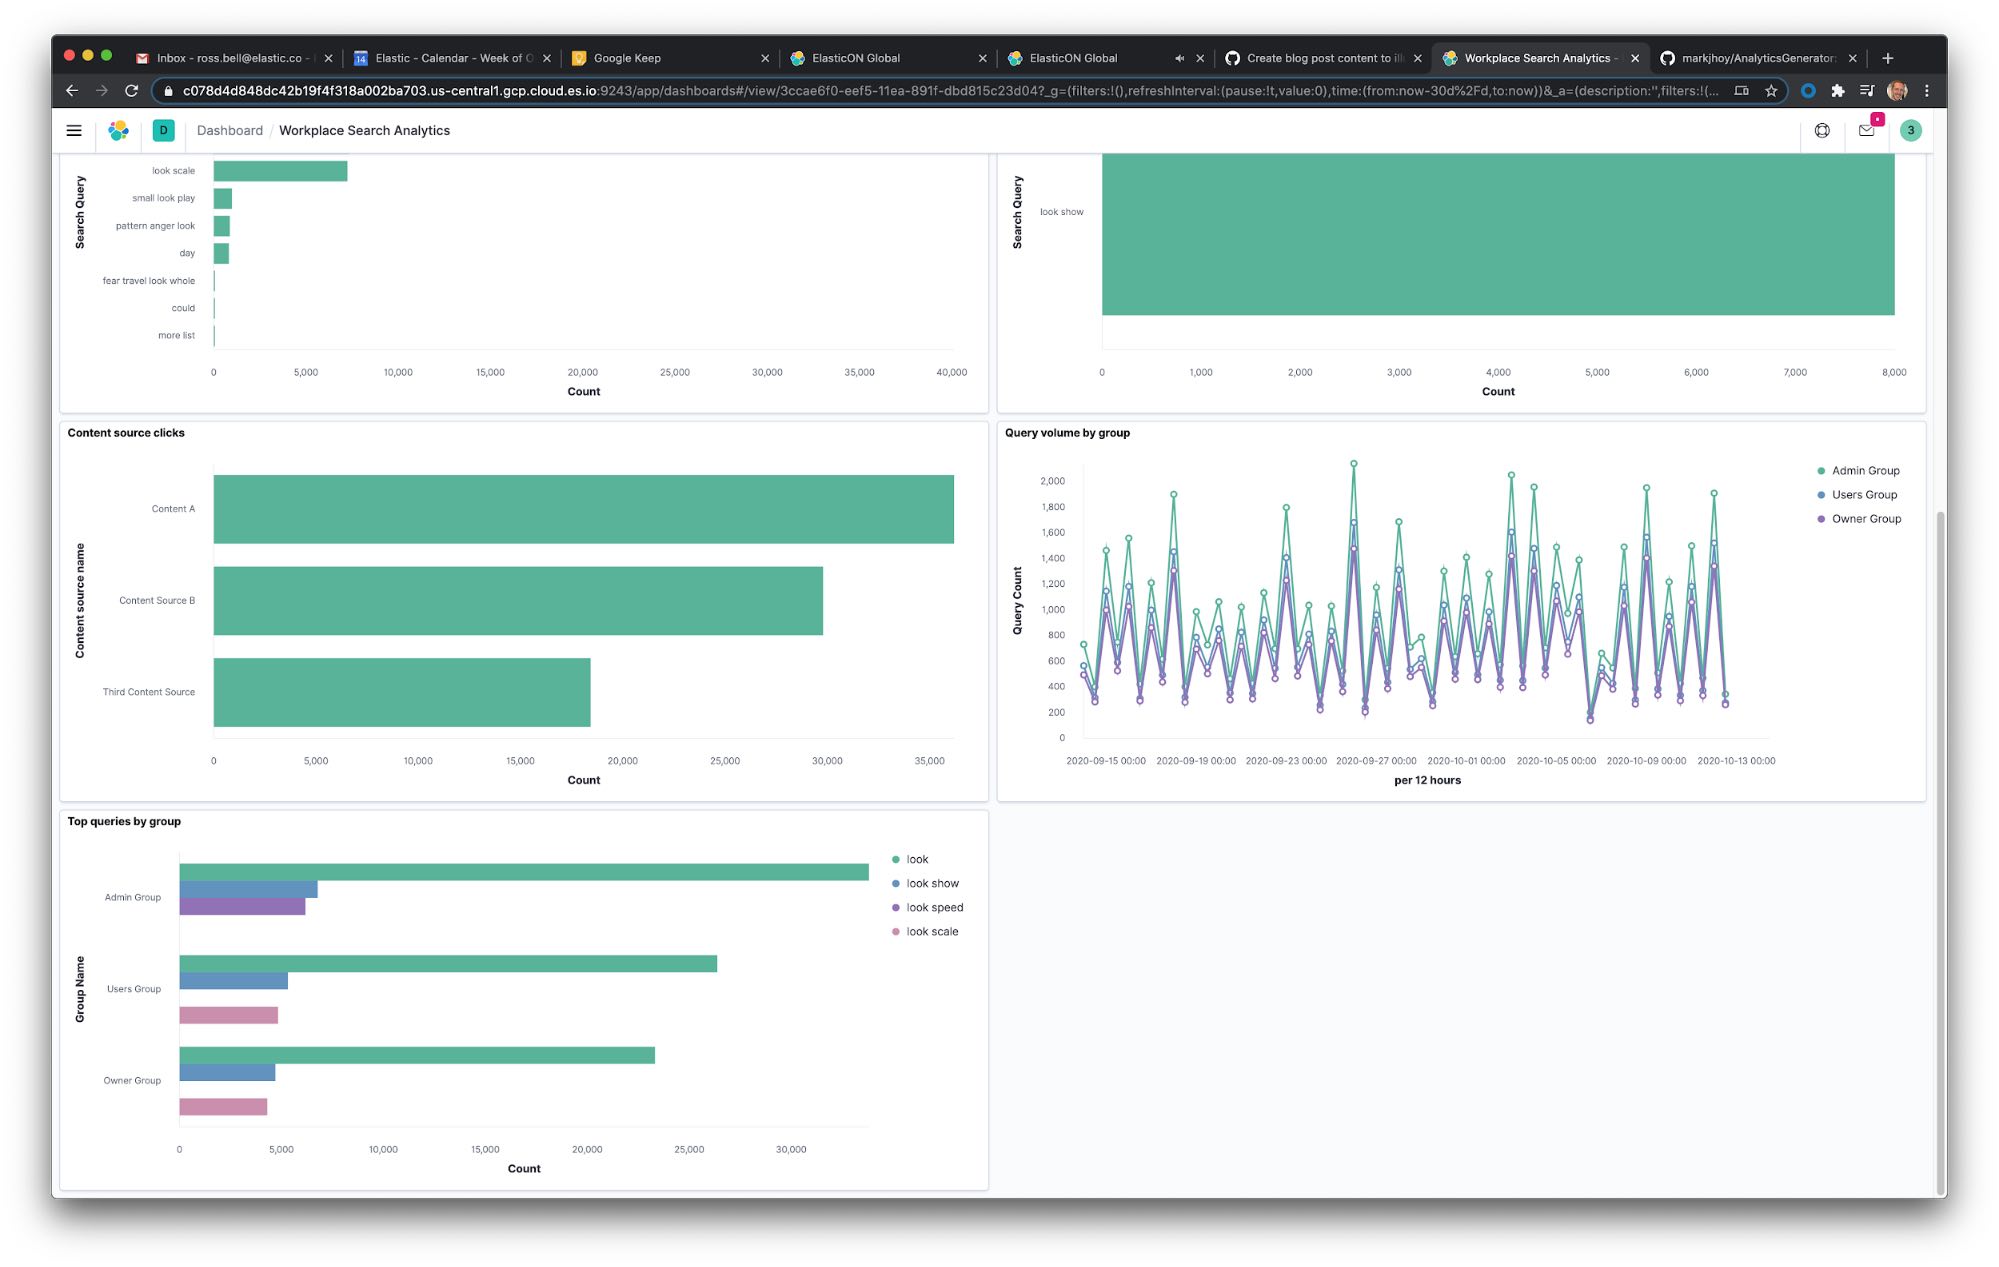
We’ll see Lens visualizations outlining things like:
- Search volume: How many searches were invoked.
- Click volume: How many results were clicked.
- Top queries: The most common queries your team used.
- Content source clicks: The number of clicks, by content source.
- Queries by group: The number of queries, by group.
- Top zero result queries: The queries which were invoked the most that did not return any results. A great way to find gaps in your organization’s content.
- … And more!
We can even add to or modify the existing visualizations to further build out our dashboard. However, keep in mind that if we re-import the original dashboard ndjson file, we will end up overwriting the current state of the dashboard.
What’s next?
Elastic Workplace Search will continue to enhance this tracked analytics data. A usage question that’s still somewhat difficult to visualize in Kibana is: what are the top searches that result in zero clicks? A possible approach is to make use of transforms to produce summary events. For further reading on topics like this, you can find a great writeup in a prior blog post: Analyzing online search relevance metrics with the Elastic Stack. Rest assured, look for functionality like this and more in future versions of Workplace Search.
Workplace Search brings unified search across all of your organization’s workplace tools, like Slack, GitHub, Google Drive, Salesforce, and more. Sign up for a free trial of Elastic Workplace Search on Elastic Cloud and bring a fast, functional organization-wide search experience to your team. A tremendous amount of key features are available for free under the Elastic Basic license.