On-demand webinar
Getting Started with Kibana
Hosted by:

Ninoslav Miskovic
Principal Product Manager, Kibana
Elastic

Teresa Alvarez Soler
Principal Product Manager
Elastic
Overview
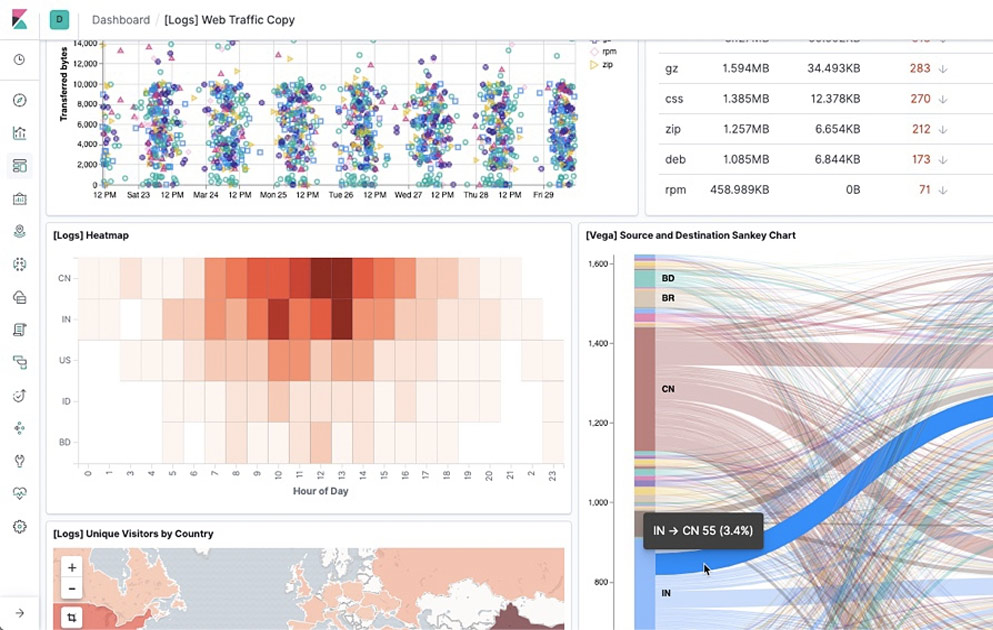
Kibana is a window into the Elastic Stack and the user interface for the Elasticsearch Platform. It allows you to visualize and explore data as well as manage and monitor the entire Elastic Stack. This webinar is perfect for users who are new to Kibana and are looking for a primer on how to get started with exploring data, creating visualizations, and setting up a dashboard. Watch a demo of going from a Kibana installation to a full dashboard in a matter of minutes.
Highlights include:
- Introduction to the ELK Stack and Kibana: Understand the components and synergy of Elasticsearch, Logstash, and Kibana.
- Exploring data with Discover: Learn the differences between QueryDSL and ES|QL and how to effectively ingest and explore data.
- Creating interactive dashboards: Watch a live demo on building dashboards with various visualizations, filters, and drilldowns.
- Real-world use cases: See practical examples and solutions using sample data sets and logs.
Additional Resources:
- Kibana documentation
- ES|QL documentation
- Kibana discussion forum
You can try hosted Kibana (and Elasticsearch) with a no-cost Elastic Cloud 14-day trial

View next
Upcoming webinar
Elasticライブウェビナー:Elasticで構築する次世代自律型ワークフロー -Agent Builderによるエージェント開発とWorkflowsによる統合管理-