Synthetic Monitoring
Proactively monitor user journeys with synthetic monitoring integrated with GitOps
Monitor critical user journeys from our global testing infrastructure and understand the impact of web and front end performance on user experience. Get complete end-to-end visibility into your website performance, functionality, and availability – from development to production – and catch problems before your customers do.
Synthetic monitoring enables you to simulate, track, and visualize the performance of your critical user journeys.
Learn moreTesting and monitoring are two sides of the same coin. Is your site functioning correctly? Are visitors bouncing due to long load times? Find out how to test and monitor end-user experience with synthetic monitoring.
Read nowLearn how to get started with Elastic’s all-new synthetic monitoring to gain the insights you need to drive better business outcomes.
Watch nowTest user journeys to
deliver a great customer experience
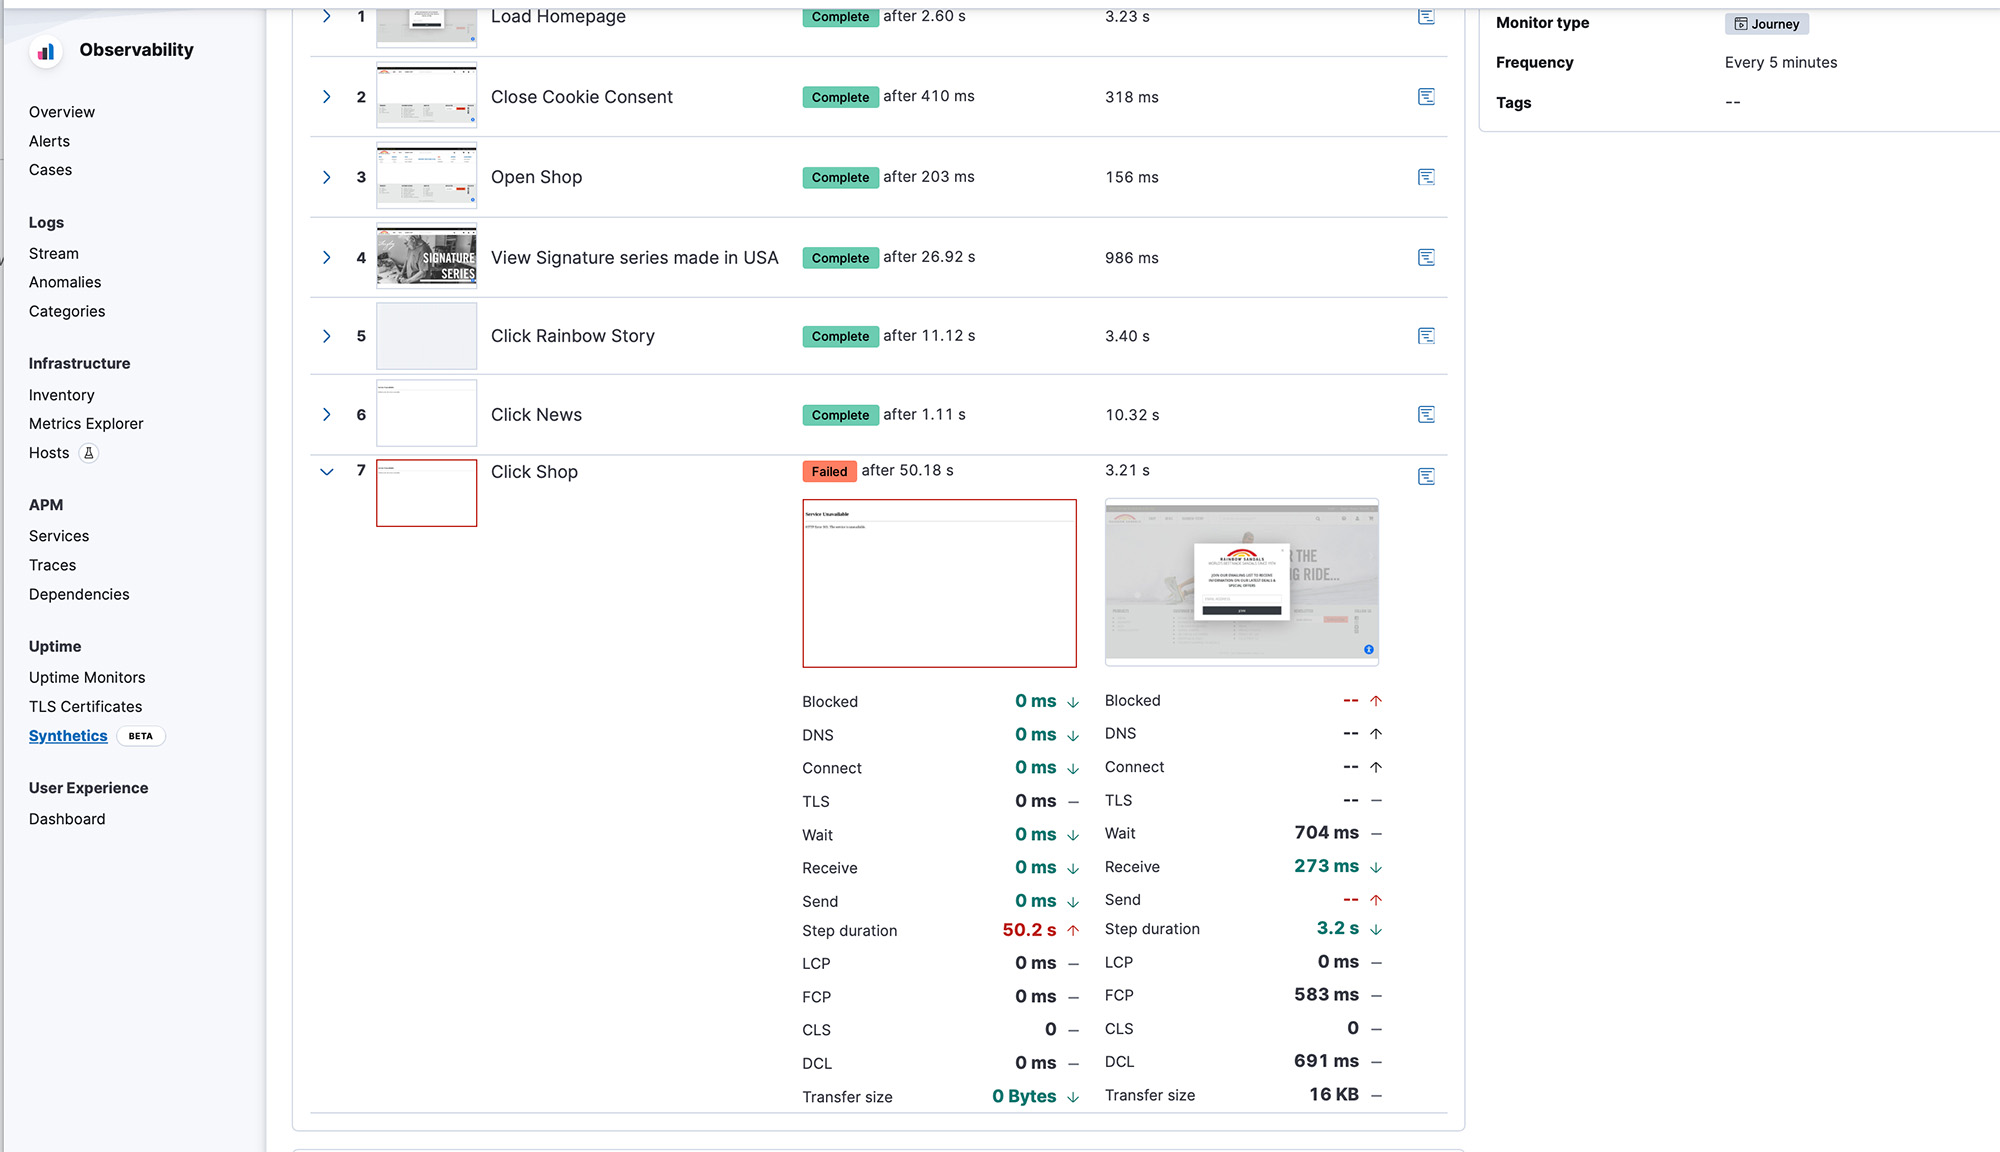
Front-end synthetic monitoring is a vital complementary capability to APM and infrastructure observability that provides an unparalleled perspective on your application's critical flows through the eyes of the user. Create test scripts with a point-and-click script recorder and simulate the user experience across multi-step journeys, such as the checkout flow for an ecommerce store or the transaction flow of an internal trading application. Capture a detailed breakdown of status information and errors along the journey and use waterfall views to identify and fix problematic areas to create exceptional digital experiences.
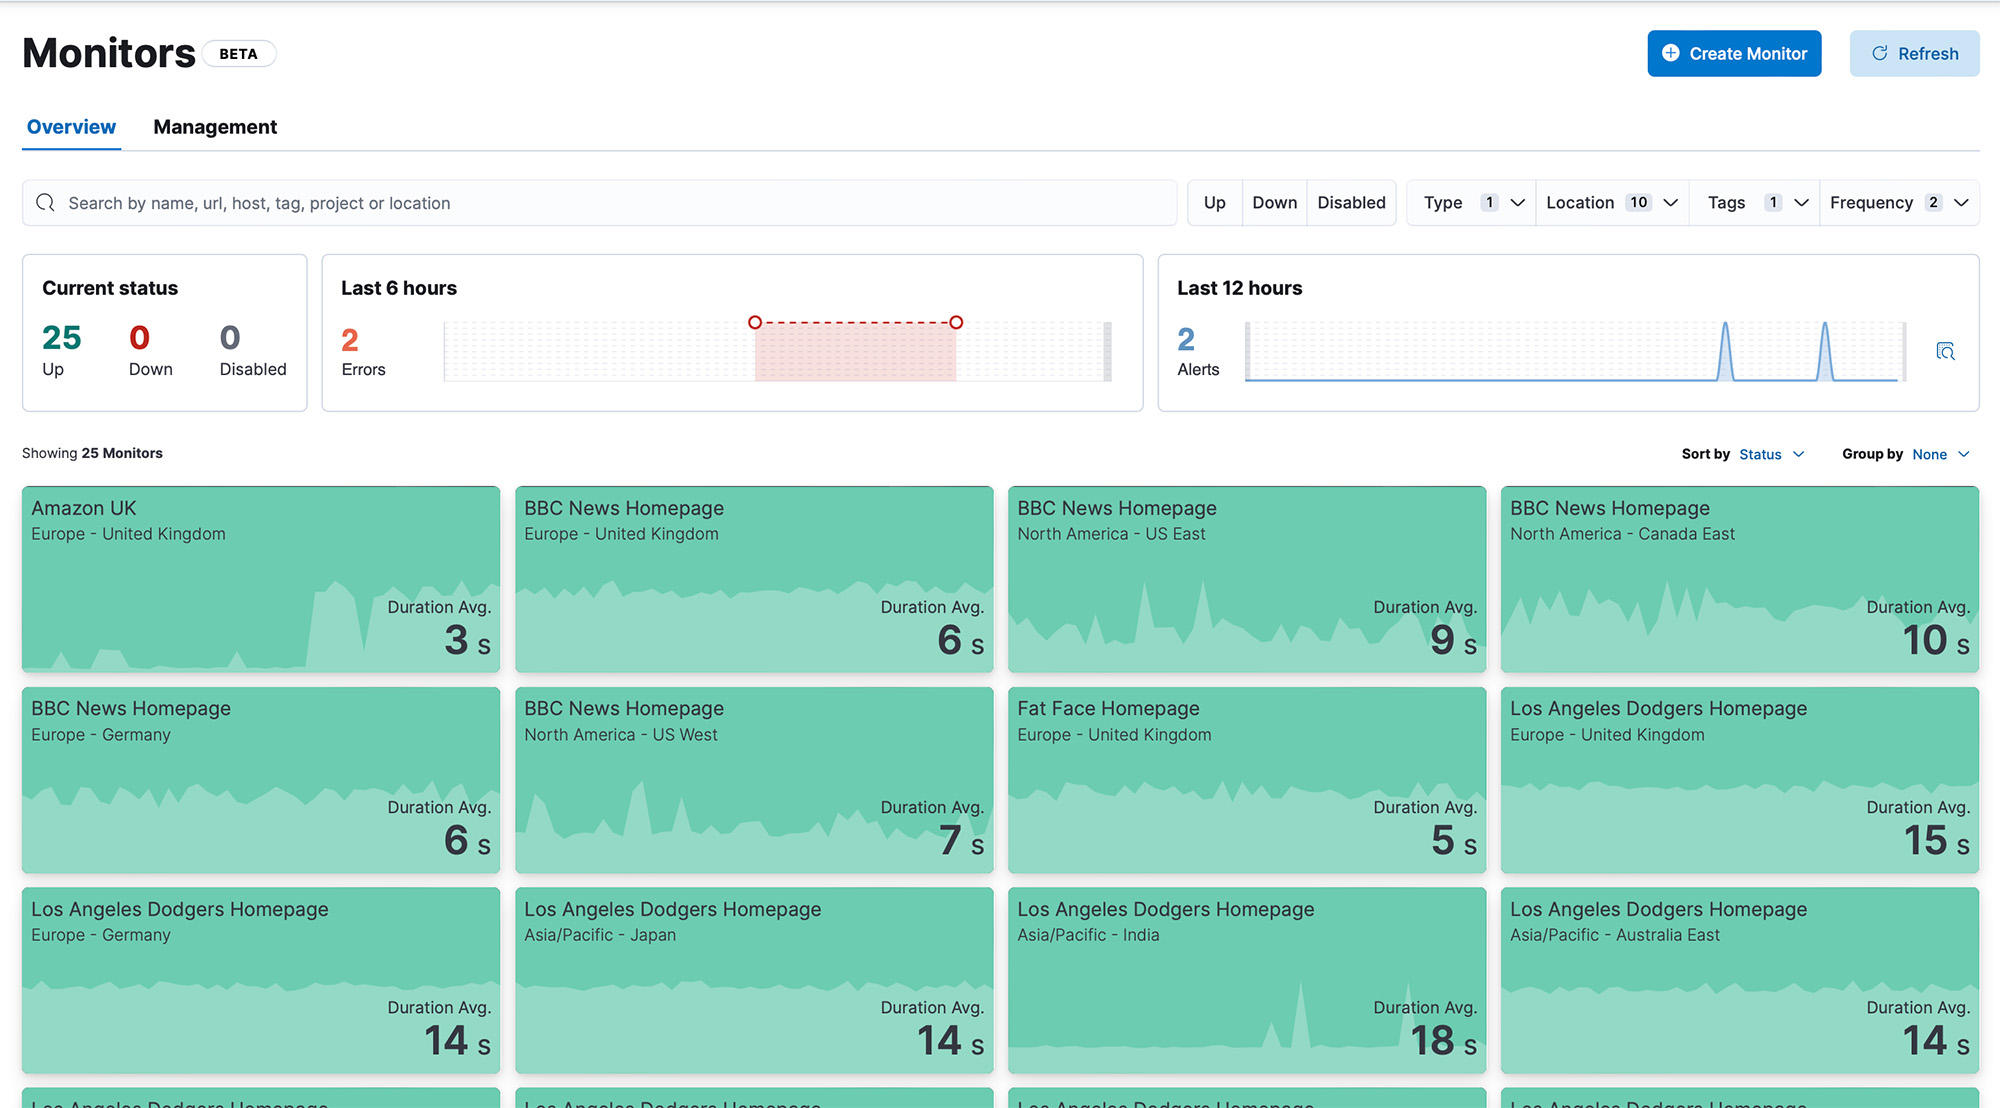
Elevate the SRE experience
Benefit from end-to-end workflows tailored specifically for SREs:dedicated error detail pages, performance trend analysis, and custom charts that provide crucial information at a glance. Effortlessly triage and diagnose issues by comparing the last successful test run against the failed one. Gain essential visibility into third-party dependencies to optimize performance. Leverage proactive alerts and seamless integration with incident management tools to deliver exceptional user experiences.
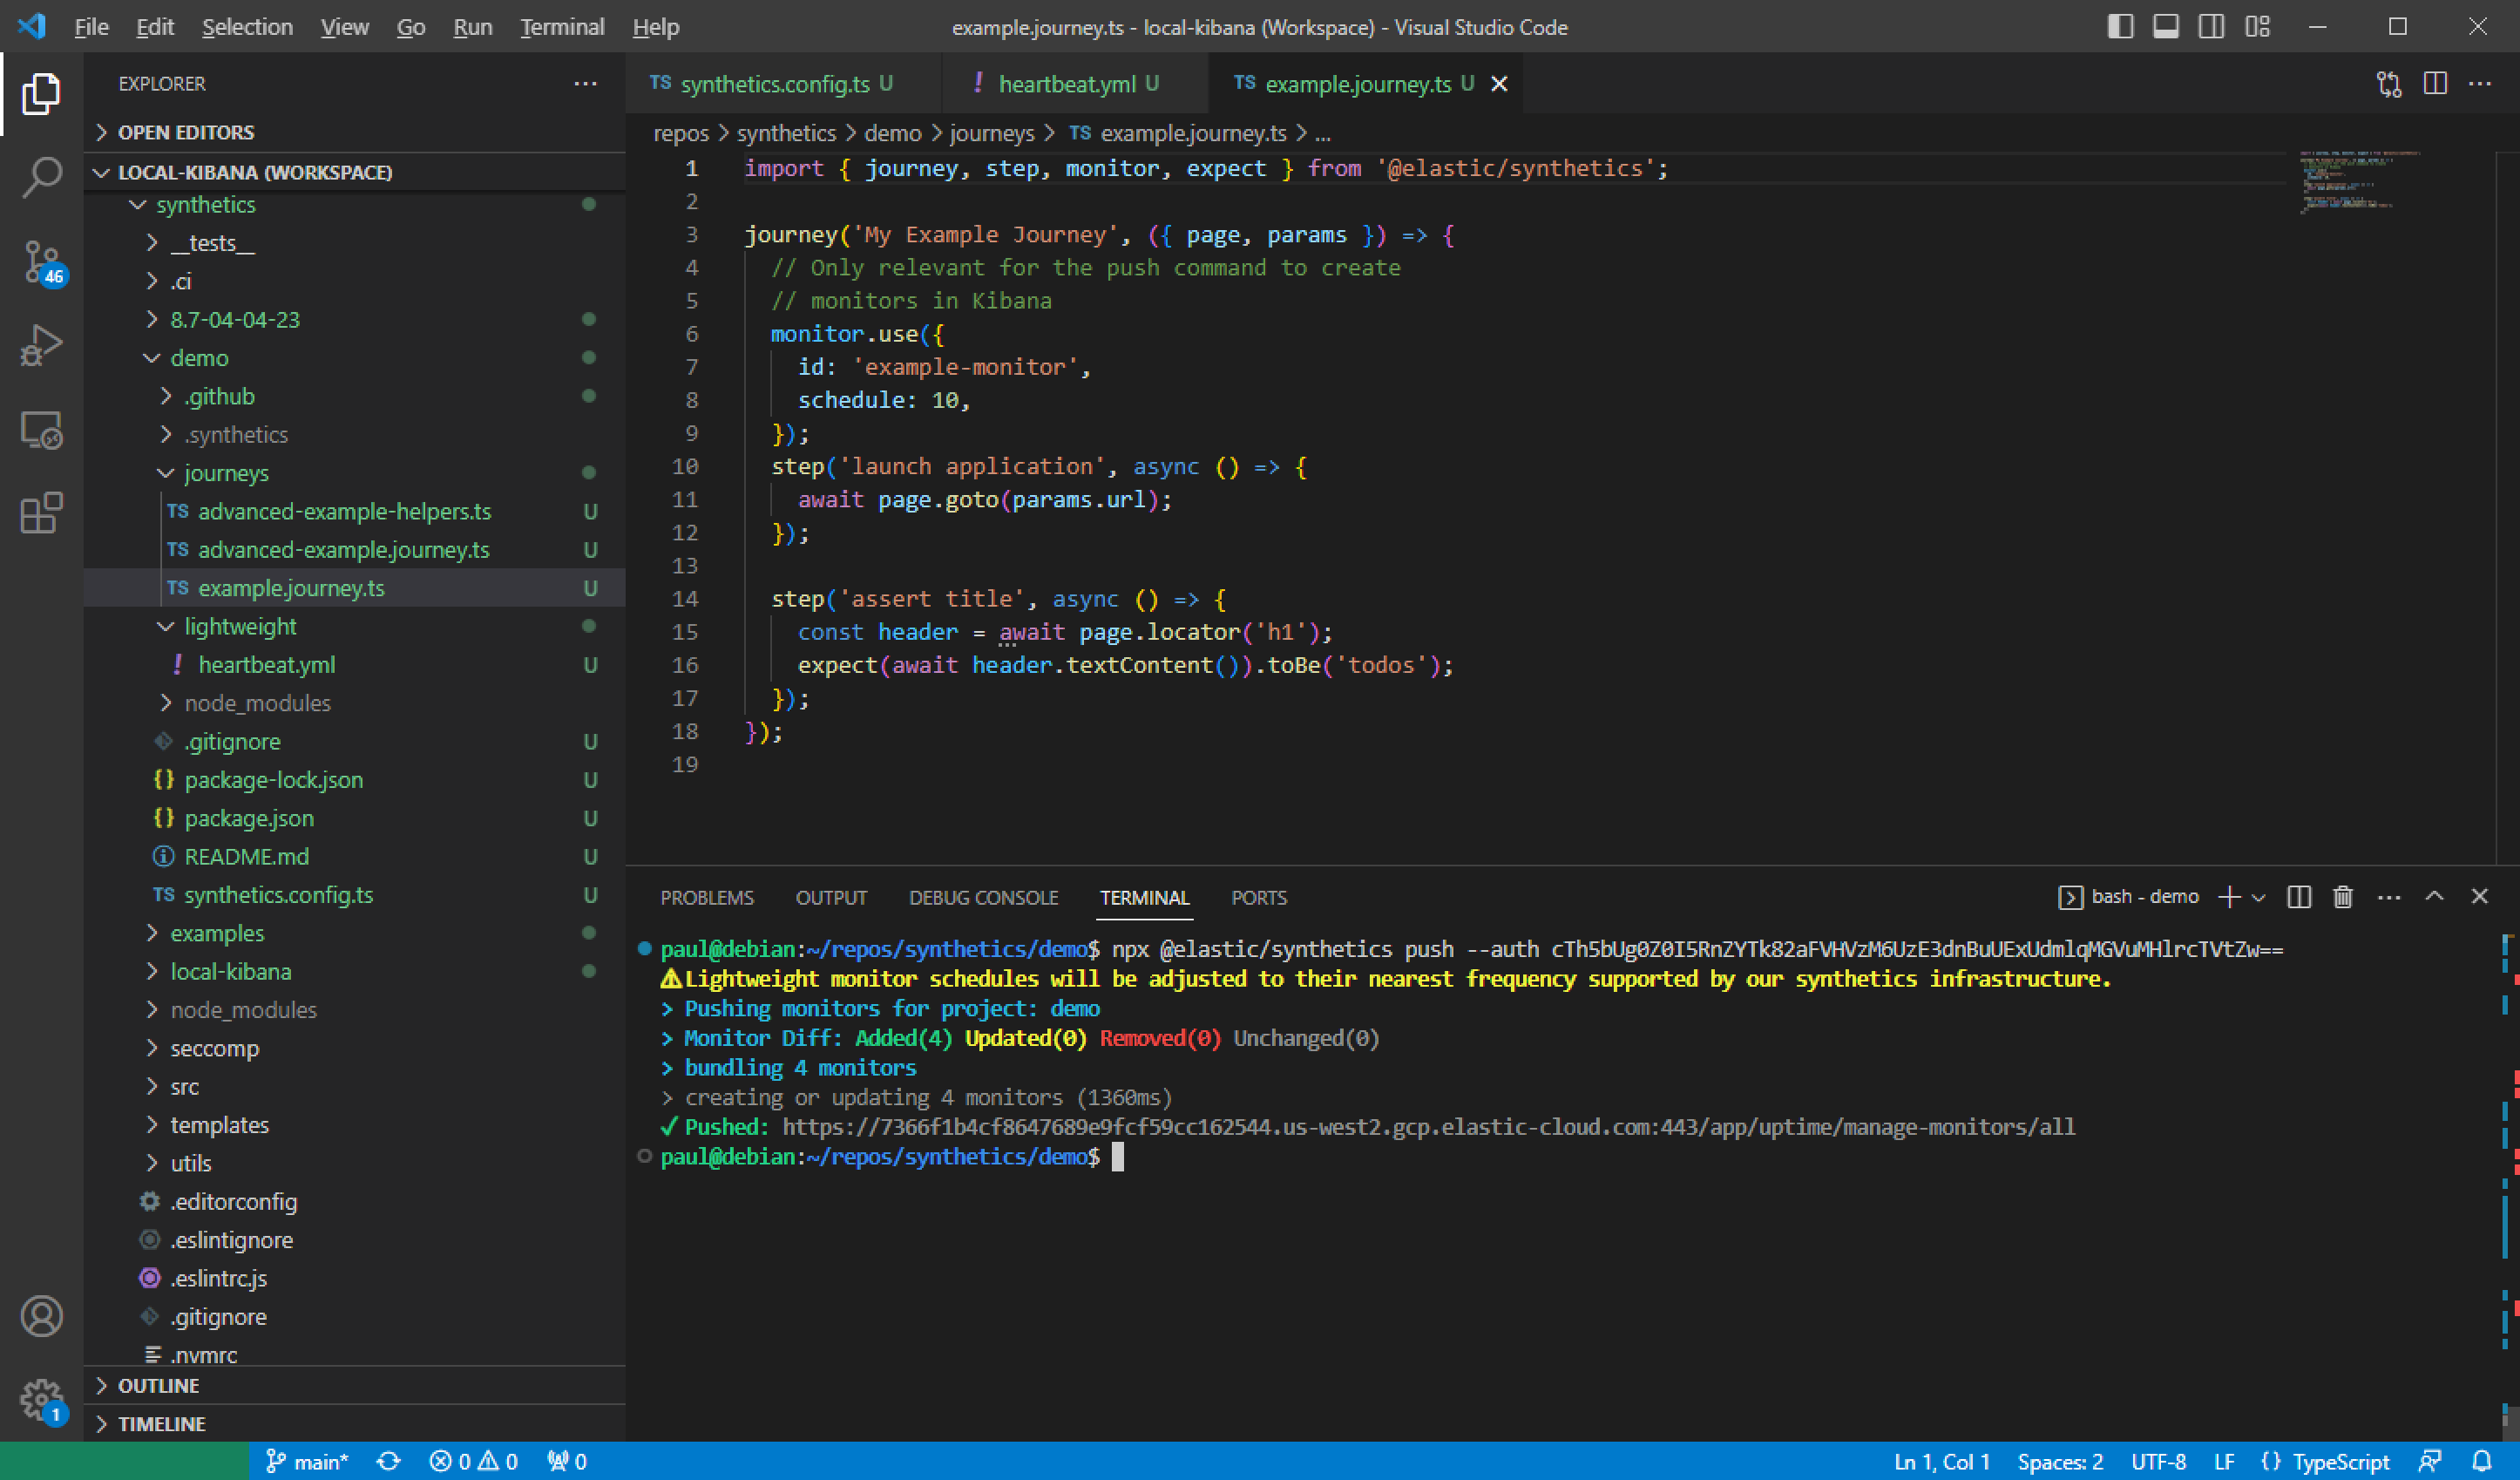
Streamline the testing process from dev to production with GitOps
Experience an industry-first in synthetic monitoring and manage your monitors as code. Write and verify tests in pre-production, then effortlessly push the test scripts with your code for continued testing in production. With seamless built-in GitOps management, you can eliminate the lag between code releases and test updates, reuse test scripts to reduce effort, and simplify the management of monitors and scripts.
Synthetic monitoring without the maintenance
Say goodbye to hardware management, capacity planning, scaling, updating, and patching. Enjoy the convenience of Elastic’s global, managed testing infrastructure and conduct lightweight and full browser tests with ease. Benefit from additional features such as automatic scaling, built-in security, and seamless integration with Elastic Observability. Private testing locations are also available for use cases that require a testing agent to be deployed on premises.
Synthetic monitoring is just one way to observe your applications
Monitor your applications, infrastructure, and your users all within a single solution - Elastic Observability.