Quickstart: Unified Kubernetes Observability with Elastic Distributions of OpenTelemetry (EDOT)
In this quickstart guide, you’ll learn how to send Kubernetes logs, metrics, and application traces to Elasticsearch, using the OpenTelemetry Operator to orchestrate Elastic Distributions of OpenTelemetry (EDOT) Collectors and SDK instances.
All the components are deployed through the opentelemetry-kube-stack helm chart. They include:
- OpenTelemetry Operator.
DaemonSetEDOT Collector configured for node level metrics.DeploymentEDOT Collector configured for cluster level metrics.Instrumentationobject for applications auto-instrumentation.
For a more detailed description of the components and advanced configuration, refer to elastic/opentelemetry.
- An Elastic Observability Serverless project. To learn more, refer to Create an Observability project.
- A running Kubernetes cluster (v1.23 or later).
- Kubectl.
- Helm version 3.9+ up to and including 3.21.0.
- (optional) Cert-manager, if you opt for automatic generation and renewal of TLS certificates.
- An Elasticsearch cluster for storing and searching your data, and Kibana for visualizing and managing your data. This quickstart is available for all Elastic deployment models. To get started quickly, try out Elastic Cloud.
- A running Kubernetes cluster (v1.23 or later).
- Kubectl.
- Helm version 3.9+ up to and including 3.21.0.
- (optional) Cert-manager, if you opt for automatic generation and renewal of TLS certificates.
Create a new Elastic Observability Serverless project, or open an existing one.
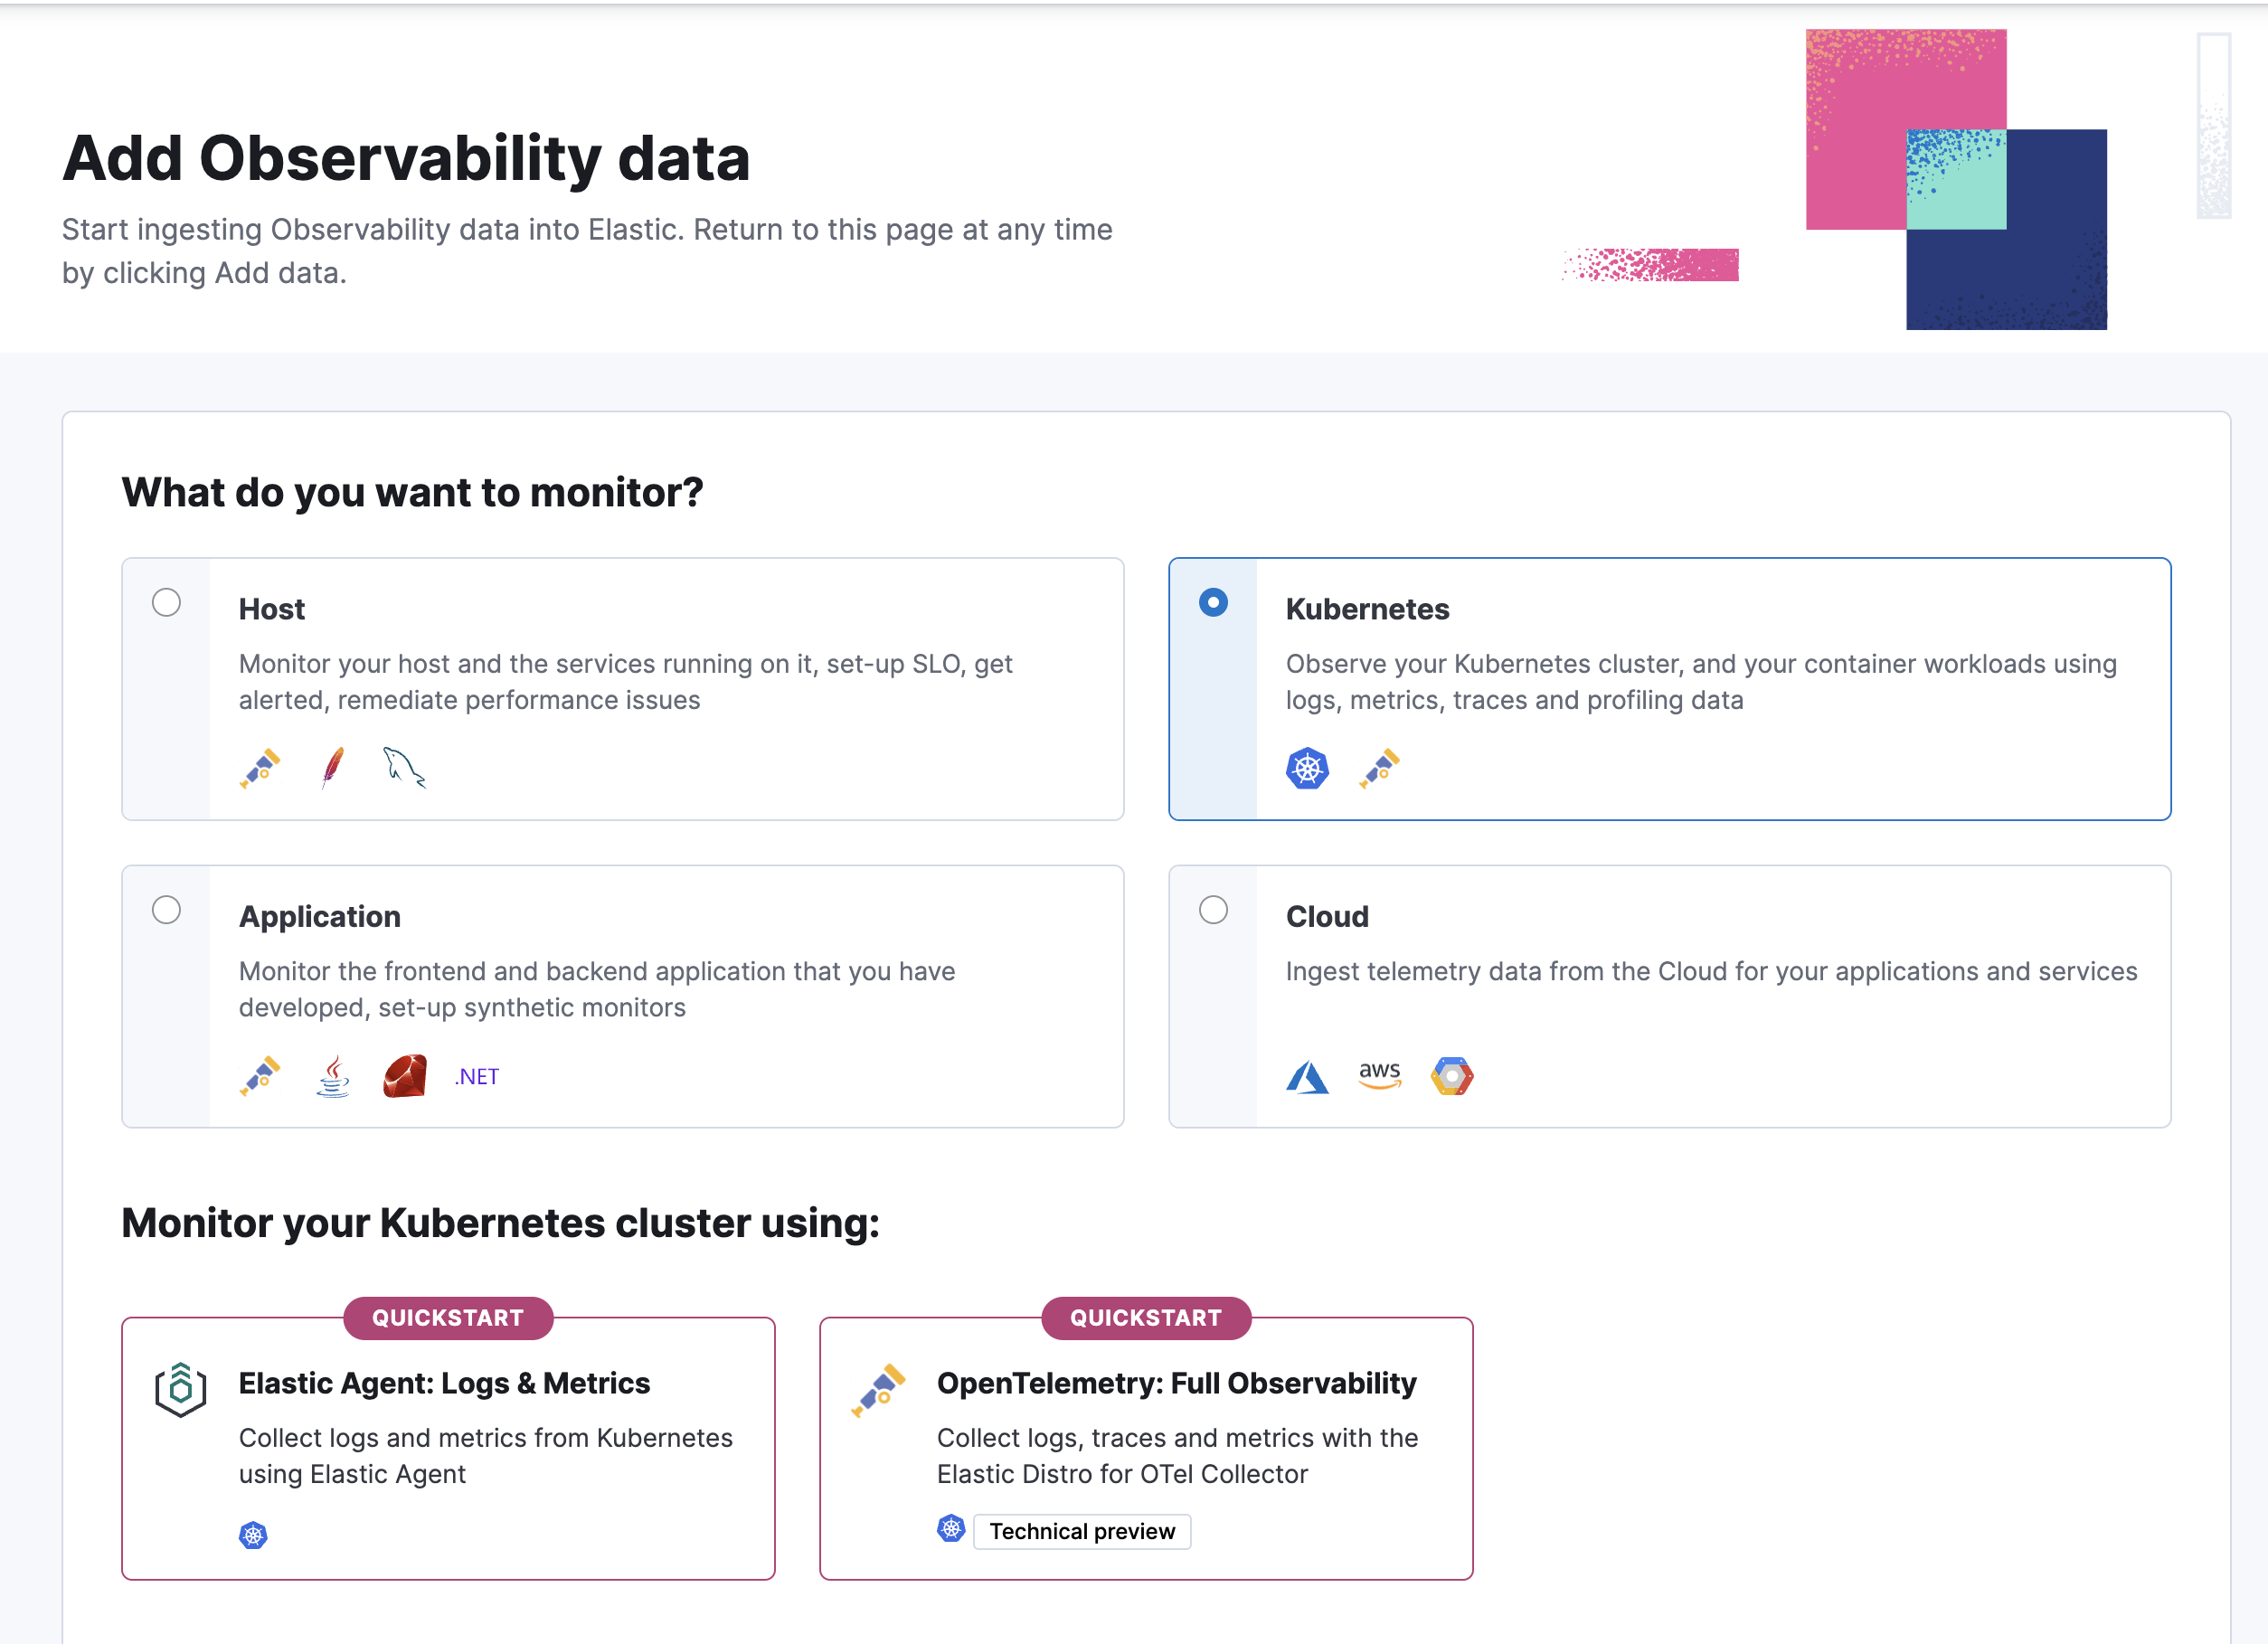
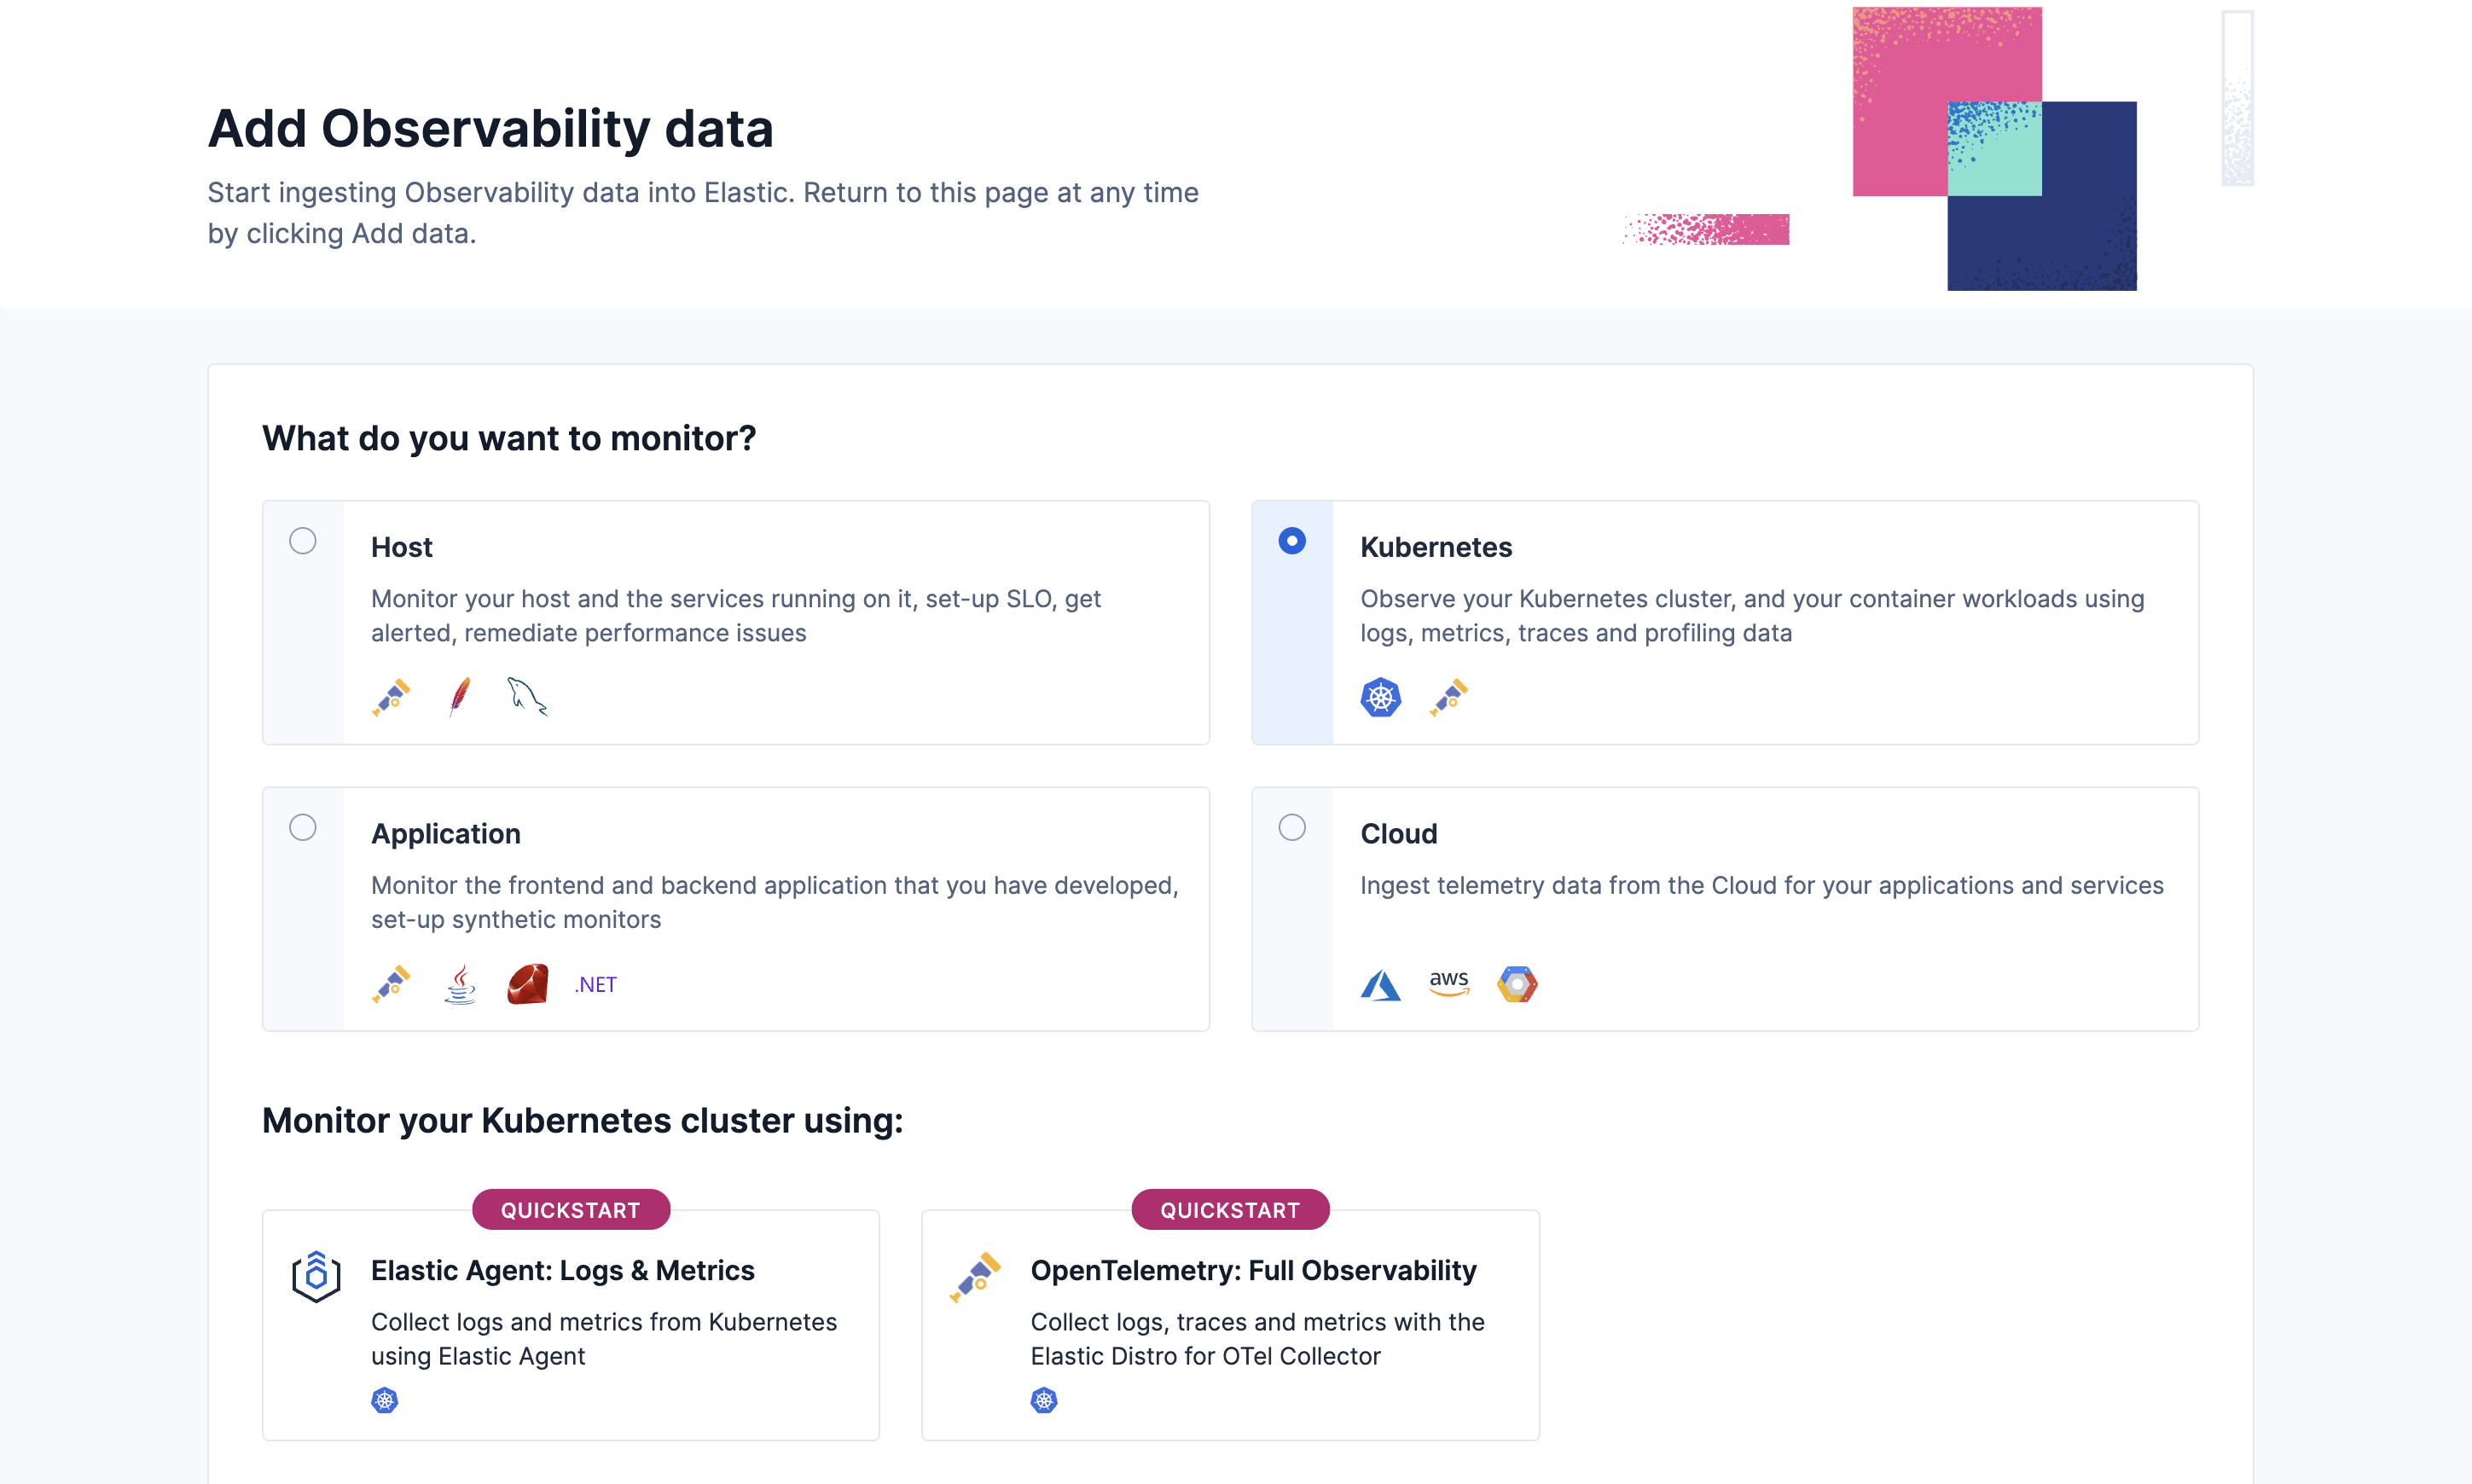
In your Elastic Observability Serverless project, go to Add Data.
Under What do you want to monitor? select Kubernetes, and then select OpenTelemetry: Full Observability.
Follow the on-screen instructions to install all needed components.
NoteThe default installation deploys the OpenTelemetry Operator with a self-signed TLS certificate valid for 365 days. This certificate won’t be renewed unless the Helm Chart release is manually updated. Refer to the cert-manager integrated installation guide to enable automatic certificate generation and renewal using cert-manager.
Deploy the OpenTelemetry Operator and EDOT Collectors using the kube-stack Helm chart with the provided
values.yamlfile. You will run a few commands to:- Add the helm chart repository needed for the installation.
- Create a namespace.
- Create a secret with an API Key and the Elasticsearch endpoint to be used by the collectors.
- Install the
opentelemetry-kube-stackhelm chart with the providedvalues.yaml. - Optionally, for instrumenting applications, apply the corresponding
annotationsas shown in Kibana.
In Kibana, go to the Observability UI and click Add Data.
Under What do you want to monitor? select Kubernetes, and then select OpenTelemetry: Full Observability.
Follow the on-screen instructions to install all needed components.
NoteThe default installation deploys the OpenTelemetry Operator with a self-signed TLS certificate valid for 365 days. This certificate won’t be renewed unless the Helm Chart release is manually updated. Refer to the cert-manager integrated installation guide to enable automatic certificate generation and renewal using cert-manager.
Deploy the OpenTelemetry Operator and EDOT Collectors using the kube-stack Helm chart with the provided
values.yamlfile. You will run a few commands to:- Add the helm chart repository needed for the installation.
- Create a namespace.
- Create a secret with an API Key and the Elasticsearch endpoint to be used by the collectors.
- Install the
opentelemetry-kube-stackhelm chart with the providedvalues.yaml. - Optionally, for instrumenting applications, apply the corresponding
annotationsas shown in Kibana.
After installation is complete and all relevant data is flowing into Elastic, the Visualize your data section provides a link to the [OTEL][Metrics Kubernetes]Cluster Overview dashboard used to monitor the health of the cluster.

You can search and analyze Kubernetes logs using Elastic’s Discover capability. Find Discover in the main menu or use the global search field.

Kubernetes out-of-the-box dashboards allow you to analyze Kubernetes metrics within Kibana. Go to Dashboards → Analytics and search for Kubernetes. The Kubernetes Overview dashboard shows metrics for the entire Kubernetes Cluster. All the nodes, pods, and CPU and memory usage.

Kibana allows you to analyze logs with interactive dashboards to derive insights, automate workflows, find anomalies and trends, and more. When you select Dashboards → Analytics, you can select Create dashboard and customize your new dashboard to your needs.
Select Alerts and then Create rules. This allows you to get notifications when various events happen, for example when latency is anomalous, metric aggregation exceeds threshold, and so on. Notifications are sent through email, Jira, Slack, and more.
Find Machine Learning in the main menu or use the global search field. Then select Anomaly Detection → Jobs to create a machine learning job. By setting up machine learning jobs, for example, rather than having an alert when a specific percentage of memory usage has occurred, you can know when the usage is unusual.

- To troubleshoot deployment and installation, refer to installation verification.
- For application instrumentation details, refer to Instrumenting applications with EDOT SDKs on Kubernetes.
- To customize the configuration, refer to custom configuration.
- Refer to Observability overview for a description of other useful features.