Differentiated customer experience
By deploying Kibana, and Elastic Maps, as part of their Elastic Observability solution, FURUNO Japan has more insights into on-ship data use and can help customers balance the cost and performance of ship-to-shore connectivity.
Proactive service at a reduced cost
The ability to detect impending hardware failures and conduct preventative maintenance has significant potential to reduce the occurrence and associated costs of urgent repairs.
Making growth possible
Using the Elasticsearch Service on Elastic Cloud, FURUNO is able to easily scale the solution to more customers and more vessels. FURUNO also has the potential to increase revenue by packaging and selling data plans more suited to customers’ needs.
FURUNO is a Japan-based electronics company that specializes in marine electronics, including radar systems, navigational instruments, and sonar technologies like fish finders. The company also provides satellite communication services, including onboard data services which have been enhanced by FURUNO’s use of the Elastic Stack.
Powering new insights from ship to shore
Up until the last ten years, FURUNO Japan's satellite communication services were used by the maritime industry mainly for essential operational communication. However, with people's growing expectations for anywhere, anytime connectivity, it was almost inevitable that FURUNO's commercial customers wanted to extend quality and sustained connectivity to include other business applications and access for the crew.
FURUNO had to find a way to help customers analyze and control data use in near real time without taking away bandwidth needed for operational purposes — and this ultimately led the company to Elastic. The Elastic Observability solution offered a way for FURUNO to send network traffic data from ship to shore every hour to proactively identify issues related to use and performance. Together with other features of the Elastic Stack, this helps FURUNO provide a differentiated service to customers, including preventative maintenance to keep them connected at sea.
Furuno’s journey with Elastic
Shining the light on excessive data use
When some of FURUNO’s customers were surprised by an increase in their monthly data charges and complained that their connections were too slow, the Information and Communications Technology Engineering team was tasked with finding out why so much data was being consumed. The team knew that it was important for crew welfare to communicate with friends and family, but they suspected high use of messaging platforms and social media were partially to blame for customers’ slow connections and excess data use. The difficulty was proving this, as it took one to two days on average and sometimes weeks to get usage data from FURUNO’s satellite partners — and the data contained tens of millions of spreadsheet entries, which made it difficult to analyze.
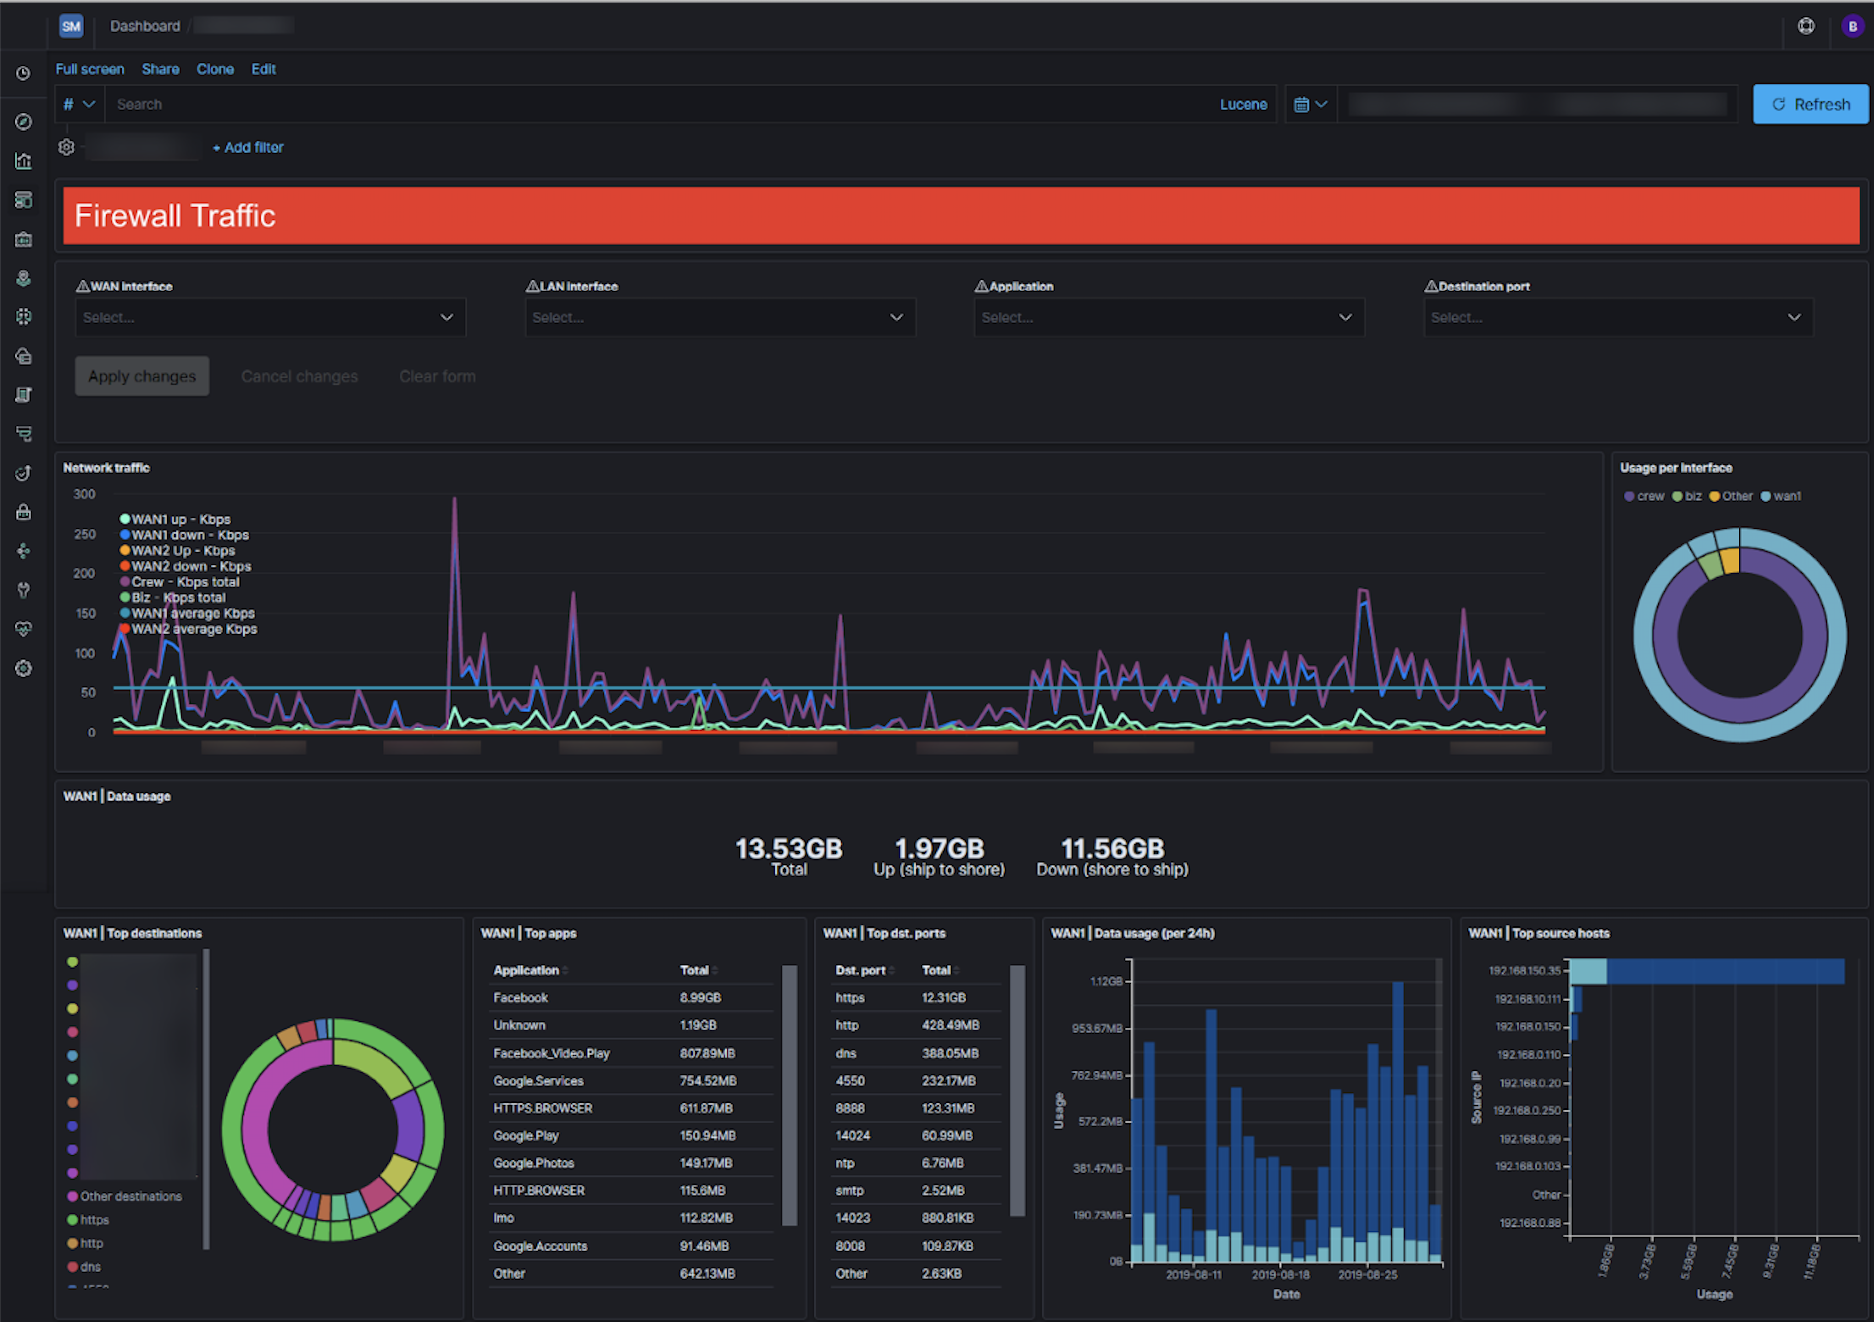
Ben de Vries, IT Specialist at FURUNO, said, “We needed to find out what was happening onboard the vessels and be able to explain to our customers which devices and services were consuming all of the data. I started collecting and analyzing data from our firewalls onboard, but the data was too noisy for us to make decisions or give customers the information they needed, without it taking hours or days.”
De Vries looked for an observability solution that could provide more frequent and granular insights on data use and would easily work with the different types of communications systems (and their related specific data types) on board vessels.
Establishing the right capabilities with Elastic
Elastic provided the flexibility and features that de Vries was after, especially when it came to the visualization power of Kibana, which made it possible for FURUNO to easily analyze data from all its hardware on board and get insight into data coming from firewalls. De Vries was able to spin up a demo in four weeks and showed management how he could use Kibana to quickly pinpoint which devices and applications were causing the excess data use. This information was exactly what customers needed to understand their charges, so management signed off on a wider rollout.
To support the wider rollout, de Vries signed up to the Amazon Elasticsearch Service. As an existing Amazon customer, FURUNO had access to the service within their existing tools so it made sense to trial it. However, after two weeks De Vries switched to the open source version of the Elastic Stack and hosted it on FURUNO’s AWS hardware for six months.
Quickly thereafter, FURUNO moved to the Elasticsearch Service on Elastic Cloud, which provided access to all of the latest commercial features from Elastic. Being easy to use, the Elasticsearch Service on Elastic Cloud offered the most value for FURUNO’s investment. Furthermore, as FURUNO works to improve connectivity services for all of its customers, the choice of Elasticsearch Service allows it to provision new hardware with a single click and seamlessly scale and deploy its Elastic solution to the rest of the customer fleet.
We ultimately decided to move to the Elasticsearch Service on Elastic Cloud because we wanted to make use of features like Elastic Maps, security, alerting, reporting, and Kibana Spaces. One of the other things we like about the Elasticsearch Service is that we don’t need to spend time managing our deployment; it just works.
From analyzing network traffic to tracking signal strength
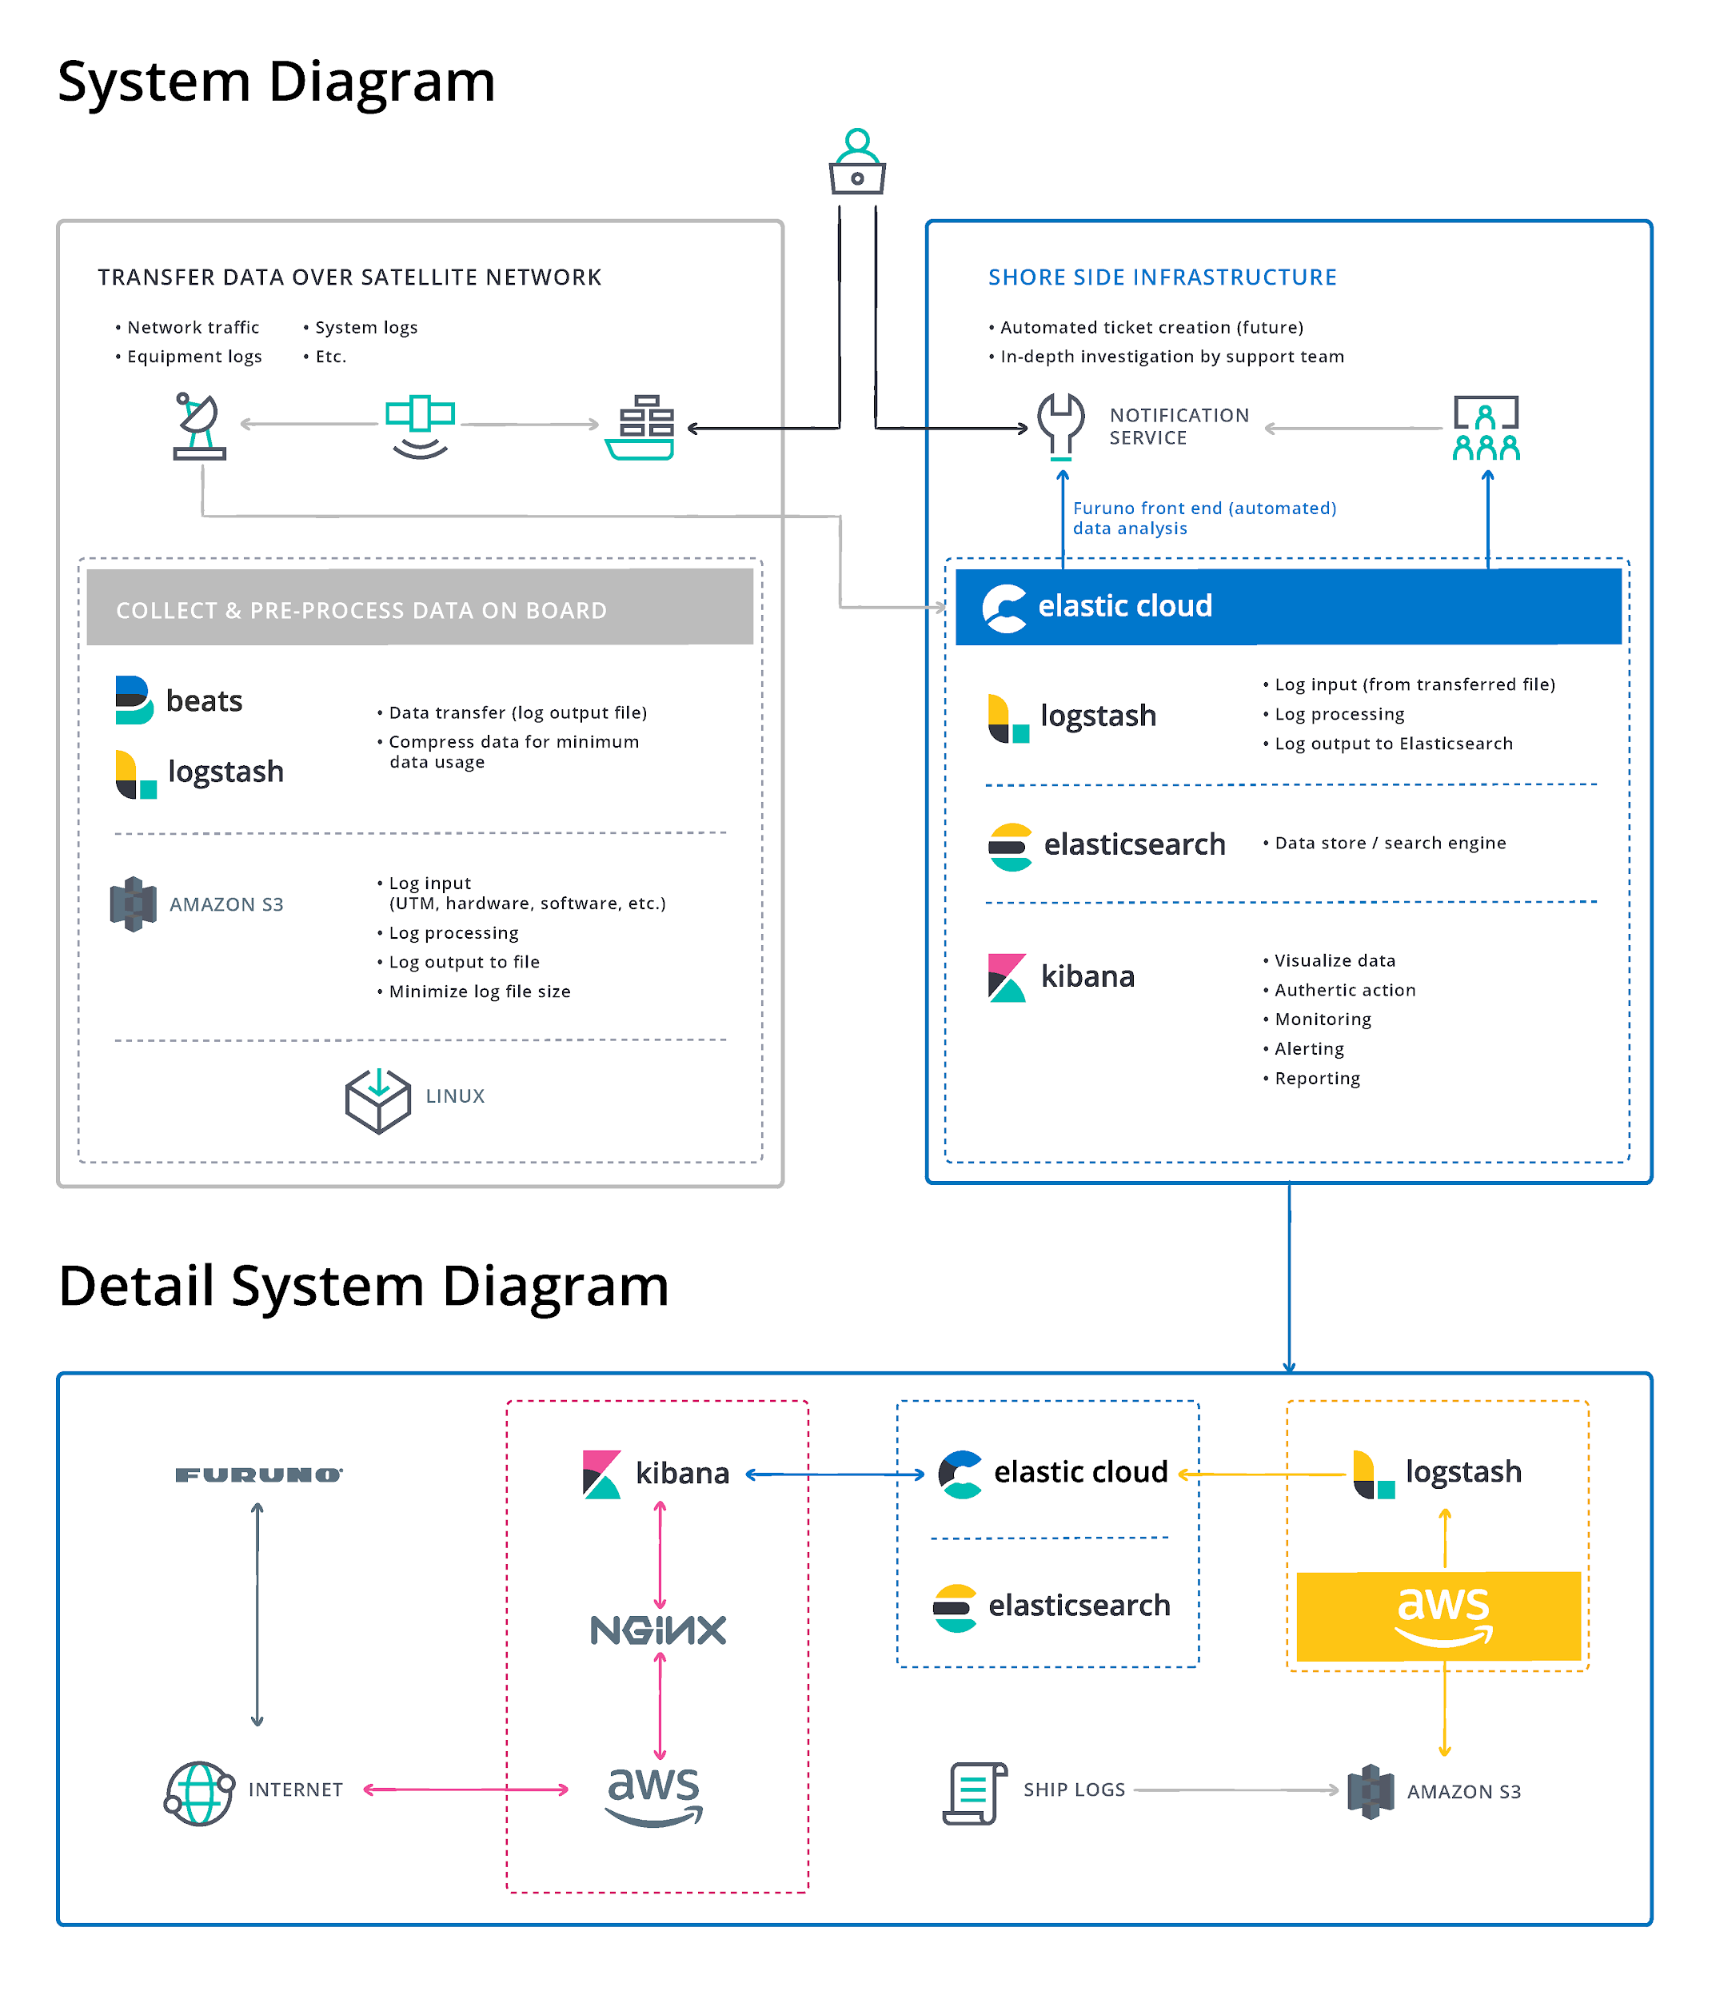
FURUNO is already using Elastic on 30 ships, with all but one of those rollouts taking place within the last six months. It now has a small computer on board each vessel which runs Logstash and Metricbeat and collects data from multiple systems, including firewalls, modems, antennas, and other communications equipment on board. Logstash filters out unnecessary data like repeat error messages before compressing the rest of the data and transmitting it on shore where Furuno is running Logstash, Metricbeat, and Filebeat. It’s then that the data is shipped into Elasticsearch and can be visualized in Kibana.
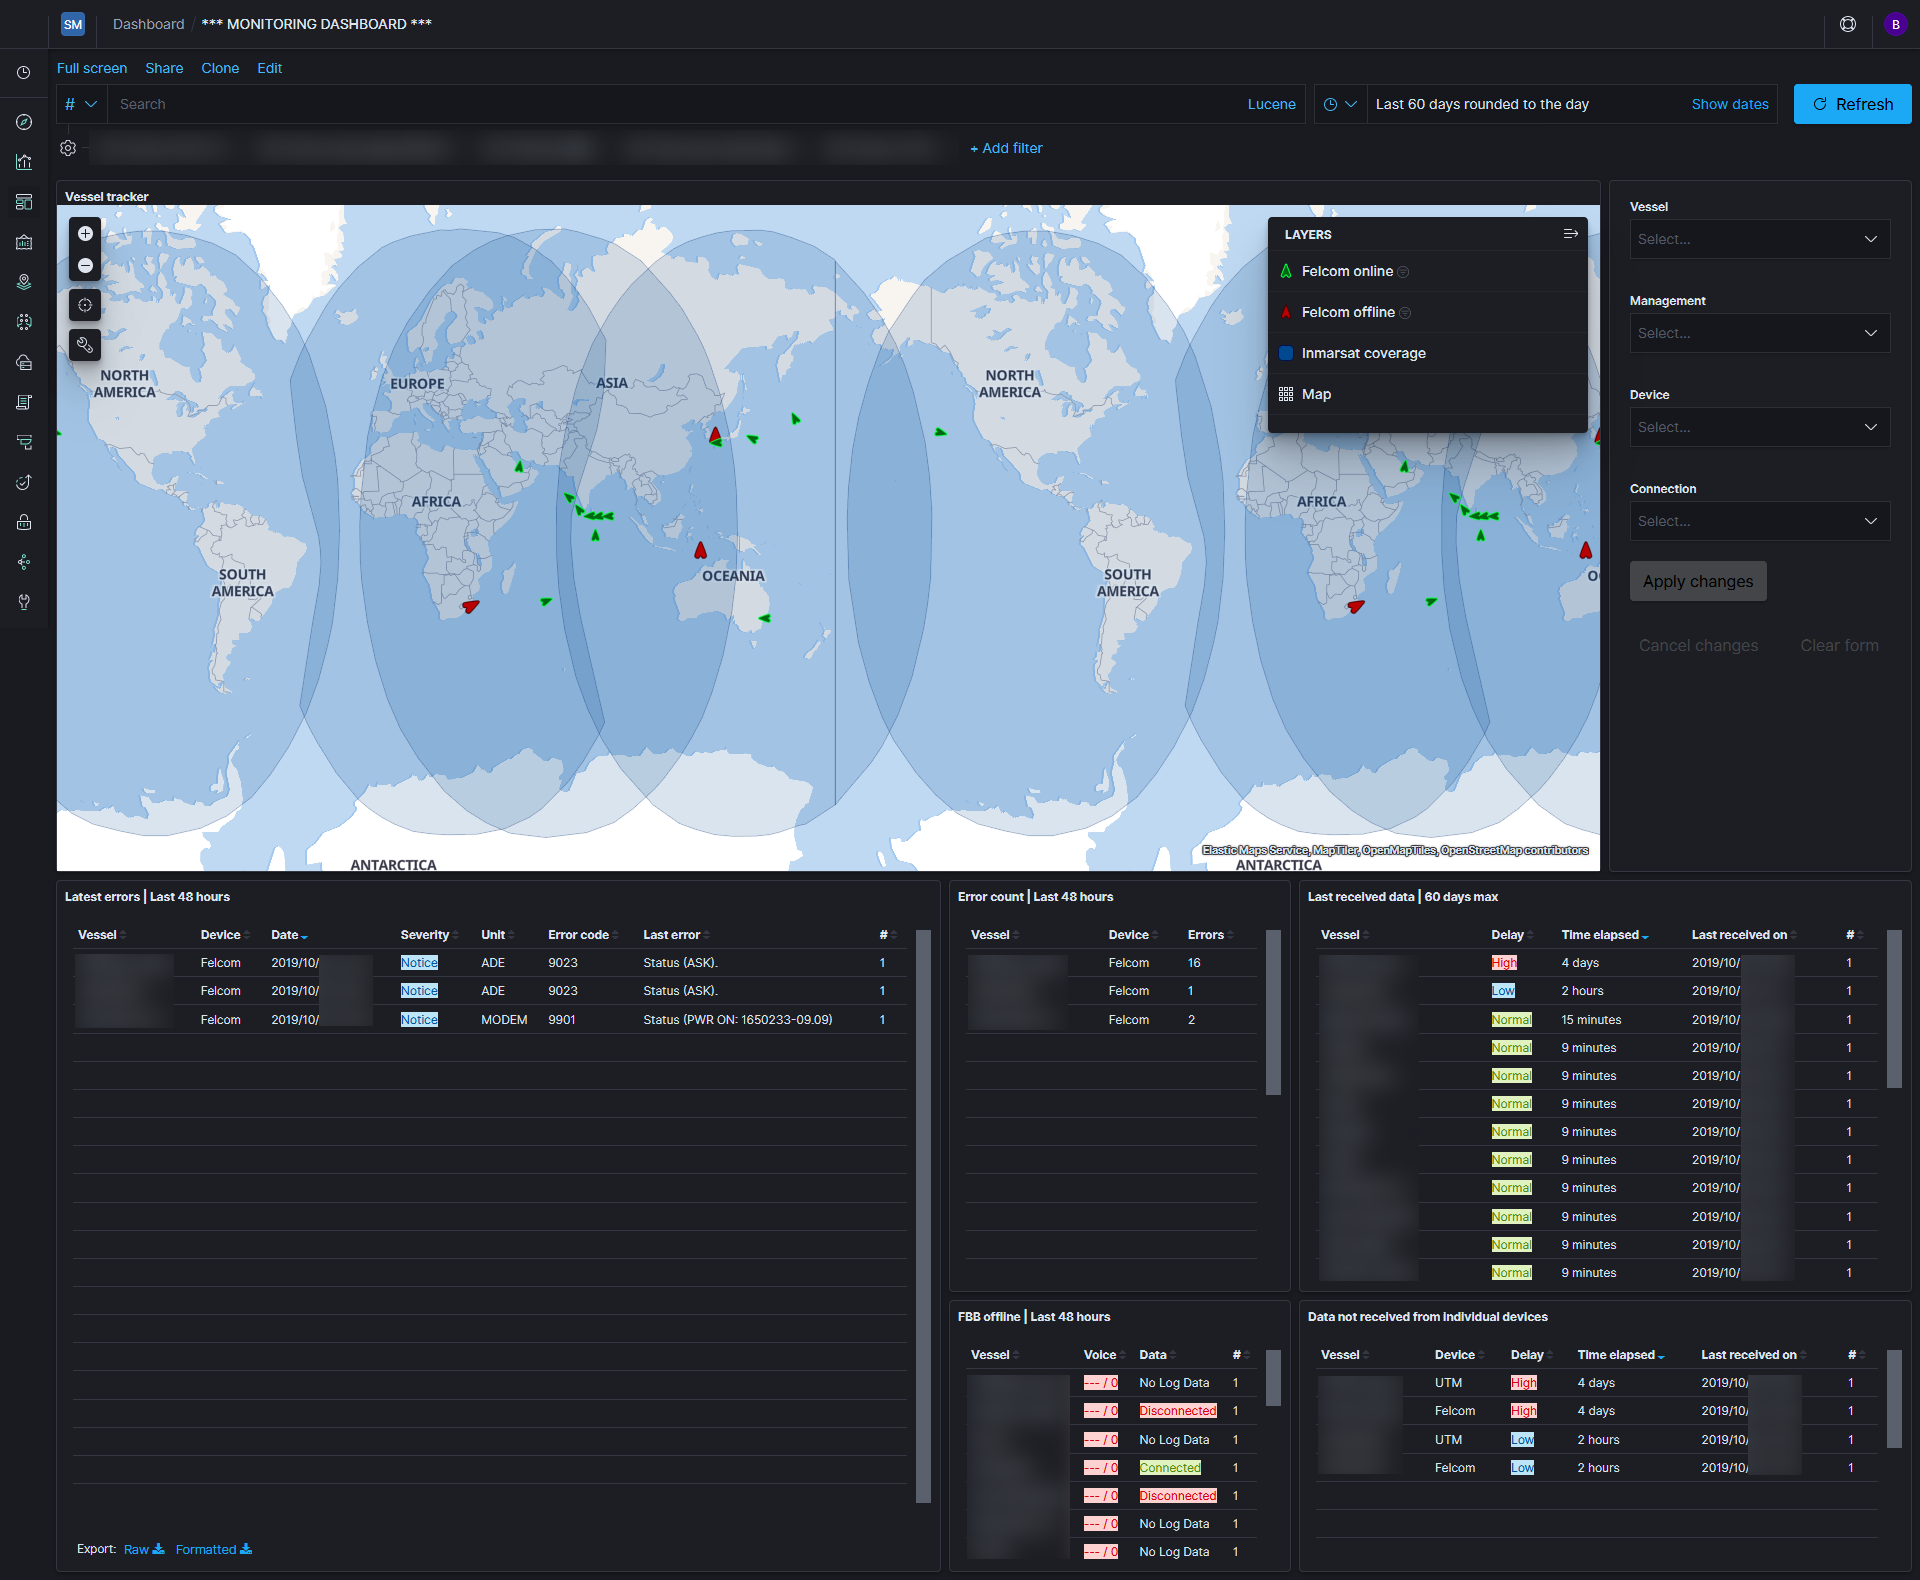
The company uses two types of dashboards to monitor and drill down into the data. The first uses Elastic Maps to plot the location of each vessel, allowing users to see at a glance if any of the vessels are experiencing connectivity problems. If they are, the user can drill down into the dedicated dashboard for that vessel and quickly identify the issue. This could be anything from a rogue business application consuming more bandwidth than normal to an issue with the vessel’s antenna. Also, with Elastic Maps, Furuno can determine if the issue is related to the vessel’s positioning or a problem with one of the satellite providers.
The company previously tracked vessel location using an in-house solution, but it was separate from their Elastic deployment, meaning they couldn’t get an integrated view of all of the connectivity challenges a customer might face. Now, with Elastic Maps in Kibana, support teams have all the information they need on each vessel together in one place.
“A lot of connectivity issues are related to the vessel’s location, so having the Maps app is really helpful and allows us to immediately identify if vessels are in a region without coverage,” said de Vries. “If they are outside the coverage area, we know that’s why there’s no connectivity and we don’t need to investigate. On the other hand, if they are inside the coverage area and we see there are errors, then we will investigate.”
Improving service and driving down costs
With Elastic, FURUNO can now get the data it needs to pinpoint sources of network performance issues in one hour as compared to one to two days in the past. It can also see which applications and devices are consuming the most data and correlate traffic to any issues with hardware or satellite coverage. This information helps the company have better conversations with customers who want to optimize the performance of their connectivity or reduce their bill.
Also, if satellite providers detect any traffic resulting from malware or viruses, FURUNO is able to help customers identify infected devices in as little as one hour. In the past, malware or viruses could have wreaked havoc on systems and impacted connectivity for hours or days while FURUNO monitored firewall traffic to find the infected device.
Information like error messages, signal strength, and location data collected from vessels’ hardware and antennae has also proved valuable in helping FURUNO identify connectivity problems and also identify when hardware is at risk of failing. The company can then take action and schedule preventative maintenance at a local port. This ensures customers remain connected, while also minimizing service costs.
“Up until we began using Elastic, a lot of time was spent collecting and graphing data in spreadsheets and that is no longer necessary. Instead, with Elastic, we can easily monitor whether the satellite communications equipment is operating as it should or if there are any errors. It is also possible to monitor on-board communication data and identify any unauthorized communications or virus infections,” said Miki Sato, who is the Assistant Manager at FURUNO Japan and in charge of technical support. “This allows us to inform customers of any problems at an early stage, and while investigation of the cause and countermeasures still requires deep expertise, the insights provided by Elastic are very meaningful and help drive resolution.”
These benefits are set to multiply as FURUNO extends its Elastic deployment from 30 vessels to several hundred across Japan and the wider Asia Pacific region. Other initiatives on FURUNO’s roadmap include using Kibana Spaces to control who can access and edit different dashboards and visualizations. This will help IT to secure and organize use of Kibana for internal users and also monetize data by making dashboards available directly to customers for a fee.
Finally, FURUNO plans to use Elastic to analyze data from satellite providers and automatically alert customers when they exceed certain usage levels. This will be an important value add for customers, but could also lead to new revenue opportunities, as sales representatives can use that data to talk to customers about upgrading their plans based on real-time usage patterns.
The FURUNO Cluster(s)
- Clusters1
- Nodes1
- Hosting EnvironmentElasticsearch Service on Elastic cloud
- Documents300.000.000+
- Total Data Size~50GB
- Daily Ingest Rate~225/10 minutes
- Indexes~400 with most being small and rolling over weekly
- Search Rate285/10 minutes
- Replicas0
- Time-based IndicesAlmost all
- Node SpecificationsAWS.data.highio.i3 15GB RAM 1 zone