More complex queries, anomaly detection, simplified semantic search and onboarding with Elastic 8.7

 Share on Twitter
Share on Twitter

 Share on LinkedIn
Share on LinkedIn

 Share on Facebook
Share on Facebook

 Share by Email
Share by Email

 Print this page
Print
Elastic Stack 8.7 introduces the ability to apply complex filters in Kibana, noise reduction capabilities for alerting and cases, and new ways to detect anomalies. Simplifying implementation of semantic search on text data, you now can use a one-step API, which accelerates your work in analyzing data, identifying system issues, and bringing improved search experiences to your customers. Additionally, onboarding guides help you get started with popular use cases like building a search-powered application, getting started with SIEM, and Kubernetes monitoring. Finally, you will see significant reduction of latencies in visualizing large data sets as a byproduct of increased storage efficiency for time series.
These new features allow customers to:
- Filter data with multi-clause AND/OR relationships in Kibana
- Implement semantic search of text data in a simple way
- Reduce alert noise and third-party notifications in order to improve the time to response
- Detect anomalies that represent step changes in metrics, as well as in geo data
- Easily get started in Kibana based on your use case
What else is new in Elastic 8.7? Check out the 8.7 release blog on Elasticsearch to learn more about improvements in ingest pipelines and dramatic reduction in metrics storage requirements.
The following provides more context for the more impactful of these capabilities.
Matured support for semantic search and NLP
Elastic has built up support for vector search and natural language processing (NLP) over a whole year now, and it shows in the maturity of these capabilities. With 8.7, implementing semantic search becomes as easy as passing the text query and embedding model in a query_vector_builder clause to the familiar knn endpoint. And the support for “transformer” NLP models that we initially released with 8.0 is now generally available.
Semantic search with streamlined text embeddings
For vector search specifically, we are getting the text embedding inference step out of your way. Just determine the trained model that you want to use with your vector search or hybrid query, and the text embedding step happens transparently under the hood.
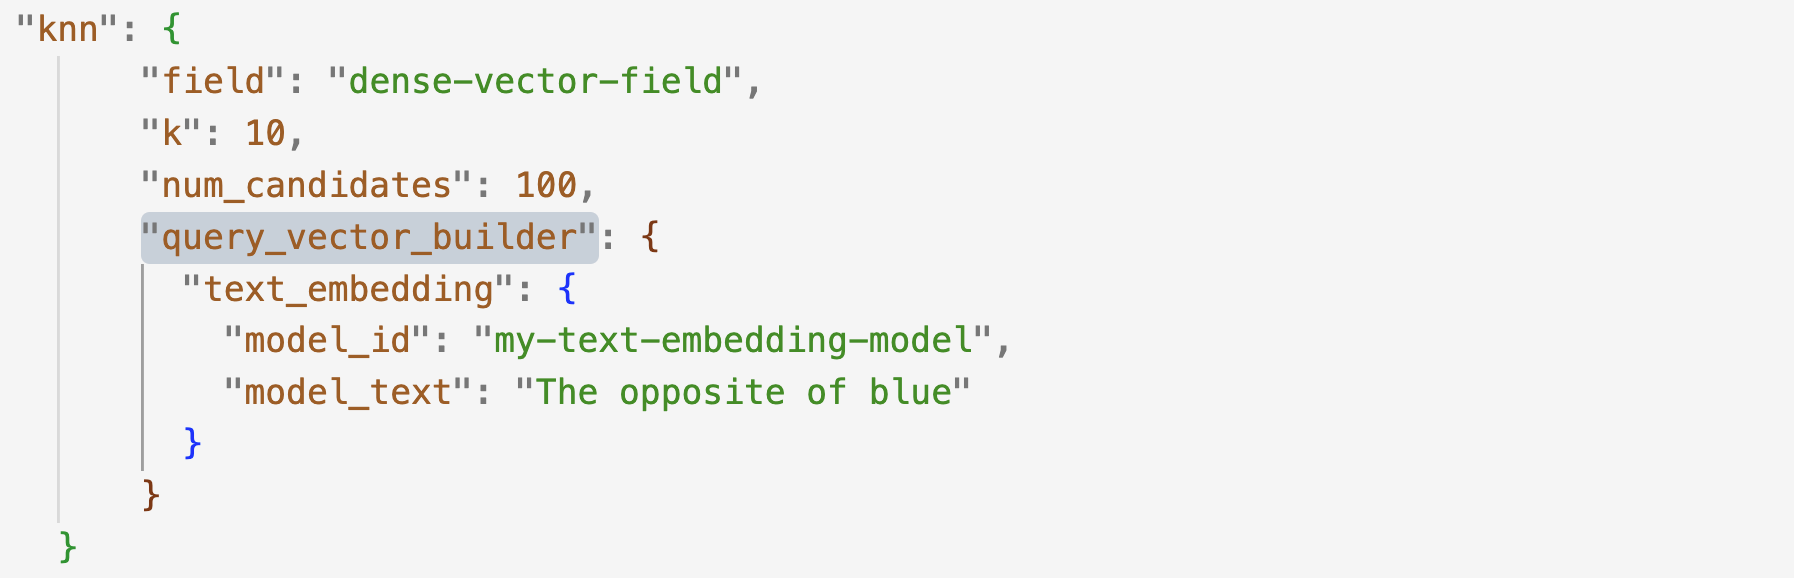
Note that while the text embedding inference through the ingest processor or the direct _infer call is now GA, the text embedding query vector builder remains in technical preview.
Elastic NLP is GA
In 8.7, the NLP capabilities of the Elastic product become GA. You can deploy and manage your trained NLP models in order to perform an array of tasks, such as text classification (including zero-shot), question answering, named entity recognition, and more. The machine learning product supports some of the most powerful state-of-the-art transformer architectures, allowing you to run your most performant models with your workflows and data in Elastic, at the scale and speed that Elastic offers.
The Trained Models UI and the corresponding machine learning APIs streamline the deployment and management of your NLP models in one place within the Elastic product. In addition, you can easily test your models by using indices or simply entering your test text in the UI. The Eland client provides the Python tooling that serializes and optimizes your trained models for deployment within Elastic.
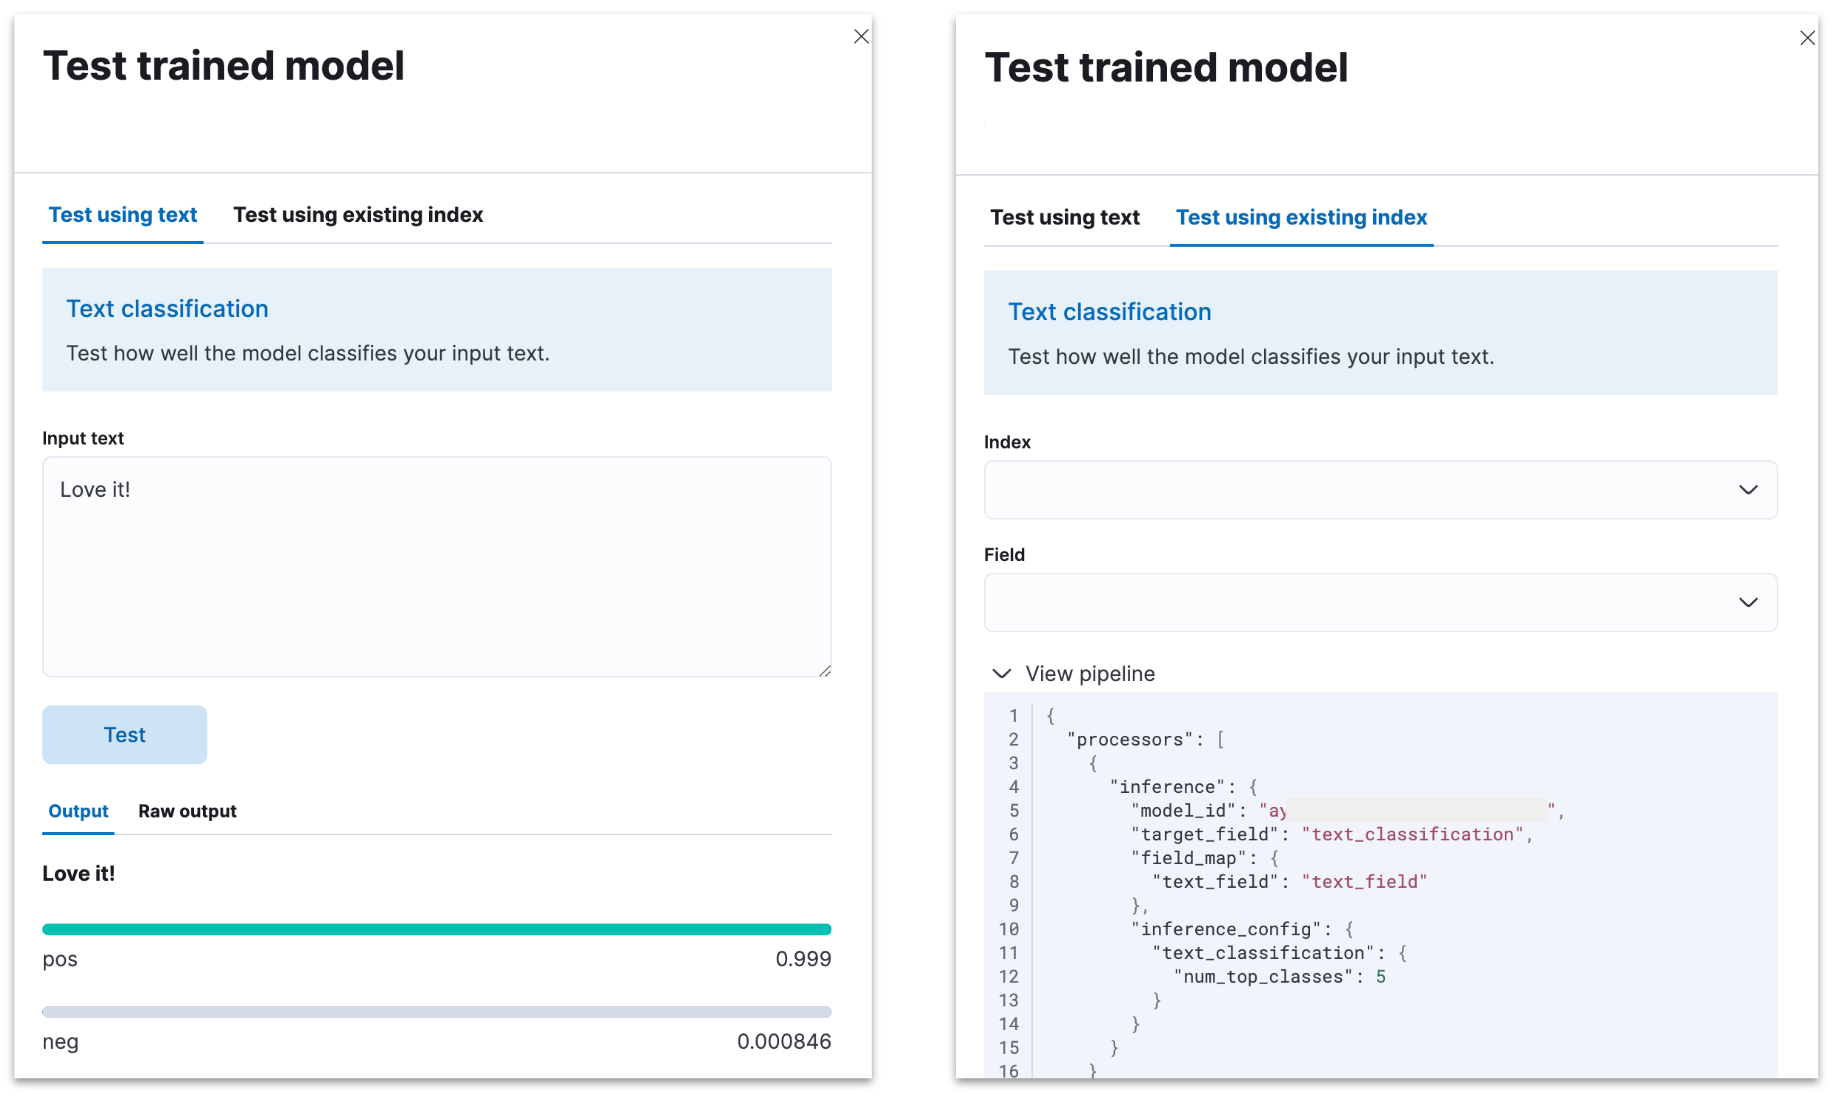
Of course, inference goes well beyond the UI — you can use your NLP model in ingest pipelines. To do so, just add an inference processor that leverages your trained model of choice for your NLP task.
More flexibility in Kibana
You’ve been able to add filters to charts wherever they appear in Kibana — as standalone visualization or integrated in dashboards. With Elastic 8.7, you can build up filters with complex relationships with multiple AND / OR clauses — previously, they were limited to just one AND clause. And the Unified Histogram in Discover now allows the user to “Break Down By” on the histogram, making it easy for the user to explore the data further in Lens.
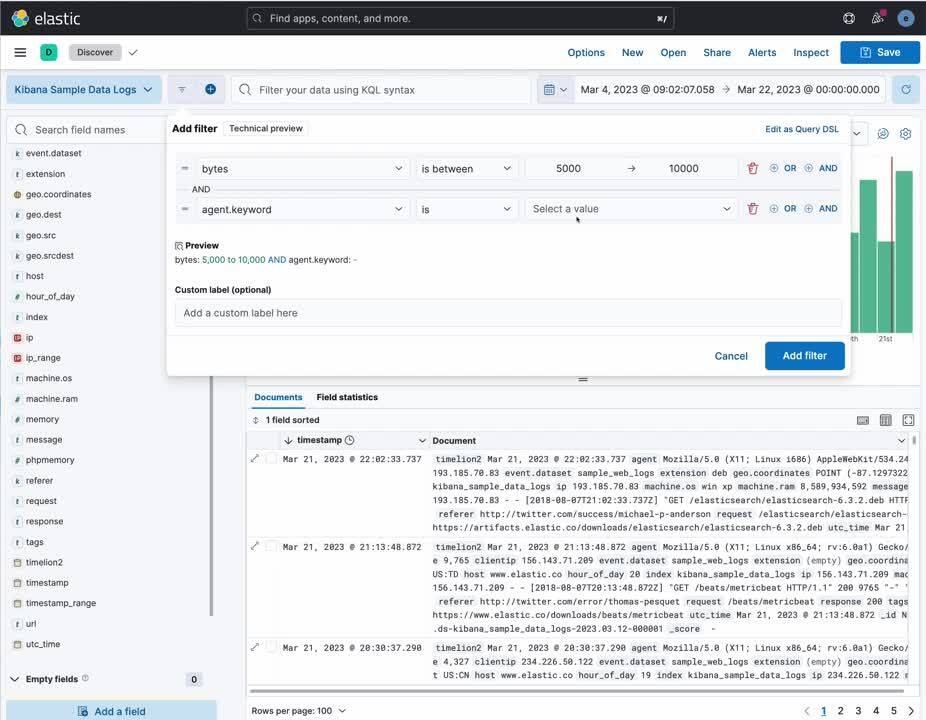
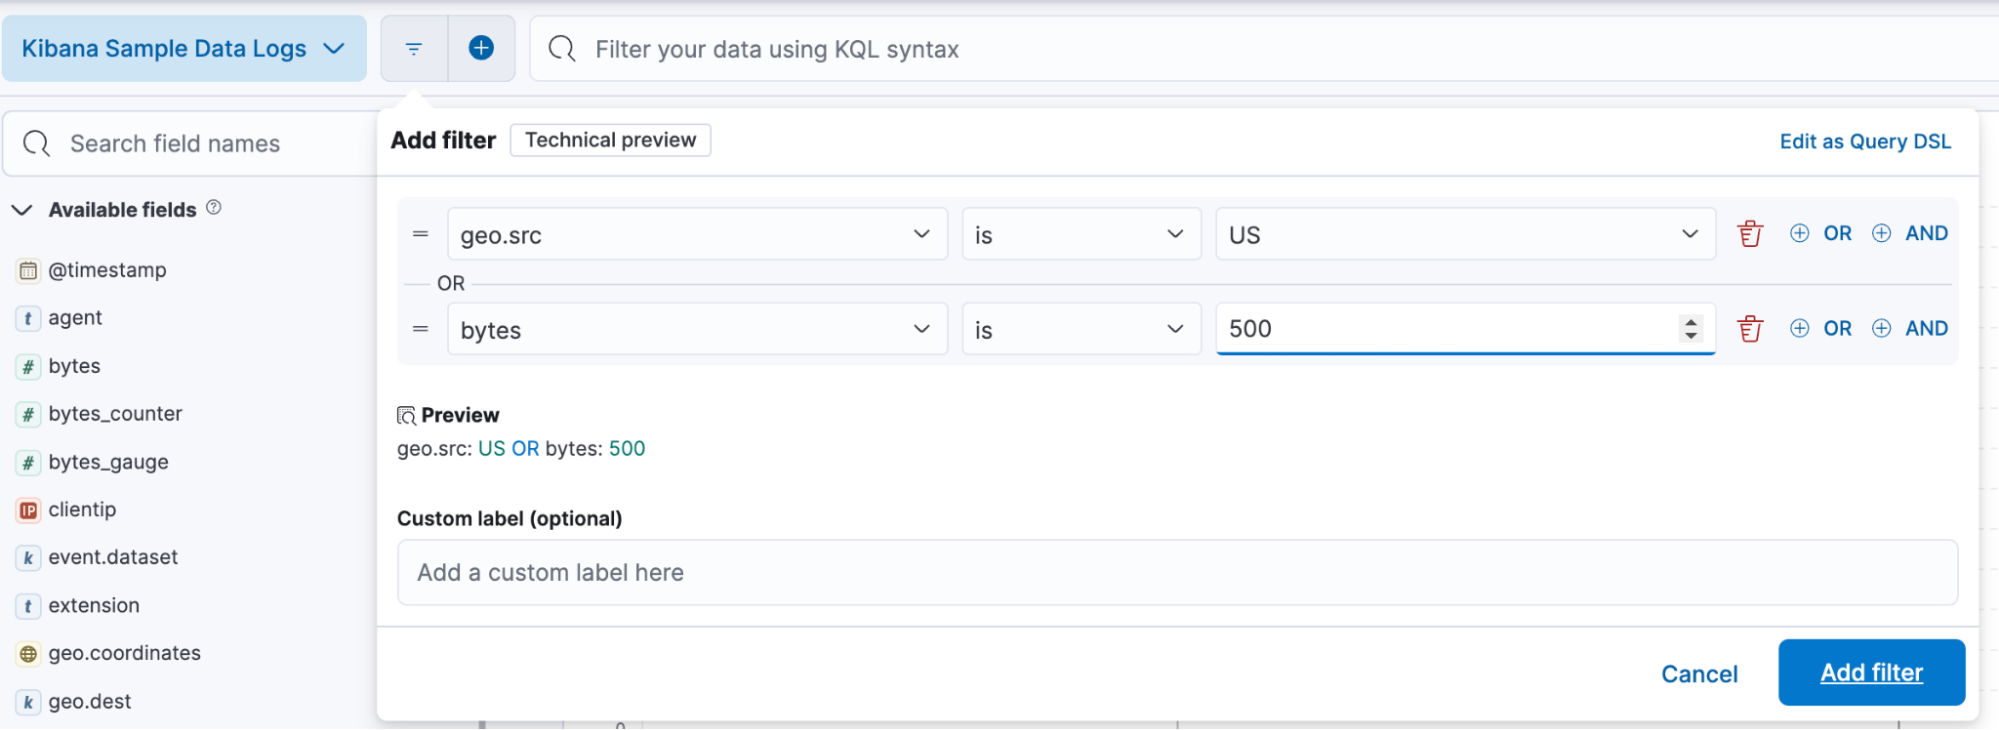
The support of the creation of complex filter relationships (ANDs / ORs)
The enhanced filter builder (currently in tech preview) allows users to create more than one filter simultaneously by adding the capability to nest queries and use the logical OR operator in filter pills through an easy-to-use drag-and-drop experience for changing the relationships faster.
Currently, users are able to create one filter at a time, and all the filters applied are related to “AND” (e.g., filter1: A AND filter2: B). This makes it hard for the user to set up boolean expressions around complex filters and understand the relationship between filters and the query bar.
With the support of complex filter relationships (ANDs / ORs), we are enhancing our query builder to give users the ability to create N-depth complexity filters related to AND/ORs and make it easy to understand the relationship between filters and the query bar.
Break the histogram down in Discover by value
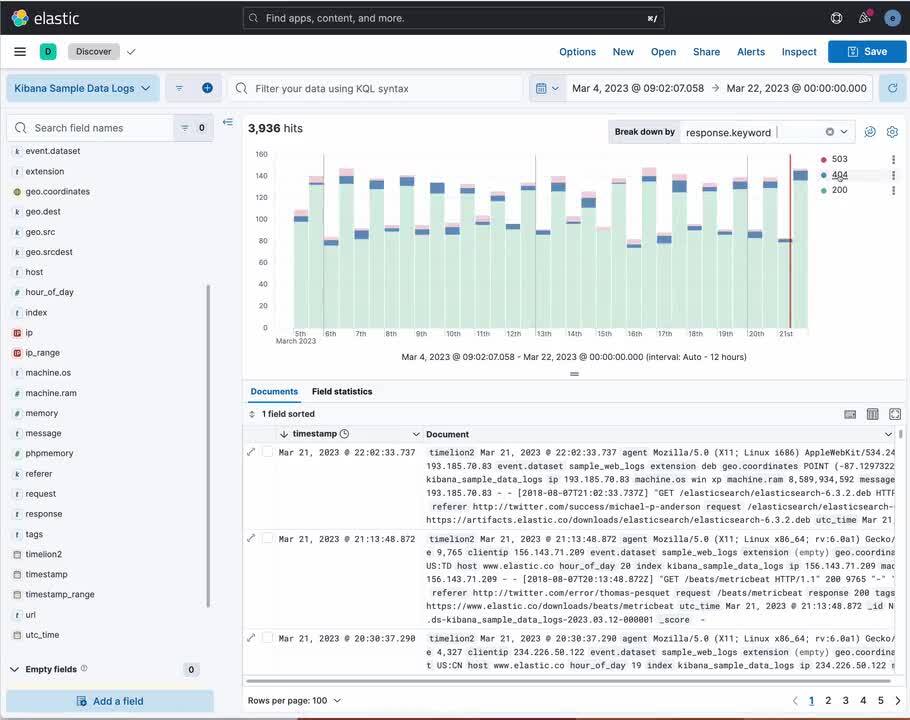
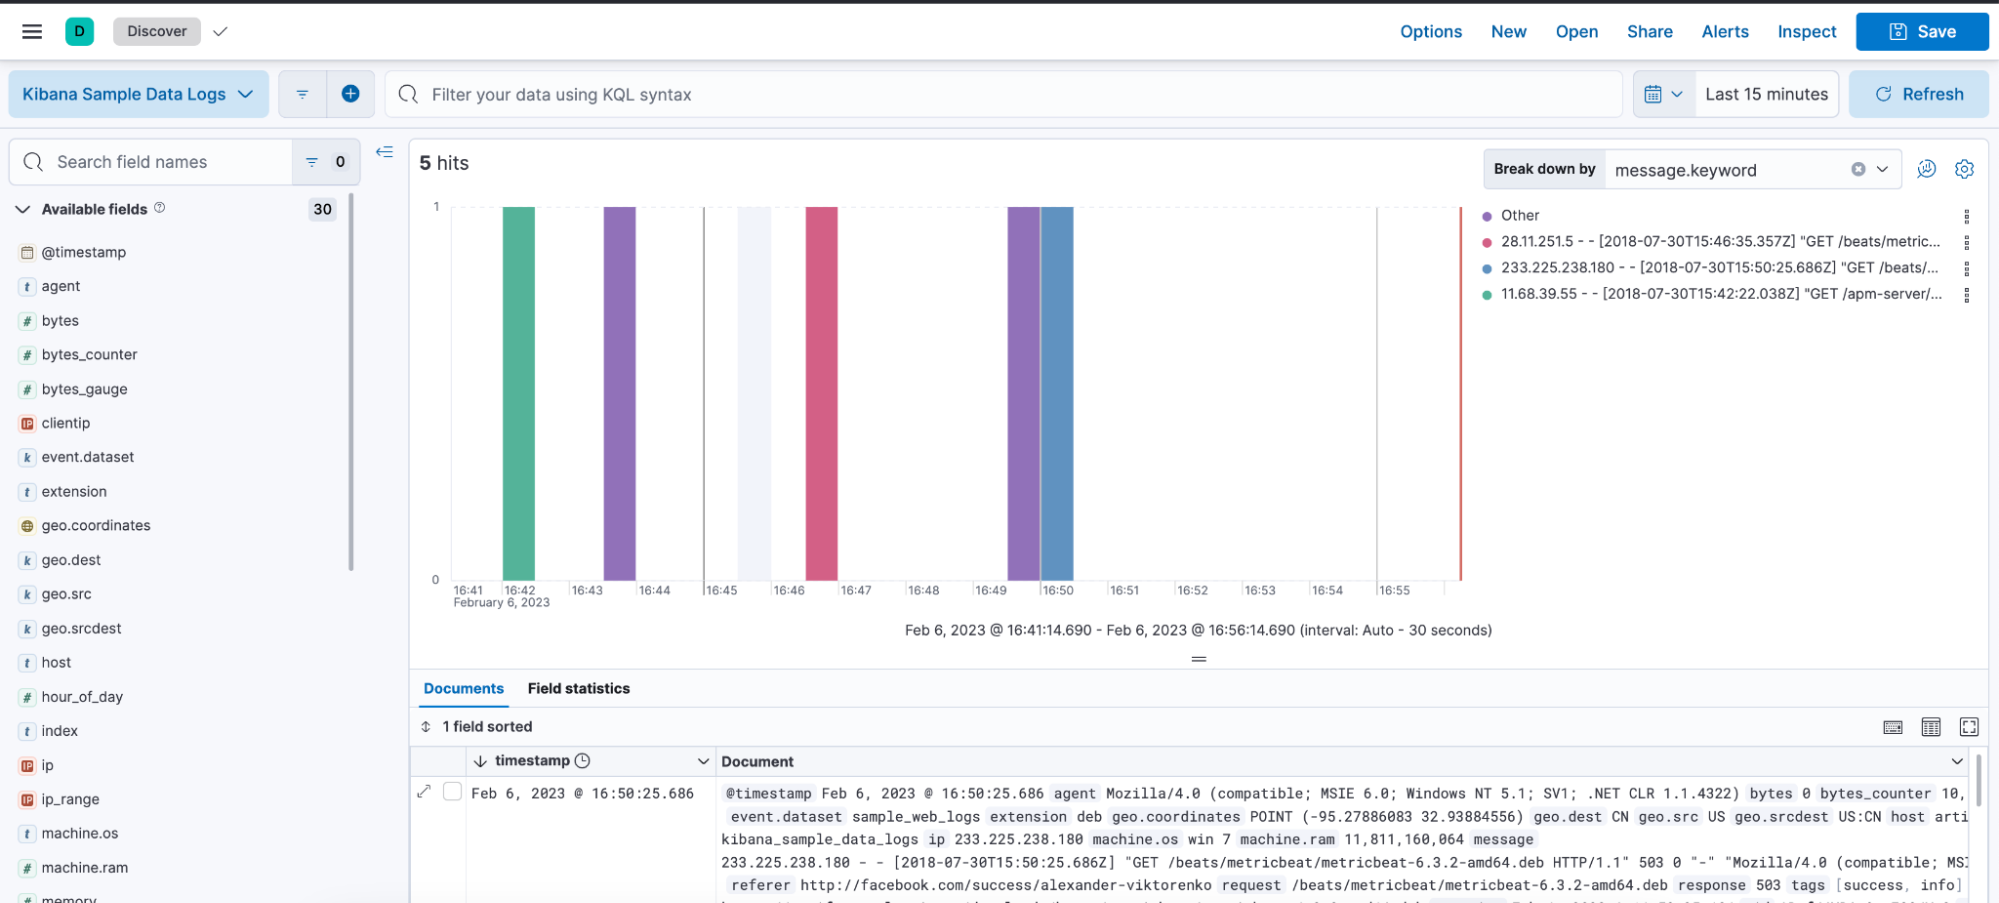
The Unified Histogram in Discover has got an uplift in this release by becoming a Lens component, which makes it easy for the user to explore the data further in Lens, resize capabilities, and apply “Break Down By” on the histogram.
The “Break Down By” feature enables the user to quickly explore and analyze the data. For example, a user can break down by "message" when doing logs exploration to understand the logs quicker, break down by "host" when monitoring hosts, and break down by "event type" when exploring security events.
Don’t let noise throw off your automated alerting
Anomaly detection is typically integrated in observability and security workflows with automated alerting. When the same event triggers multiple automated alerts, they can become a hassle. “Alert flapping detection” in Elastic 8.7 takes care of this problem. Further, you won’t get hit with a storm of notifications because you can summarize actions by rule that triggered them or define a time interval within which additional notifications are suppressed.
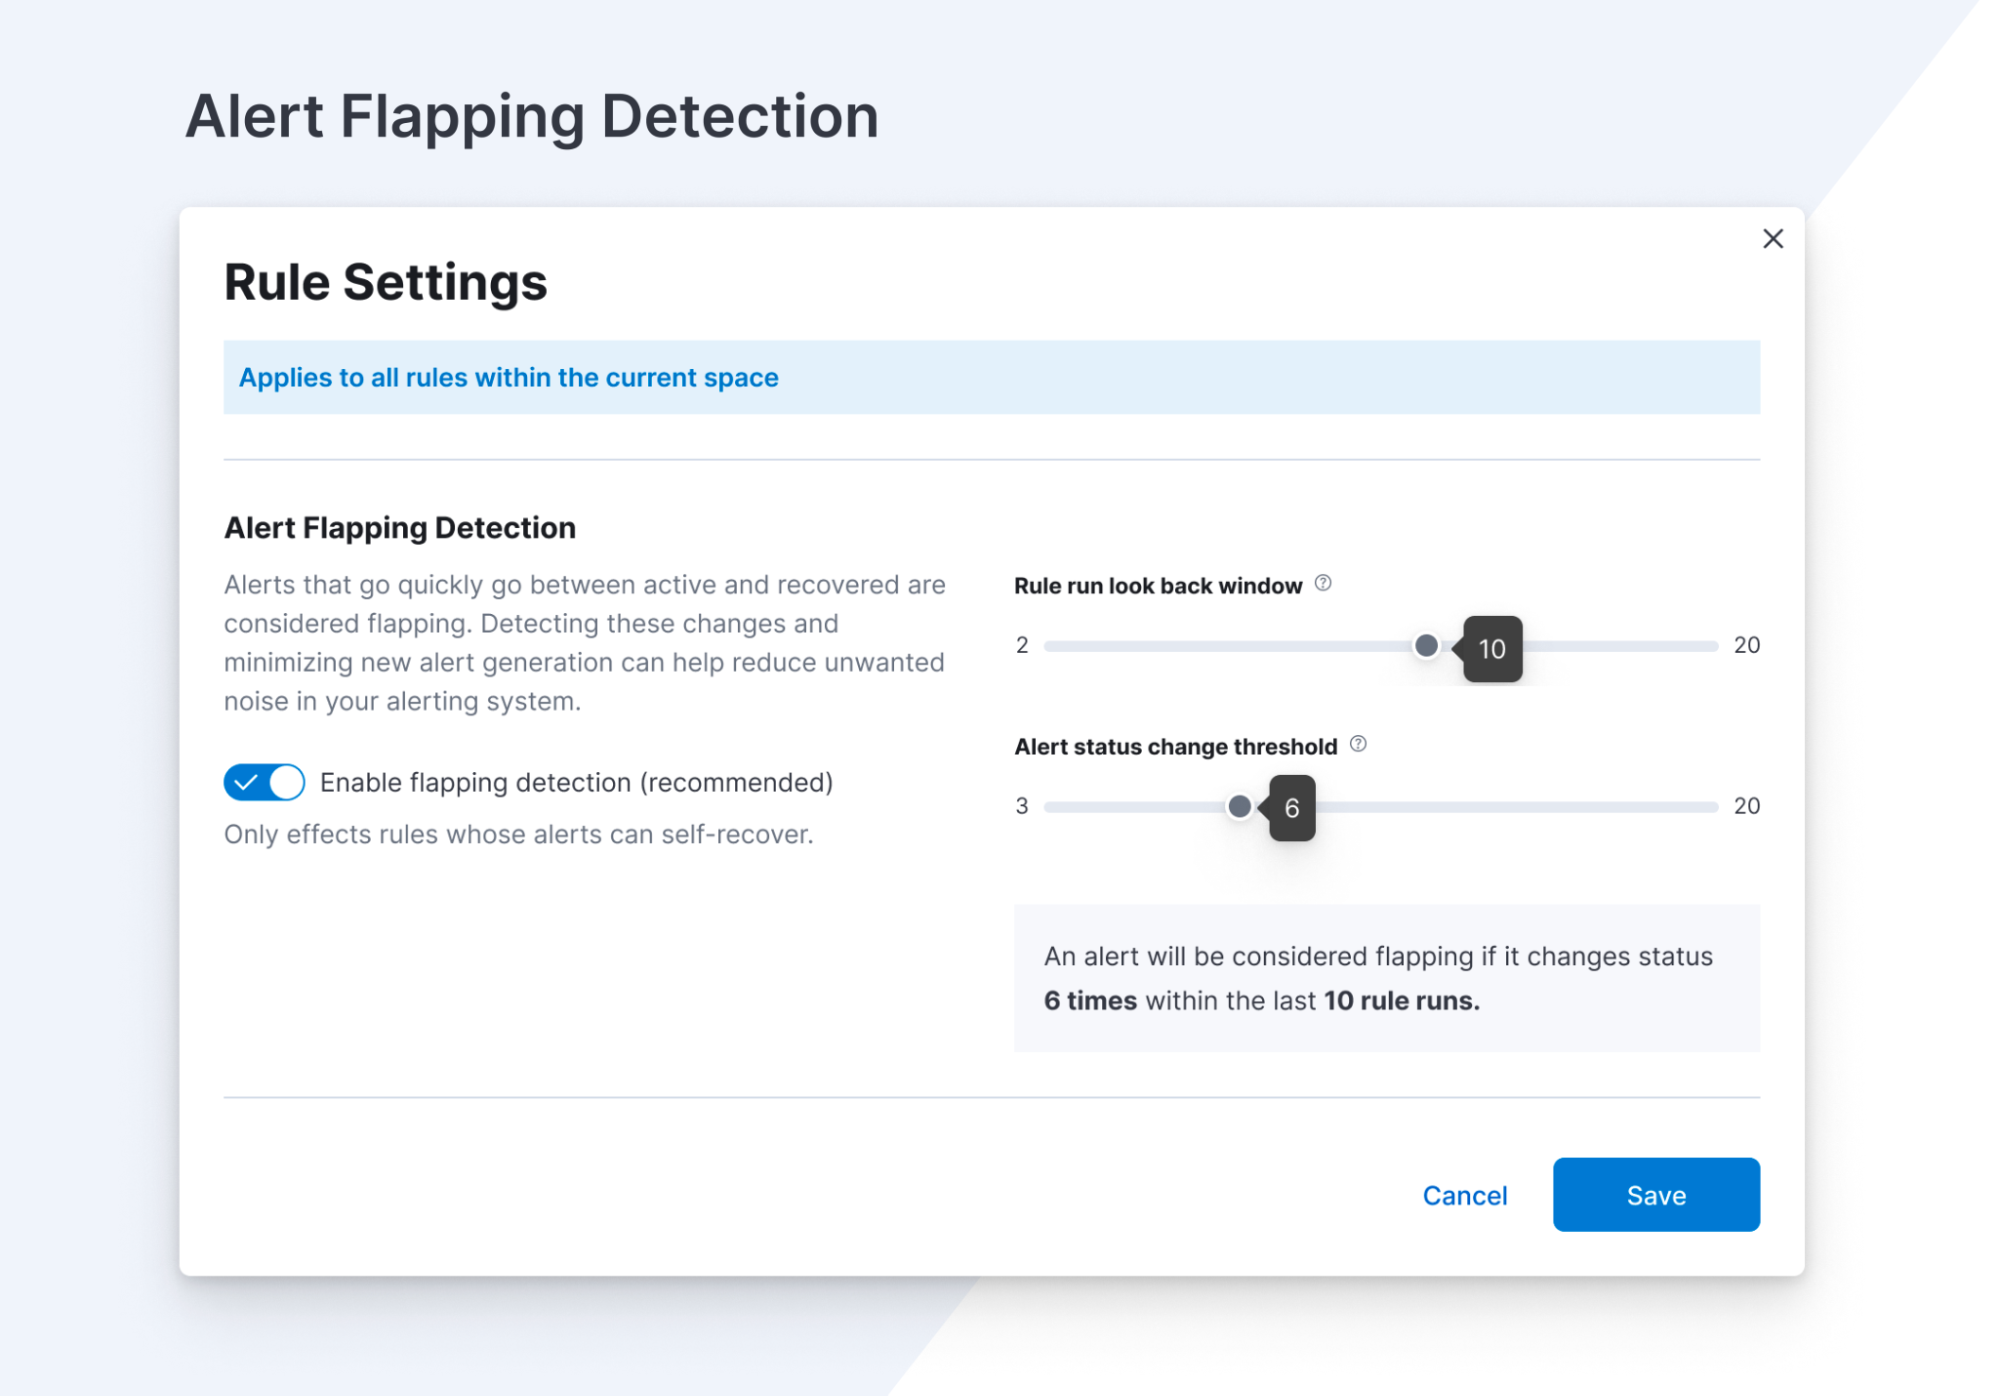
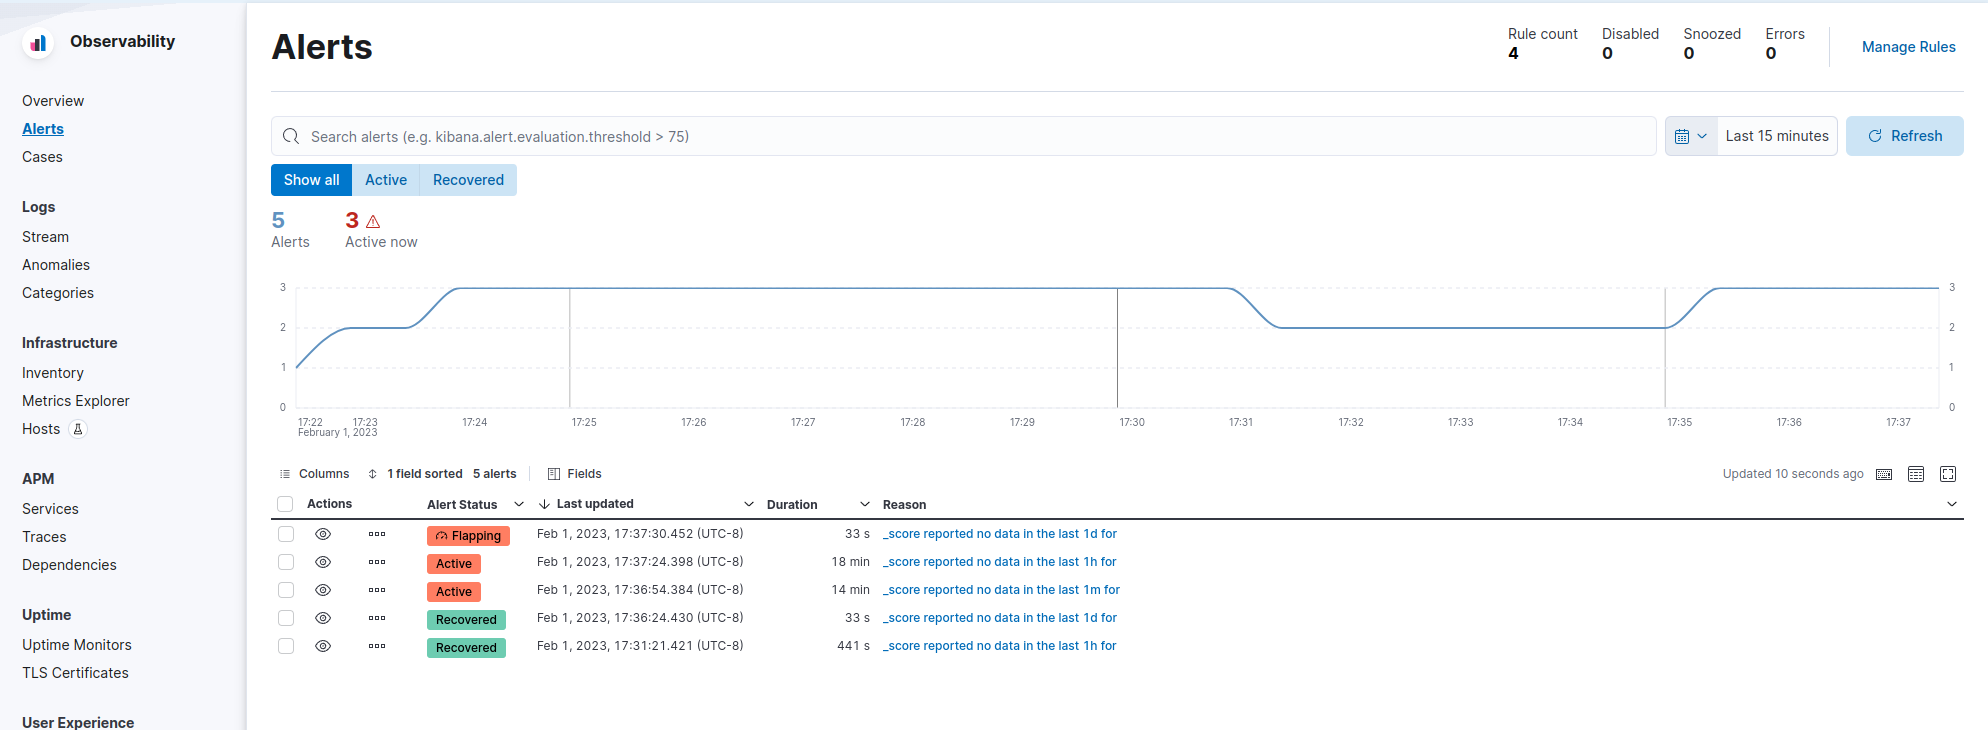
Alert flapping detection
Flapping occurs when a monitored asset (e.g., a service) changes state too frequently (e.g., Active to Recovered three times in an hour). This can result in multiple alerts related to the same fault, making it challenging for the operator to handle the real issues when there is too much noise.
By identifying these situations with prebuilt configuration, highlighting the alerts in the UI, and suppressing related notifications, the mean time to response (MTTR) will be reduced when users won’t spend time on non-actionable alerts investigation.
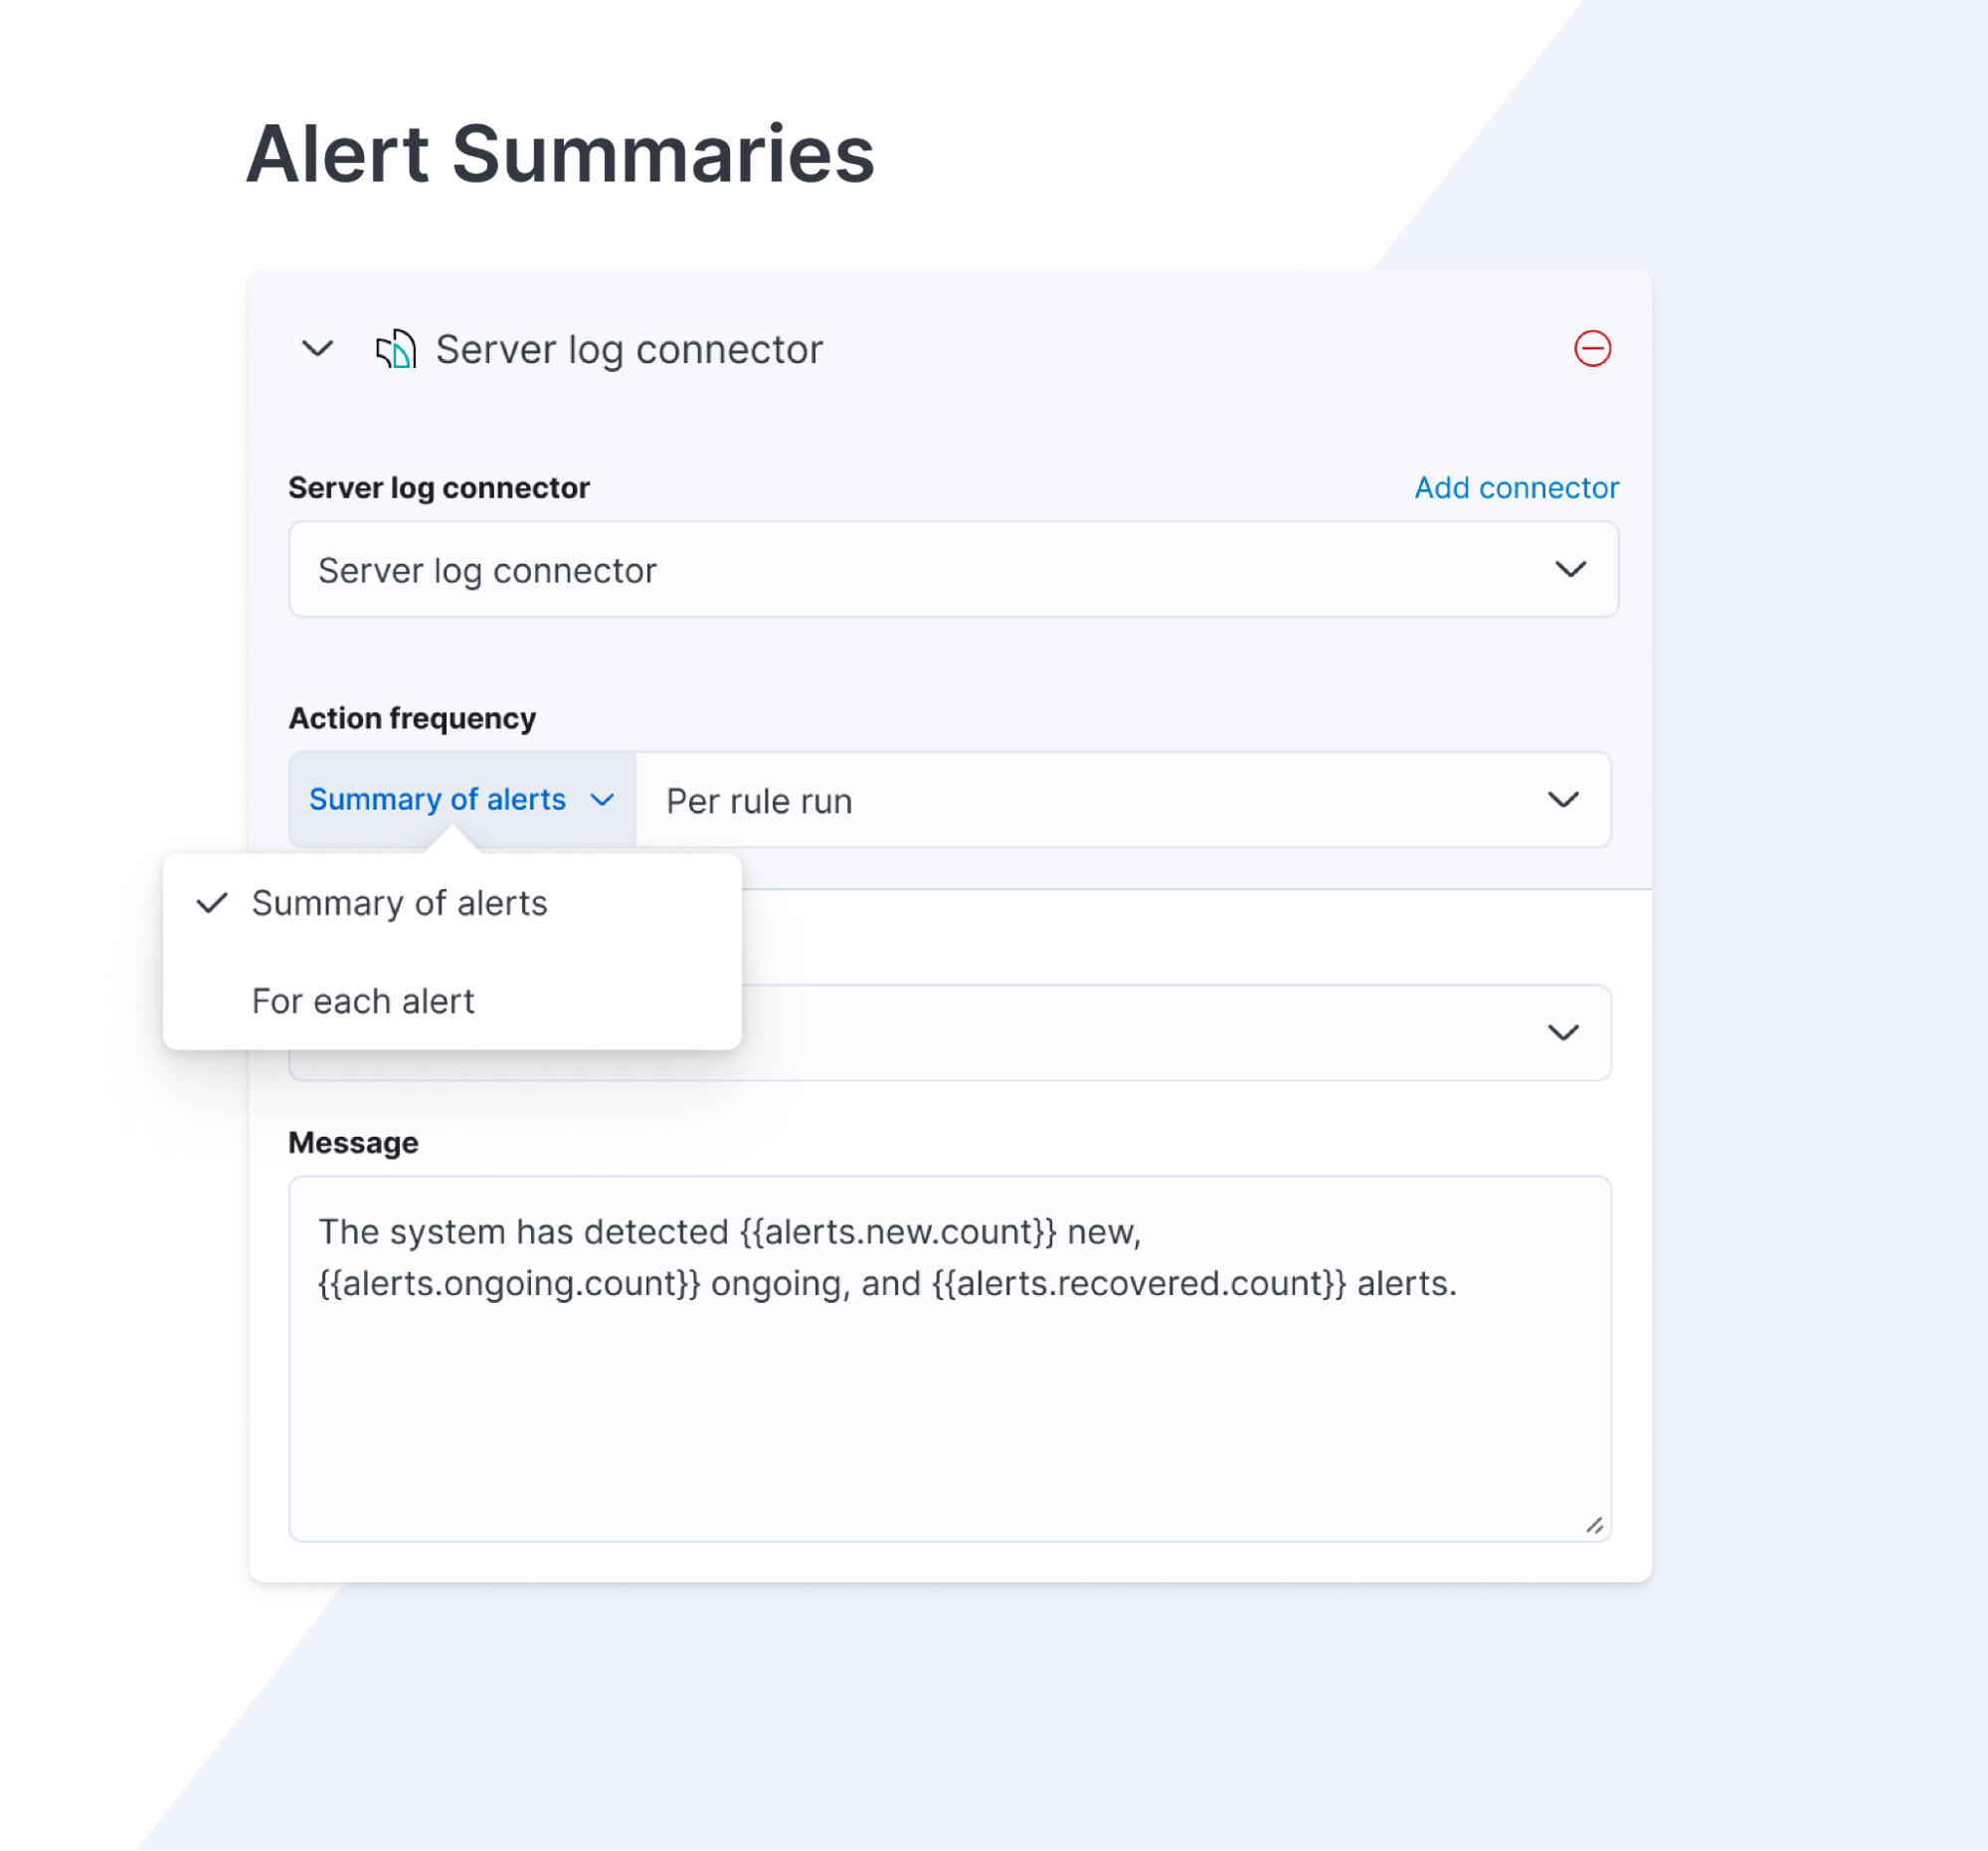
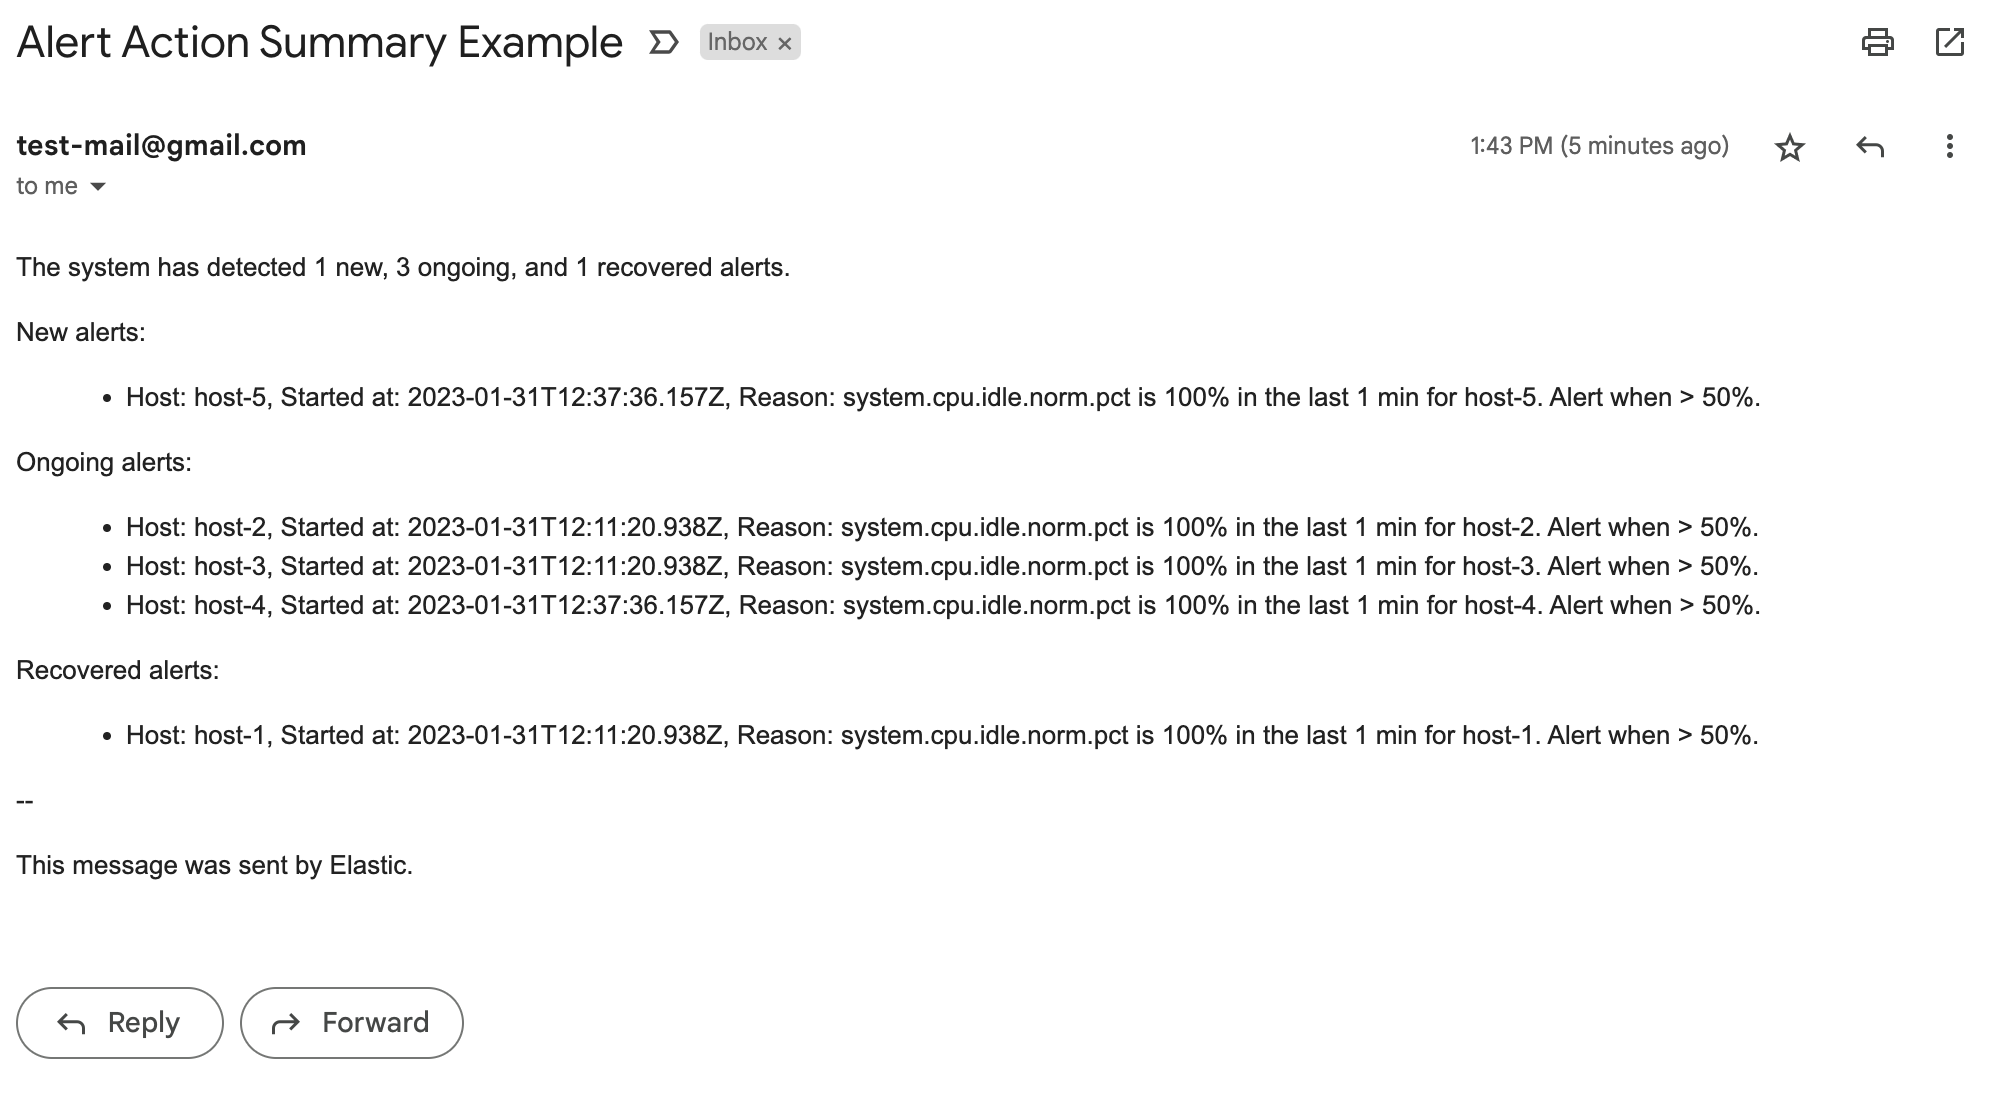
Alert actions summarization
Currently, alert actions are triggered when the rule runs or when the alert status changes. This behavior might lead to a notification storm when an alerting rule detects high cardinality of alerts. These situations increase the time to respond to each event and affect the overall MTTR.
With the new alert actions summarization feature, users will be able to define how to aggregate several actions into a single one with two different options:
- Alert summarization per each rule run (e.g., all the alerts that are detected by the same rule run will be sent in a single notification)
- Alert summarization per custom time interval (e.g., all the alerts that are detected in the last 10 hours will be sent in a single email)
This feature aims to improve the way users consume notifications from third parties and improve the MTTR by reducing unnecessary noise.
Automatically detect even more types of anomalies!
Elastic 8.7 provides even more ways to detect anomalies, so fewer issues fall through the cracks of your automated monitoring. Elastic already supports an array of different anomaly detection algorithms, specialized on metrics, rare events, and populations. Elastic 8.7 adds two more types: change point detection and anomalies in geo data.
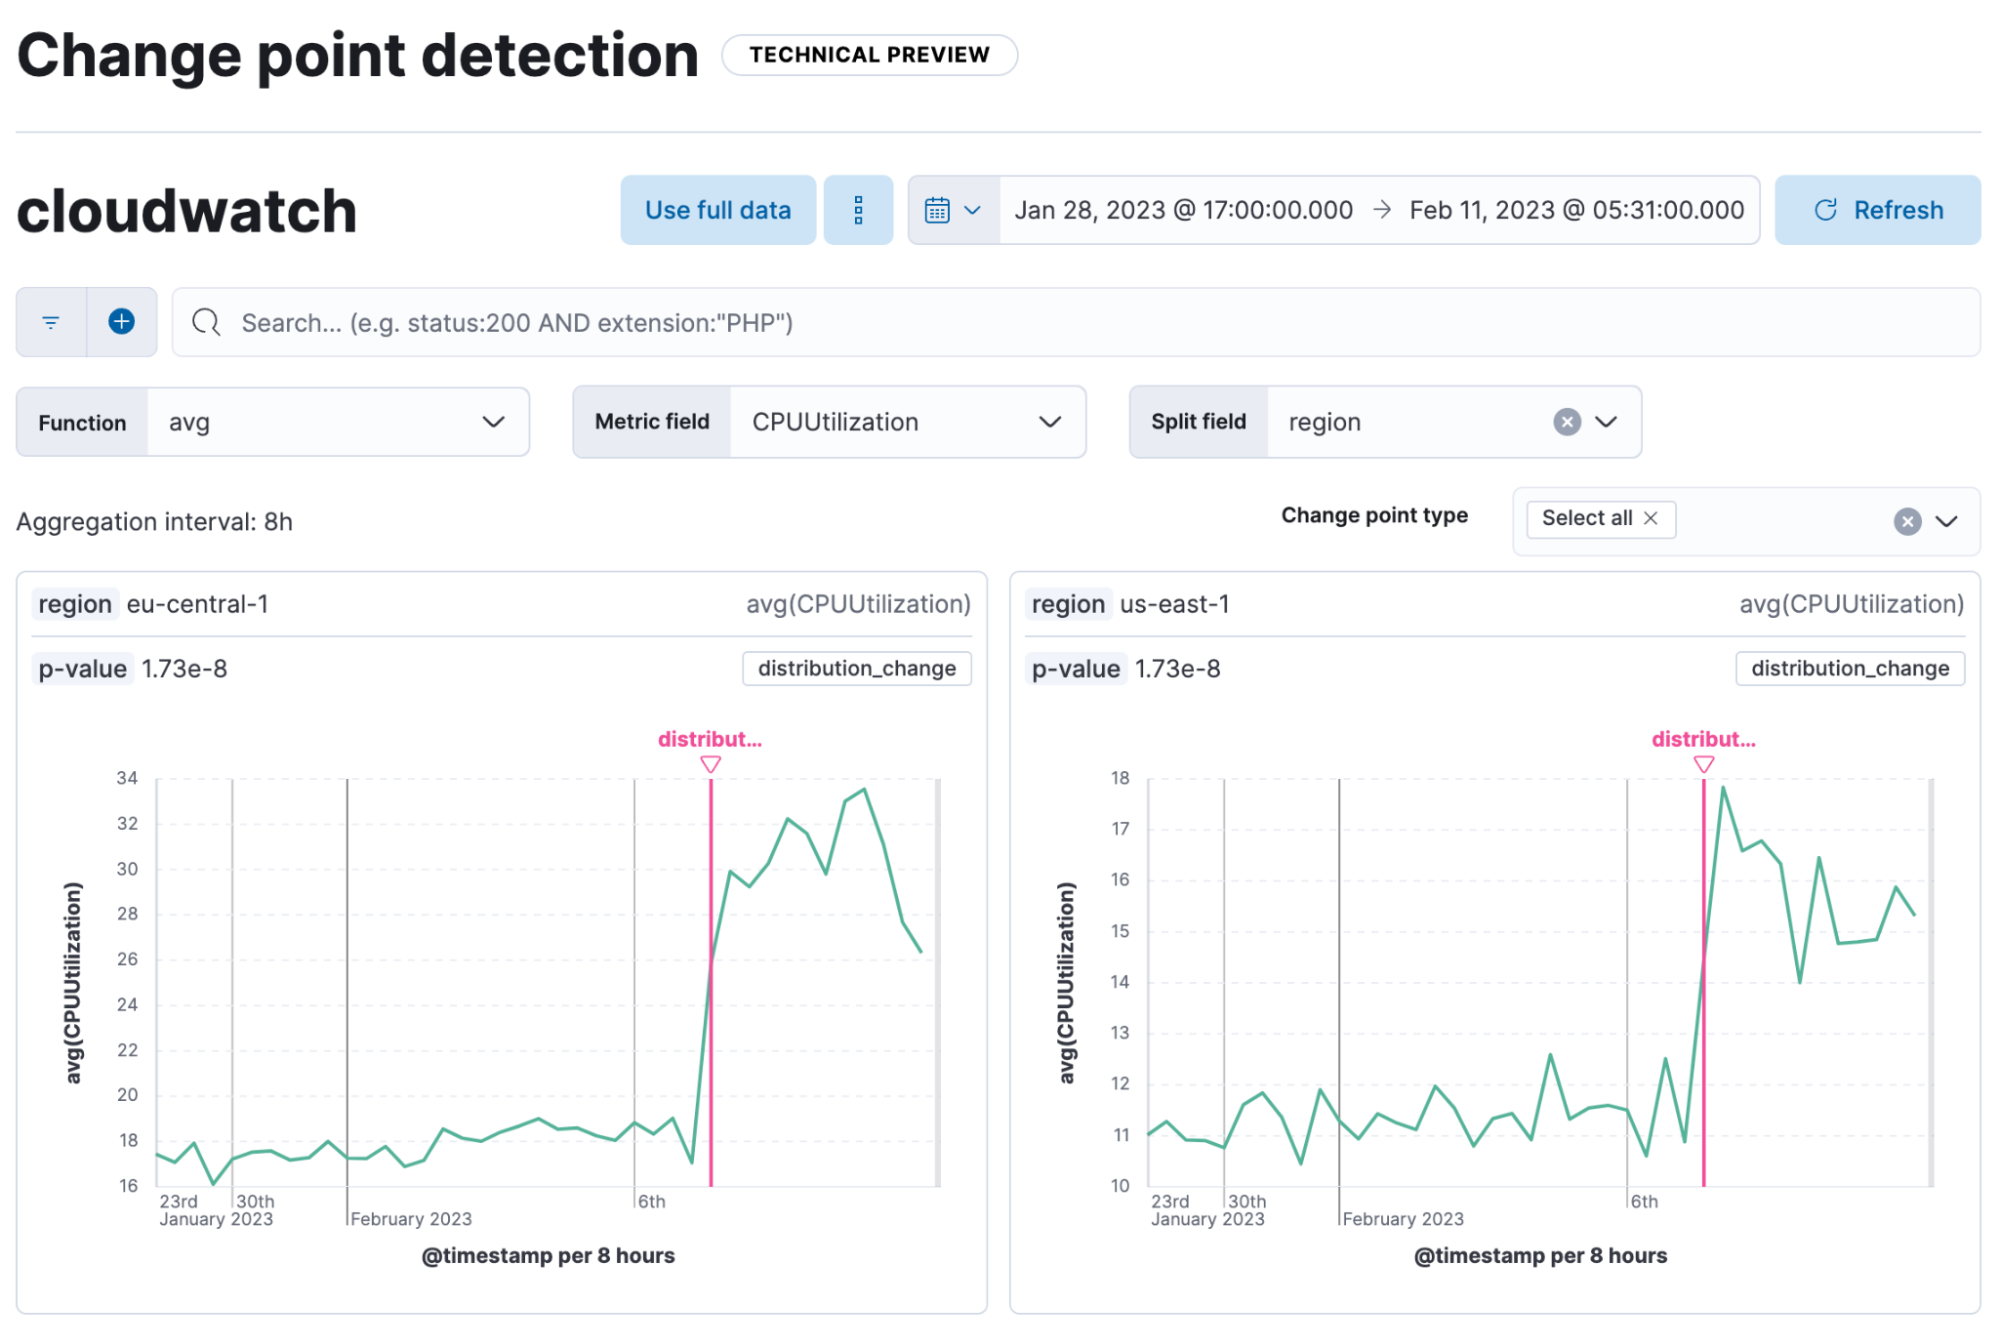
Introducing change point detection
In 8.7, we add change point detection to your AIOps toolset. Change point can give you additional perspective into the metrics you observe. If your metrics of interest presented a change, change point will detect and show you the biggest change in the time window you are looking at.
But what is change? Change point will examine your metrics statistics (such as the average, mean, max, and min) to detect significant changes on how they trend. Changes that are detected include step changes, slope changes, and distribution changes, as well as spikes and dips. This is an important point that distinguishes change point as a complementary tool to anomaly detection: change point doesn’t just look for outliers in a time series. In addition, you do not need to set up a detector or a results index to leverage it. It uses the change point aggregation, and you can use it as part of the exploratory, correlation, and root-cause analyses of your observability and other metrics. In 8.7, this functionality is offered in technical preview.
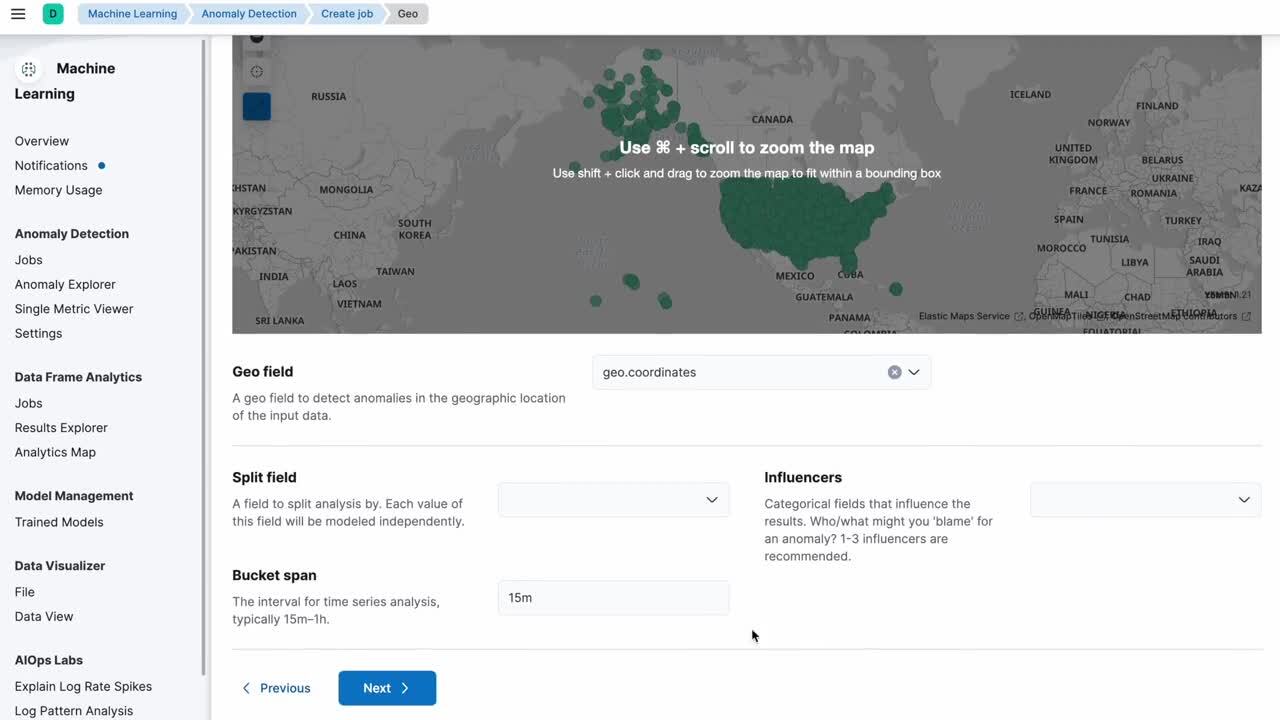
Guided, integrated anomaly detection for geo data
Creating anomaly detection jobs for geo data is now easier than ever with the new geo wizard. The UI will guide you through the job setup, and you will be able to detect and display the anomalies on the map in a few easy steps.
In addition, your machine learning workflows for geo data become all the more complete and integrated. You could add anomaly detection layers in Maps before, and you can now create an anomaly detection job from a Map panel within a dashboard. Choose the anomaly detection option in the panel’s menu and create the job straight within the dashboard’s flyout, or use the entry point to the new wizard.
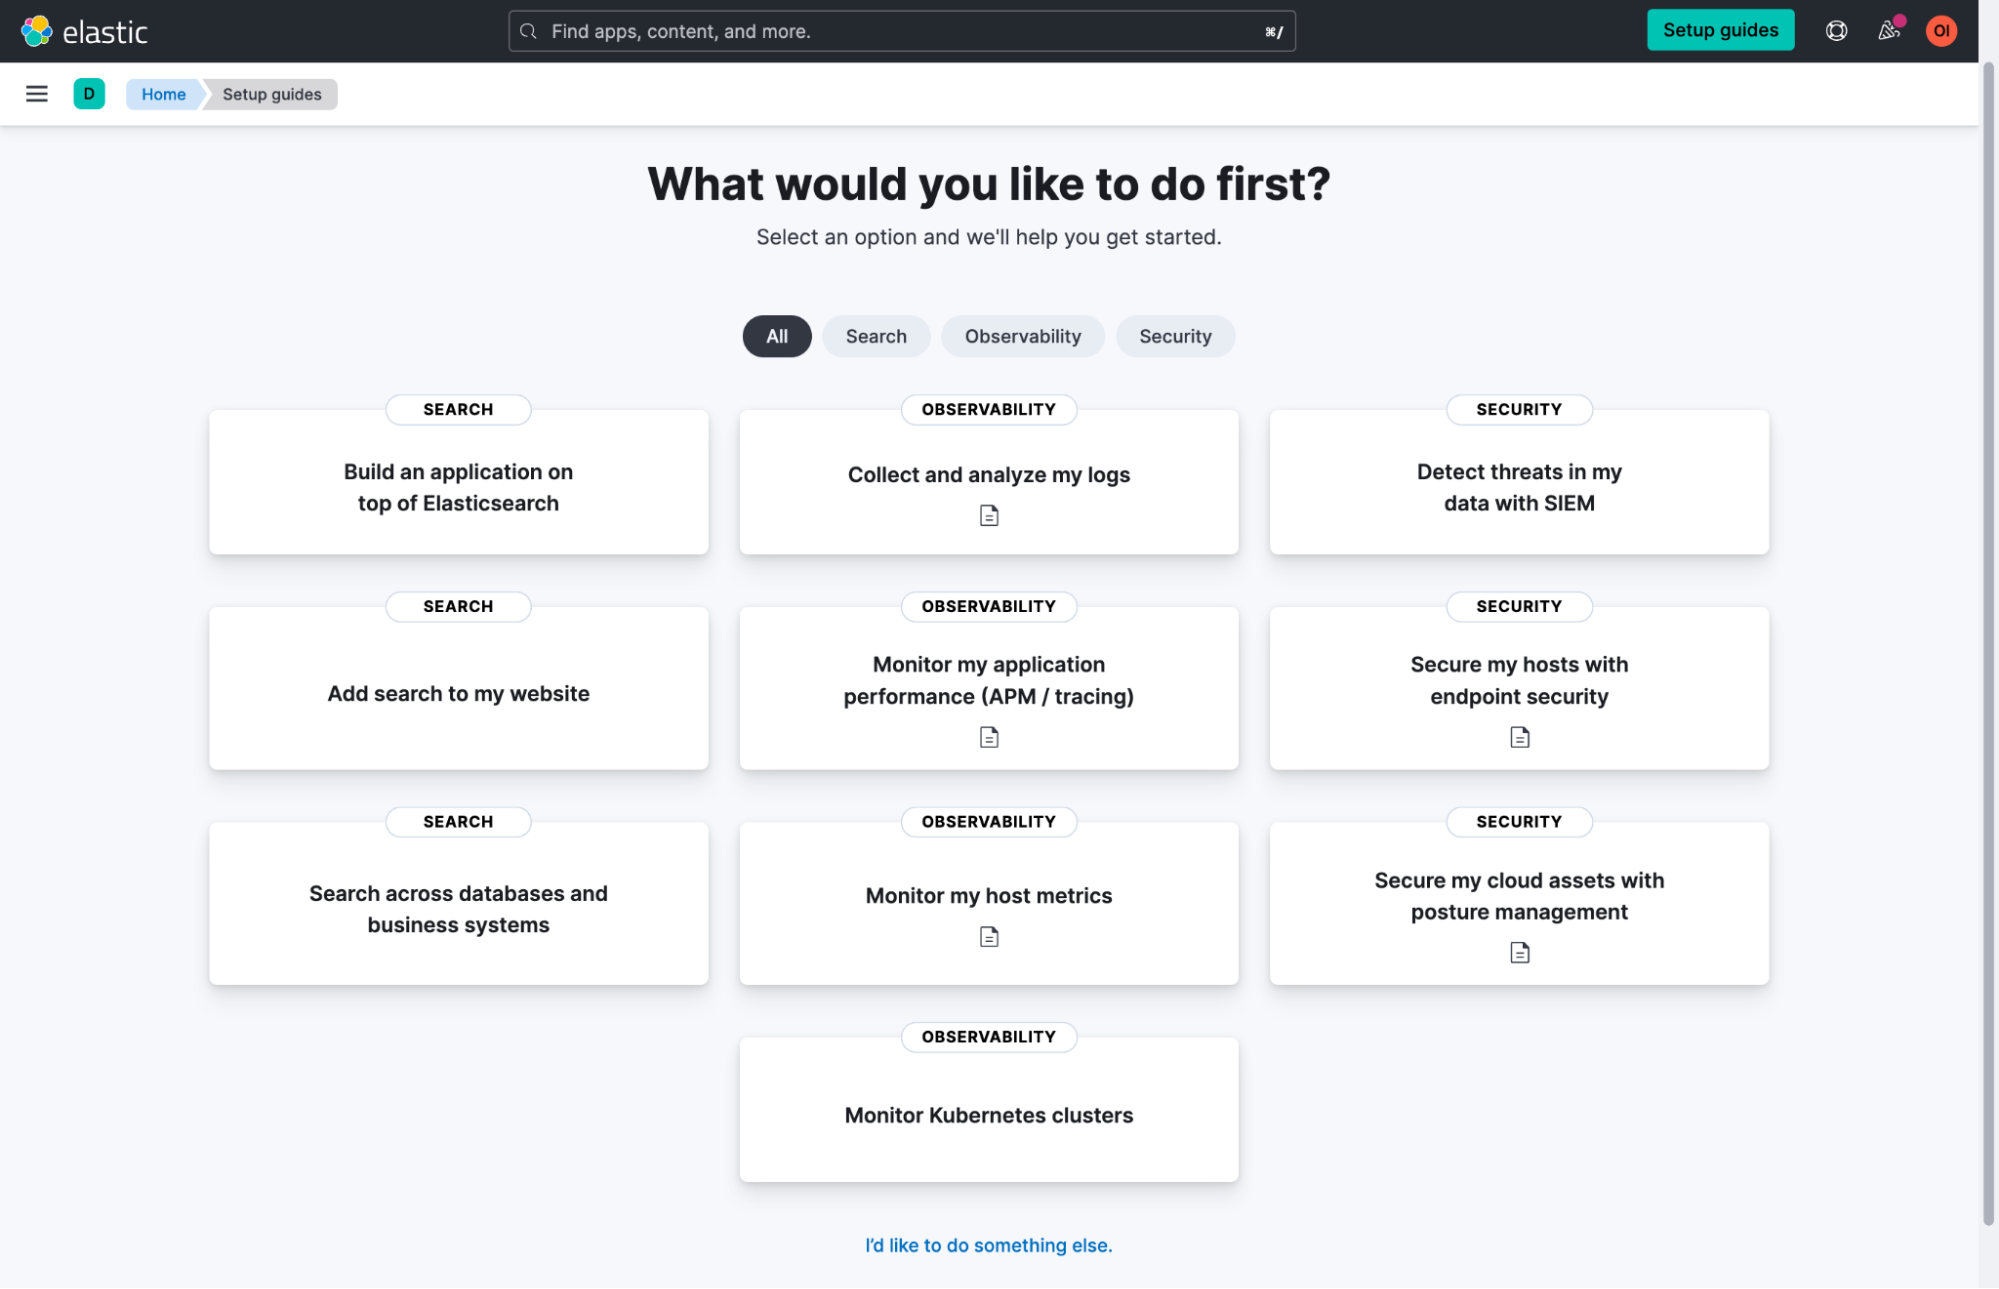
Simplified onboarding
We are making it much easier for users to onboard Elastic Cloud. We're introducing Setup Guides to help you easily get started with popular use cases like building a search-powered application, getting started with SIEM, Kubernetes monitoring, and more. Each Setup Guide will walk you through how to index your data and introduce you to powerful capabilities within Elastic to get you going.
Wait . . . there’s more!
Elastic 8.7 includes many other enhancements, including easier configuration and management of machine learning jobs with visibility into memory occupied by models, as well as the ability to view statistics of selected fields from within the various machine learning model wizards, sparing you from switching between wizards and Kibana. Find out more at What’s New in 8.7 Kibana and What’s New in 8.7 Elasticsearch.
Try it out!
Read about these capabilities and more in the release notes.
Existing Elastic Cloud customers can access many of these features directly from the Elastic Cloud console. Not taking advantage of Elastic on cloud? Start a free trial.
The release and timing of any features or functionality described in this post remain at Elastic's sole discretion. Any features or functionality not currently available may not be delivered on time or at all.
Share
- Share on Twitter
Share on Twitter
- Share on LinkedIn
Share on LinkedIn
- Share on Facebook
Share on Facebook
- Share by Email
Share by Email
- Print this page
Print