Elastic Observability 8.2: Tail-based sampling, plus more serverless visibility for AWS


 Share on Twitter
Share on Twitter

 Share on LinkedIn
Share on LinkedIn

 Share on Facebook
Share on Facebook

 Share by Email
Share by Email

 Print this page
Print
As more organizations adopt cloud-native technologies and microservices-based architectures, application troubleshooting is becoming increasingly complex. With so many moving parts in an environment that is both dynamic and distributed, it is difficult to get the full picture. Yet complete visibility is crucial in order to find and fix issues quickly — especially ones that impact the bottom line.
With Elastic Observability 8.2, DevOps and SRE teams can now more effectively support modern cloud-native environments with the ability to fine-tune distributed tracing with smarter “tail-based” sampling, capture application traces from AWS Lambda, and further simplify ingest of AWS logs with serverless support for additional cloud services.
These new features allow customers to:
- Eliminate blind spots by efficiently collecting and storing the most relevant data
- Accelerate cloud-native troubleshooting with more complete visibility
- Further simplify ingest of observability data for faster time-to-insight
Elastic Observability 8.2 is available now on Elastic Cloud — the only hosted Elasticsearch offering to include all of the new features in this latest release. You can also download the Elastic Stack and our cloud orchestration products, Elastic Cloud Enterprise, and Elastic Cloud for Kubernetes, for a self-managed experience.
Eliminate blind spots with smarter sampling of transactions
As application environments continue to become more complex, many application performance monitoring (APM) customers have faced a trade off between crucial visibility and the performance overhead of collecting complete data from their environment. While sampling and storing every trace would be optimal from an operational standpoint, the overhead and financial cost of doing so would be prohibitive.
Many smart sampling methodologies have approached this issue with varying degrees of success. The commonly employed “head-based” decision to sample or not at the time the trace is initiated applies a fixed rate of sampling (for example, sample every 5th trace) to all transactions. Head-based sampling works well and is efficient in lower volume systems due to its simplicity. But this methodology has its weaknesses. The head-based approach can miss critical transactions because it doesn’t take into account questions such as: Did this transaction complete or not? How long did it take to execute?
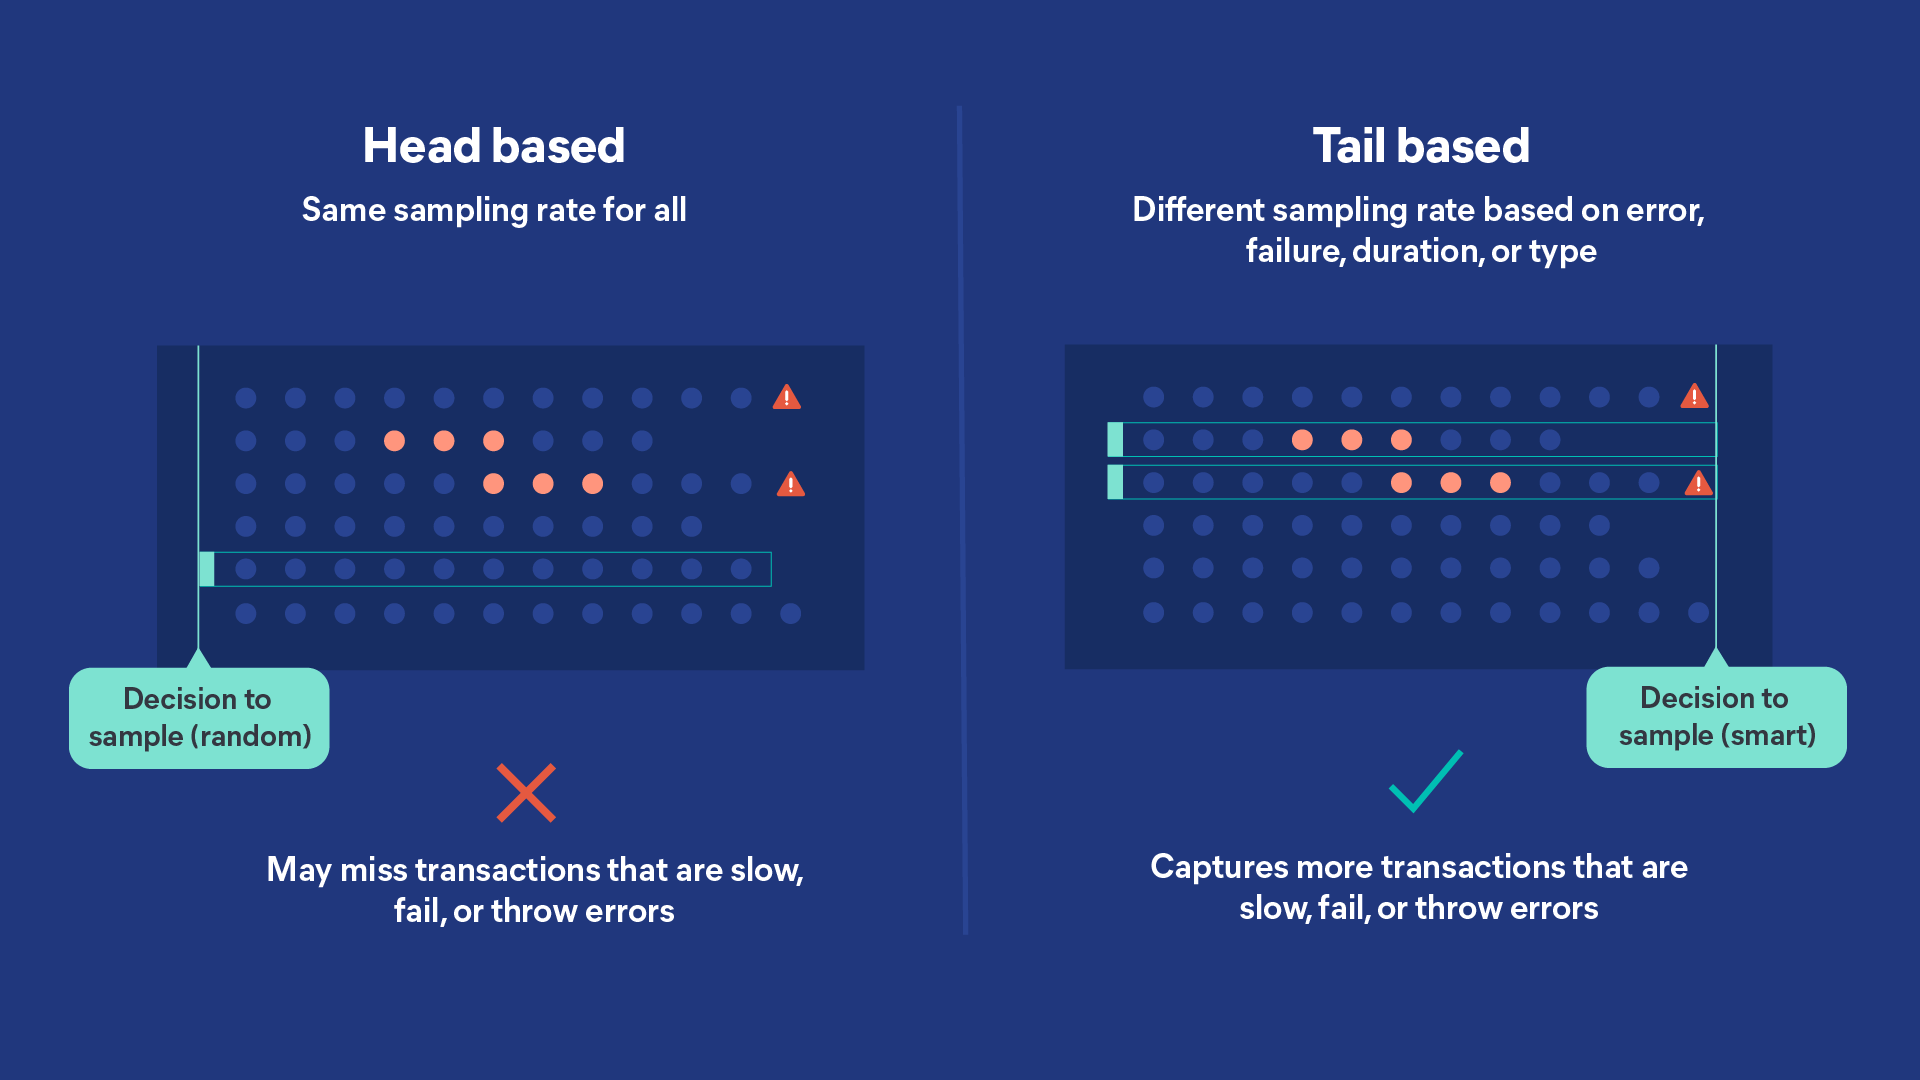
In high-volume systems with millions of transactions and spans, the weaknesses of head-based sampling become apparent, quickly. Elastic’s new tail-based sampling methodology supplements the head-based approach by giving customers finer grained control over sampling conditions.
With tail-based sampling, the decision to keep or discard is made after the trace has completed and been observed. As such, sampling rates can be applied in accordance with the duration of each sampled transaction. Slower transactions are preferentially collected more frequently than fast ones as they are considered to be more “interesting.” Each trace is further evaluated against a set of rules or policies, including transaction type, application environment (e.g., prod, test, or staging), and transaction outcome (success or failure). By selectively configuring sampling rates, customers can more efficiently store the most relevant data for their use cases. In today’s complex, high-volume, distributed systems, the ability to pinpoint issues with the granularity provided by tail-based sampling is absolutely necessary.
With the tail-based sampling approach, customers can:
- Maximize visibility while fine tuning the performance overhead of data collection
- Reduce total cost of ownership (TCO) by capturing and storing only the most important transactions
- Eliminate blind spots and sleep peacefully knowing that they will never miss an issue
- Always have all the data they need to detect and troubleshoot problematic transactions
- Trend and report on business goals and objectives
Accelerate troubleshooting for AWS Lambda functions
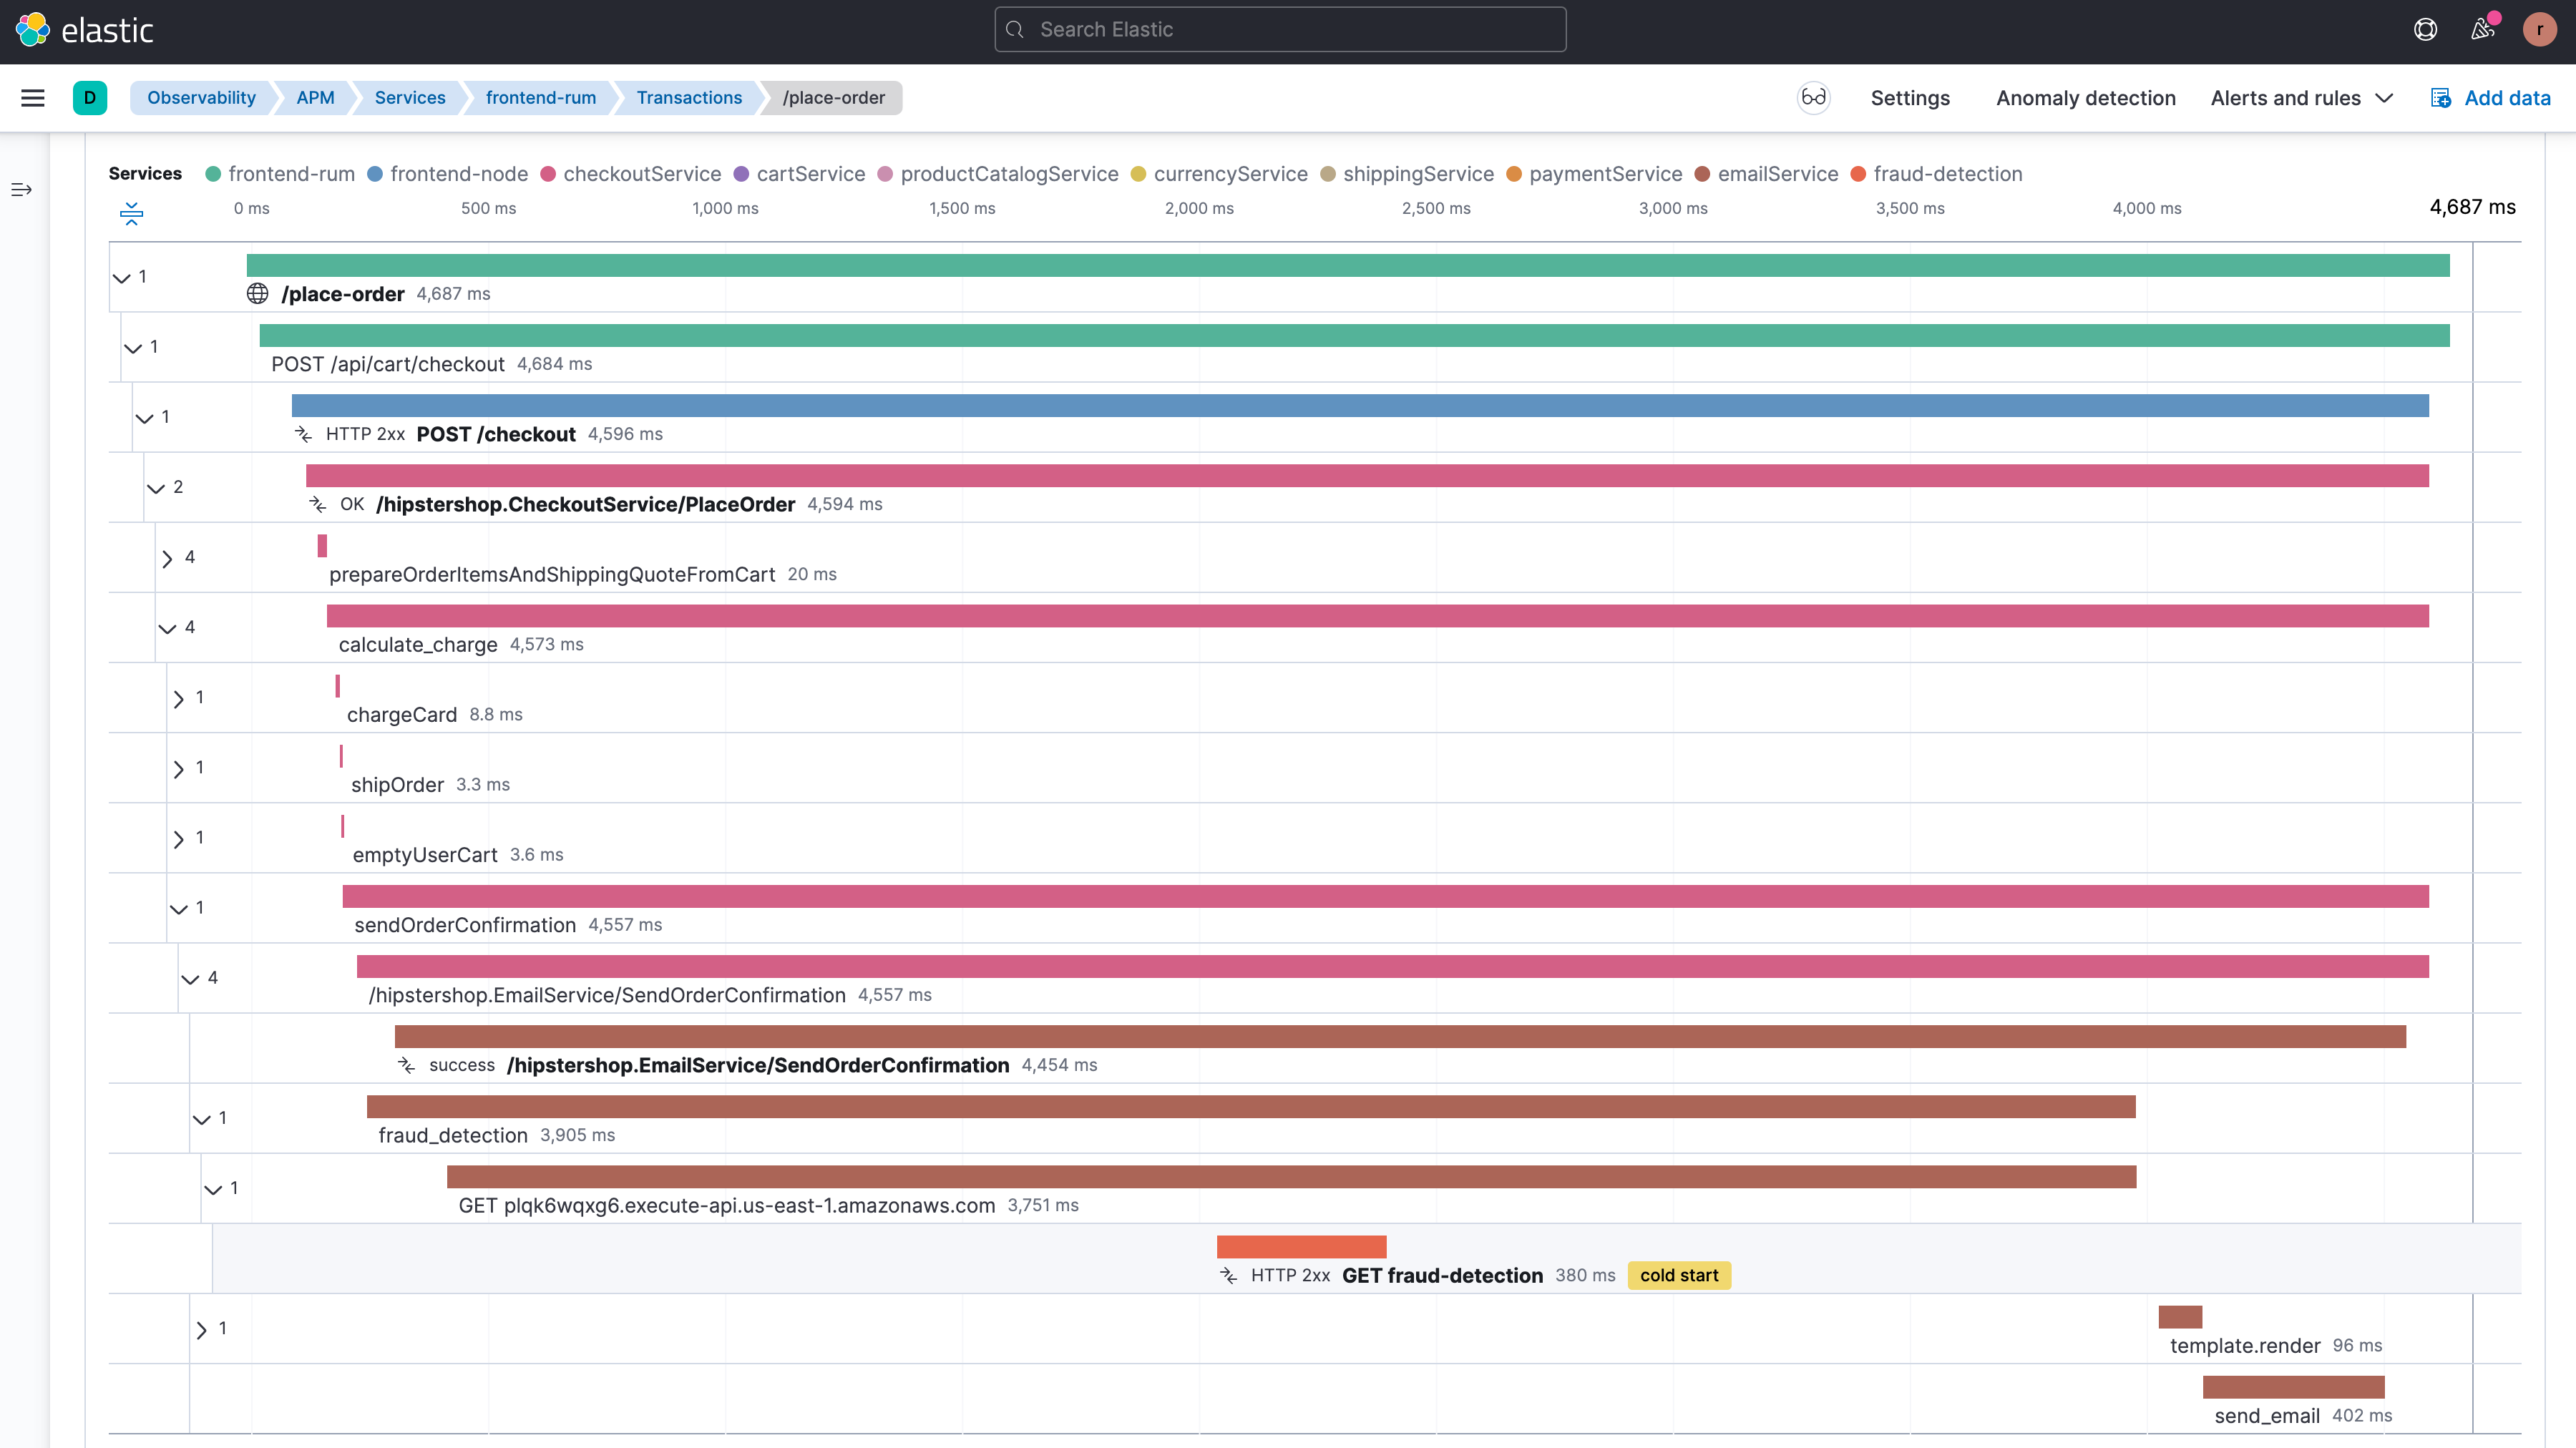
With the 8.2 release, the ability to natively collect serverless traces from AWS Lambda functions is now generally available, providing DevOps and application development teams more detailed end-to-end visibility into distributed transactions that invoke serverless functions.
With the new AWS Lambda APM agent, development teams can collect serverless application traces from Lambda functions written in Node.js, Python, and Java. Elastic additionally supports native cloud monitoring with open standards with the ability to collect Lambda traces via OpenTelemetry (Java and Python only).
“We're excited to start using Elastic's AWS Lambda APM agent for our cloud-native applications. I especially like the fact that it is possible to see whether a particular invocation of the Lambda function involved a cold start directly in the trace waterfall chart. The availability of Lambda-specific metrics, such as cold start rate, at the service and transaction group levels are also very helpful.”
- Jose Navarro, Software Engineer, Accolade
More complete visibility for AWS cloud services
With the 8.2 release, Elastic continues to make it faster, simpler, and more flexible to ingest more AWS data sources into Elasticsearch, giving customers more complete visibility into their cloud-based applications and infrastructure within Elastic’s powerful search and analytics platform.
In addition to a plethora of out-of-the-box AWS integrations, customers can now also ingest custom logs from Amazon S3 and CloudWatch into Elasticsearch, and optionally set up their own index templates, ingest pipelines, and output specifications.
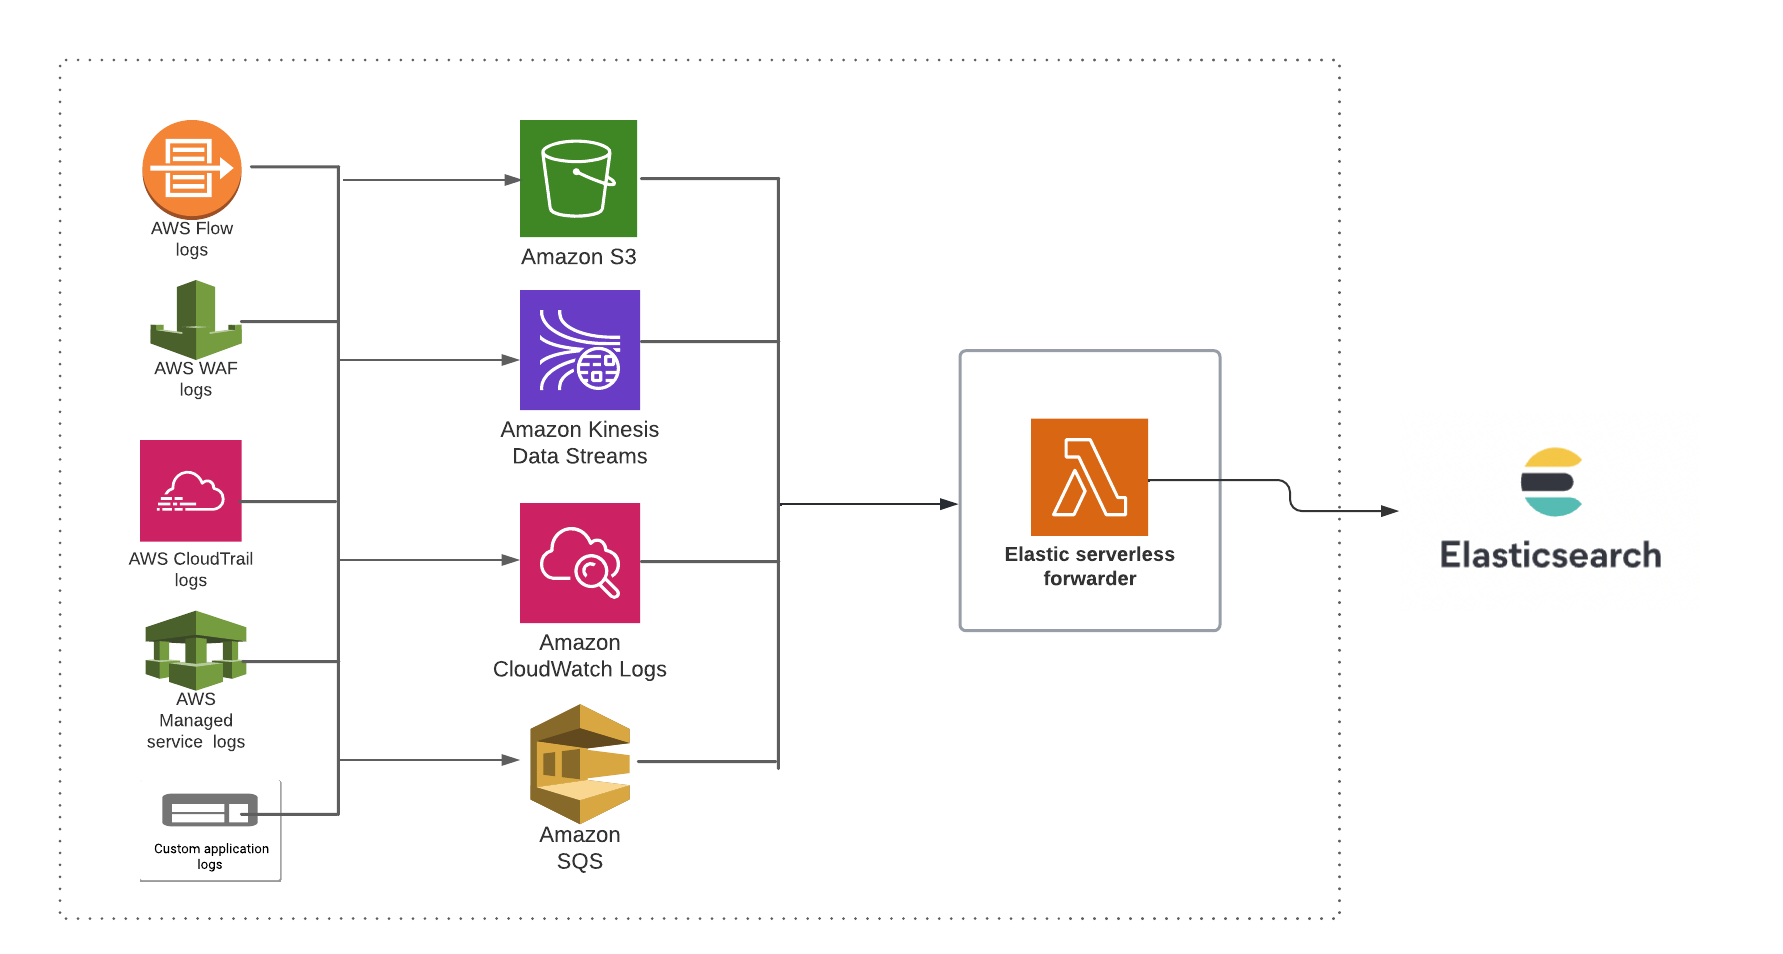
Finally, the Elastic Serverless Forwarder now supports AWS CloudWatch, Kinesis Data Streams, and direct SQS as additional (beta) input sources for logs ingest. Elastic Serverless Forwarder is a Lambda application published in AWS Serverless Application Repository (SAR) that enables Elastic users to collect logs from AWS services (such as S3) in a serverless fashion. These enhancements give customers further flexibility by providing ingest choices that are congruent with existing operating procedures and architectural preferences.
New synthetic cloud testing infrastructure (beta)
Monitoring based on synthetic transactions enables web and development teams to proactively catch issues with critical web transactions before customers do.
The public beta of our new cloud-based synthetic testing infrastructure is now available free of charge for a limited time to Elastic Cloud customers running Elastic Observability 8.2. This is part of an entirely reimagined synthetic testing offering that will be released in the near future — stay tuned for updates.
To sign up for the Elastic Observability synthetic cloud testing beta program, please login to the Uptime product.
Compressed spans, an enhanced Elastic Agent, and more
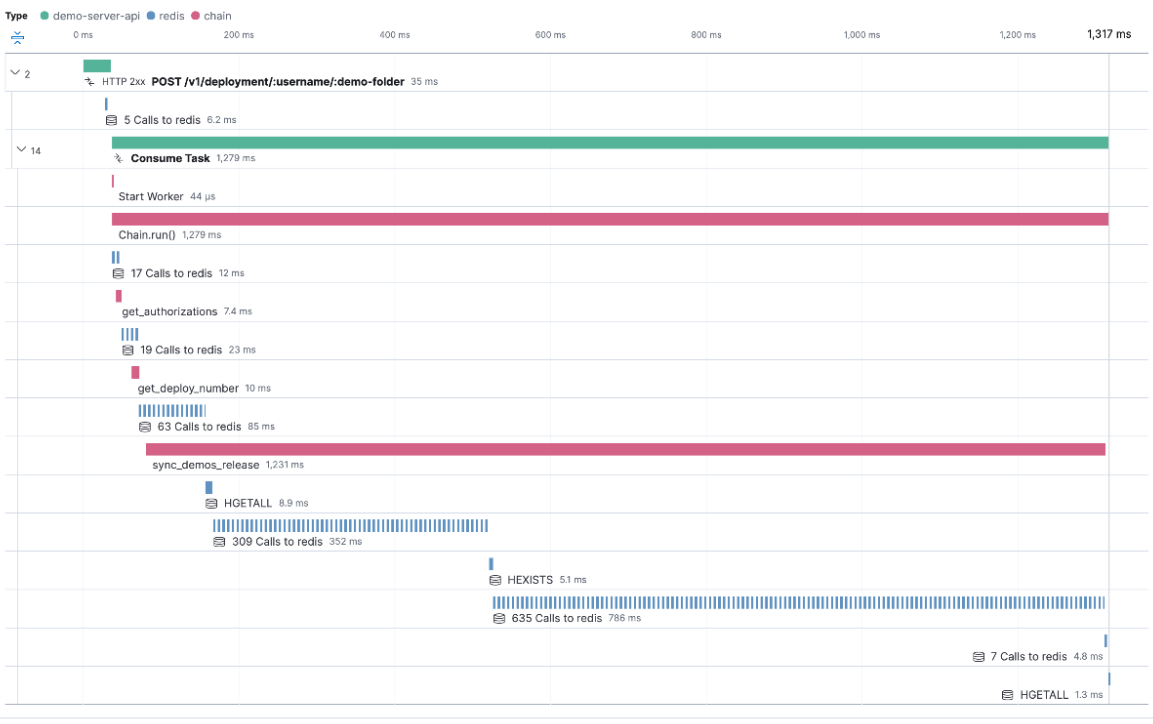
With Elastic Observability 8.2, the general availability of the compressed spans capability gives customers the ability to optimize network transfer and storage costs by efficiently capturing and visualizing spans from data-intensive applications. For example, one of the biggest sources of excessive data collection are n+1 type queries and repetitive requests to a cache server or database on the backend. To mitigate the potential flood of spans to a backend, spans are collapsed into a single composite span and displayed with summarized context within the trace.
By popular request, Elastic Agent now supports Logstash output (beta), among other key enhancements.
Finally, we continue to enhance alerting rules and management capabilities (available in technical preview) with:
- A dedicated rules management view for the Elastic Observability solution that allows users to maintain observability rules within an observability context.
- Enhanced alert notifications that make alerts more actionable by allowing users to include the alert reason and View in App URL link in alert notifications.
Try it out
Existing Elastic Cloud customers can access many of these features directly from the Elastic Cloud console. If you’re new to Elastic Cloud, take a look at our Quick Start guides (bite-sized training videos to get you started quickly) or our free fundamentals training courses. You can always get started for free with a free 14-day trial of Elastic Cloud. Or download the self-managed version of the Elastic Stack for free.
Read about these capabilities and more in the Elastic Observability 8.2 release notes, and other Elastic Stack highlights in the Elastic 8.2 announcement post.
The release and timing of any features or functionality described in this post remain at Elastic's sole discretion. Any features or functionality not currently available may not be delivered on time or at all.
Share
- Share on Twitter
Share on Twitter
- Share on LinkedIn
Share on LinkedIn
- Share on Facebook
Share on Facebook
- Share by Email
Share by Email
- Print this page
Print