What’s new in 8.2
editWhat’s new in 8.2
editHere are the highlights of what’s new and improved in 8.2.
Other versions: 8.1 | 8.0 | 7.17 |
AWS serverless log ingestion for faster insight
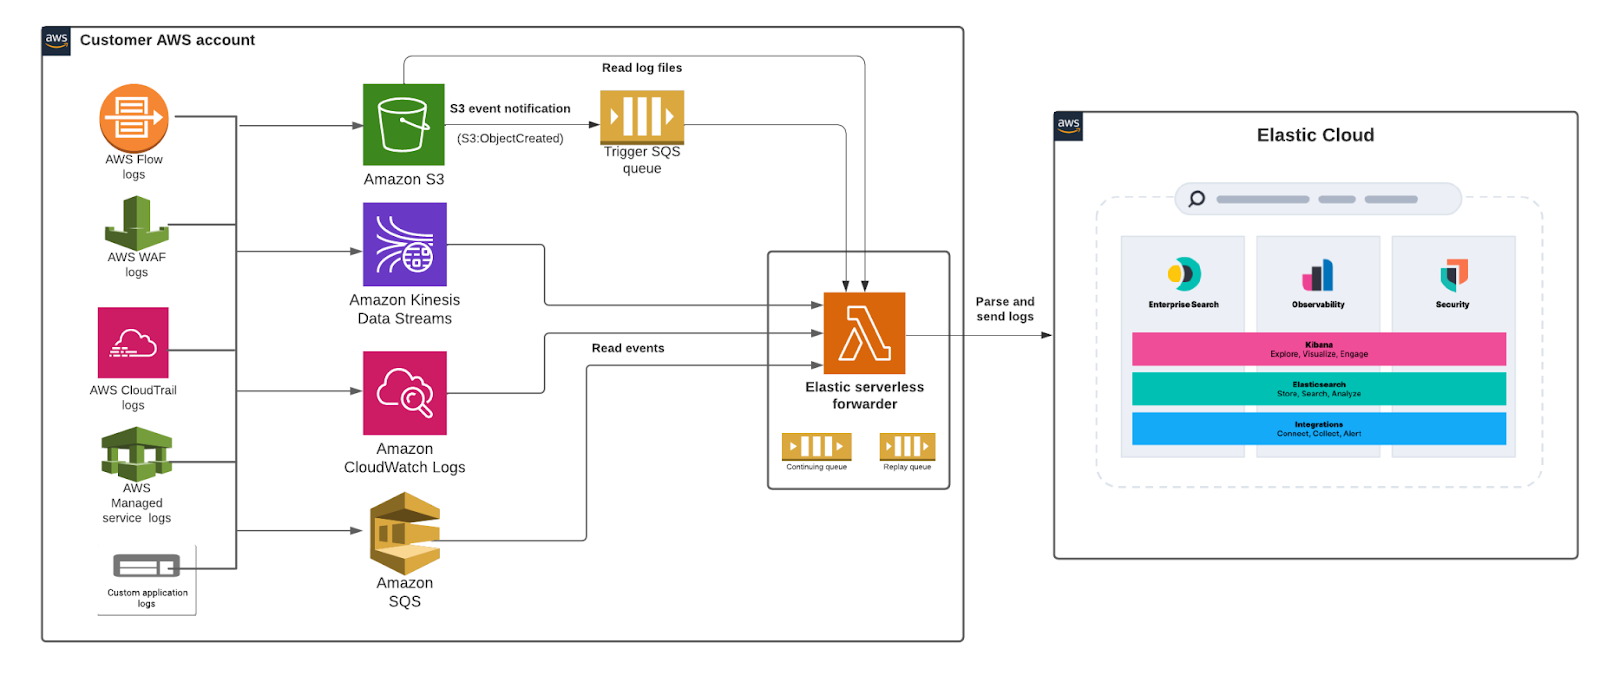
editThe elastic-serverless-forwarder application enables you to ingest logs from the AWS environment into Elastic in a completely serverless fashion. You don’t need to set up and maintain compute resources, which simplifies the getting started experience and reduces data onboarding friction. The application is publicly available in the Serverless Application repository (SAR), an AWS-managed repository for serverless applications.
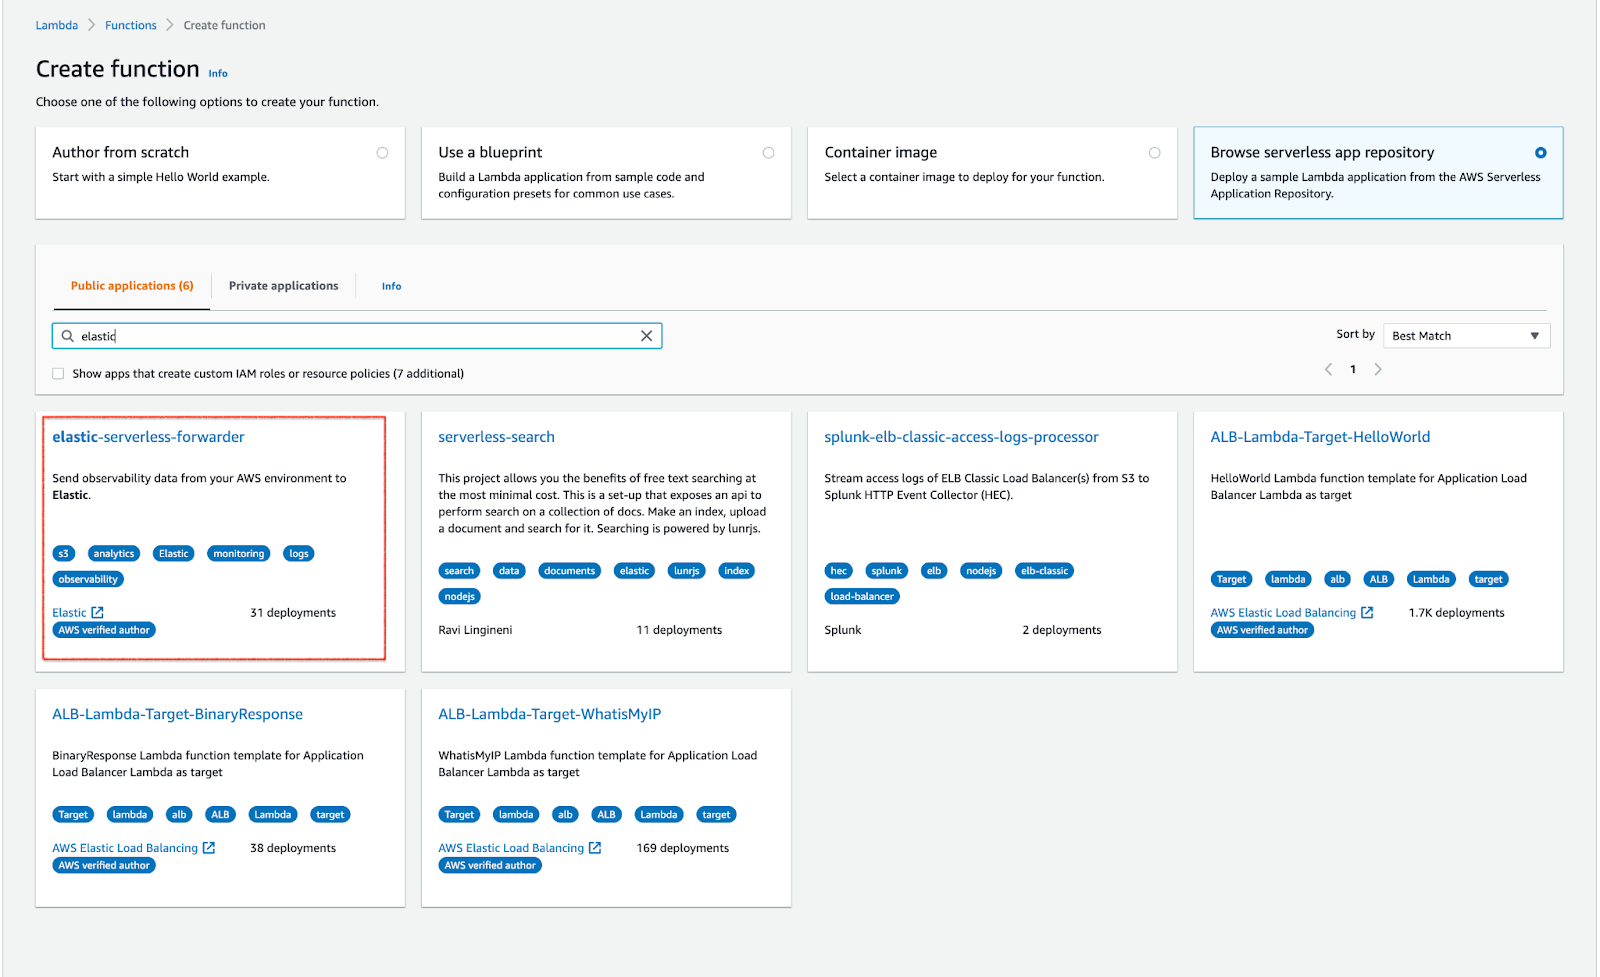
We started with Amazon S3 in the last release and have now added Kinesis data streams, CloudWatch logs, and direct SQS queue as additional input options. This application fits seamlessly into your current operating environment, which means you don’t need to change any environments to start getting the logs ingested into Elastic.
For more information, see our blog and documentation.
Custom AWS logs integration for Elastic Agent
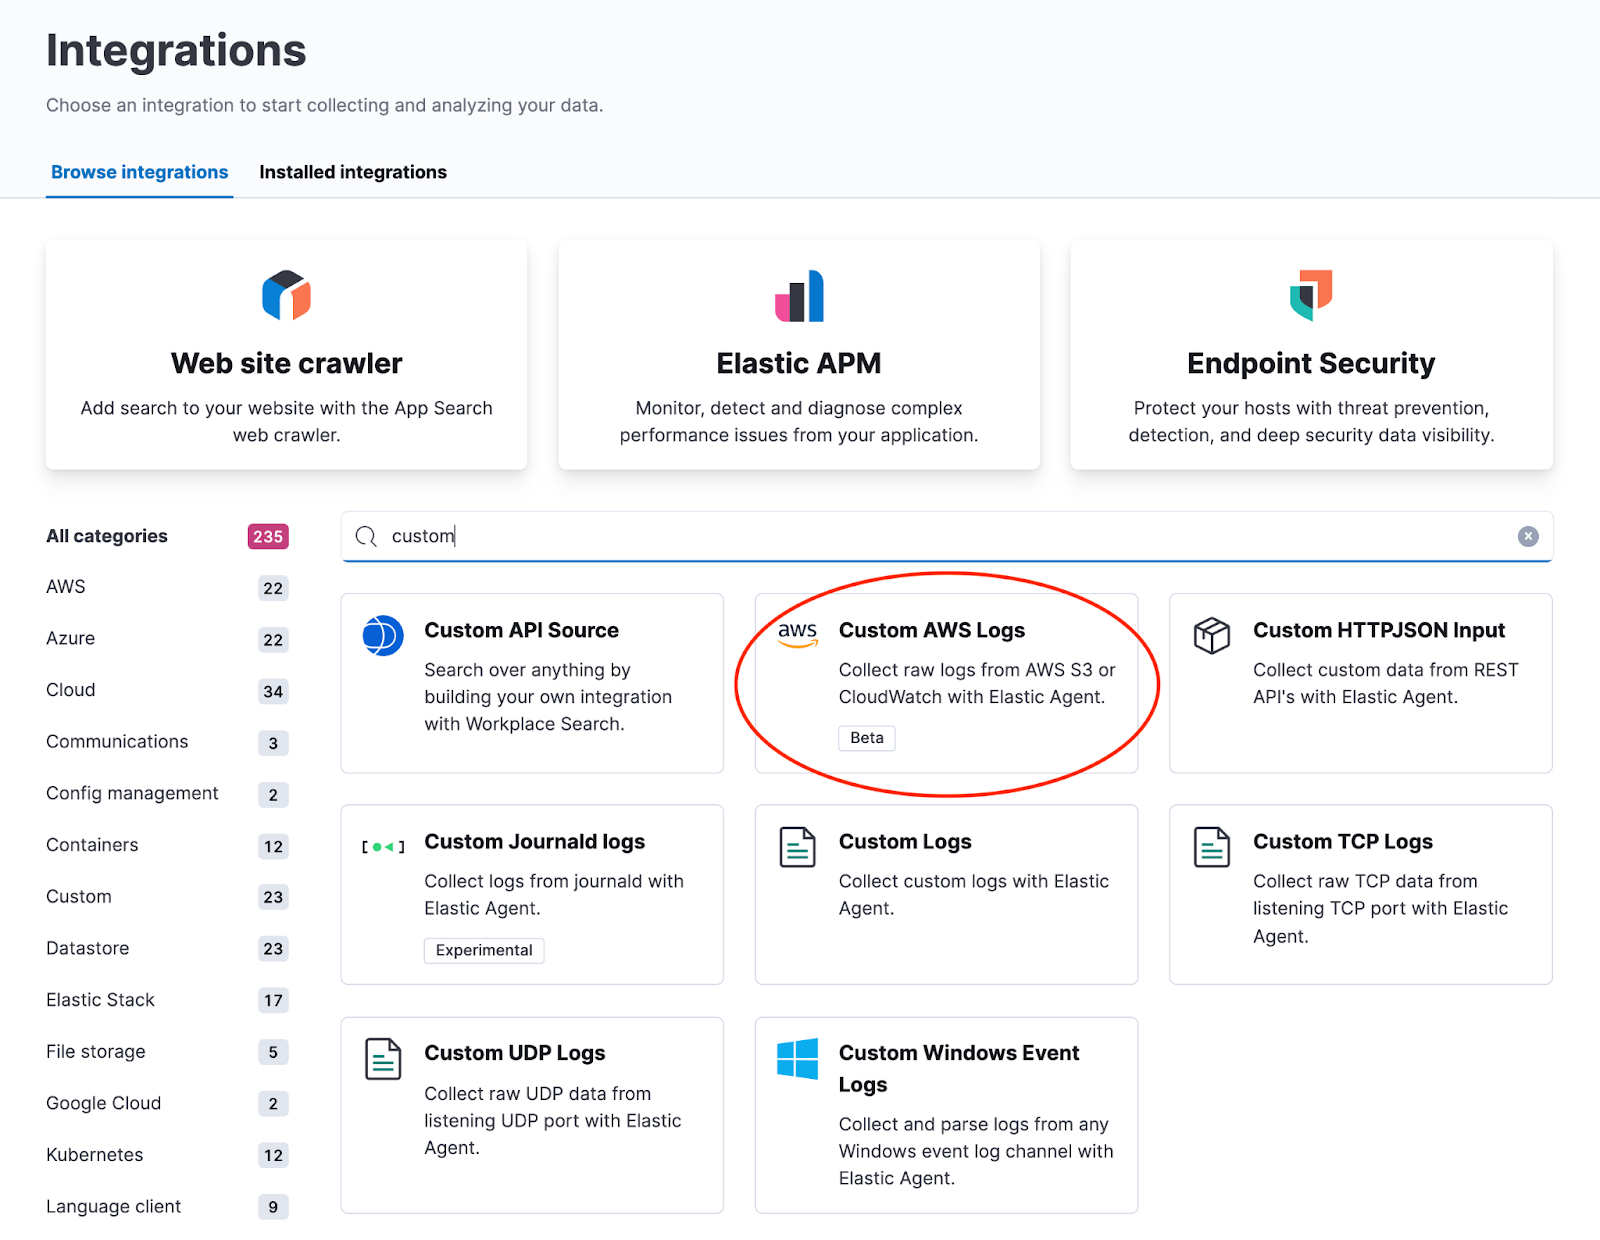
editWe have added a new Custom AWS logs integration for ingesting custom AWS logs for which we don’t have an out-of-the-box Elastic Agent integration. This new integration supports both Amazon S3 and CloudWatch logs as an input source for these logs. You can choose to set up your own index templates and ingest pipelines, and configure the integration to write data to a specific data stream. You can then use the power of Kibana to analyze the collected data.
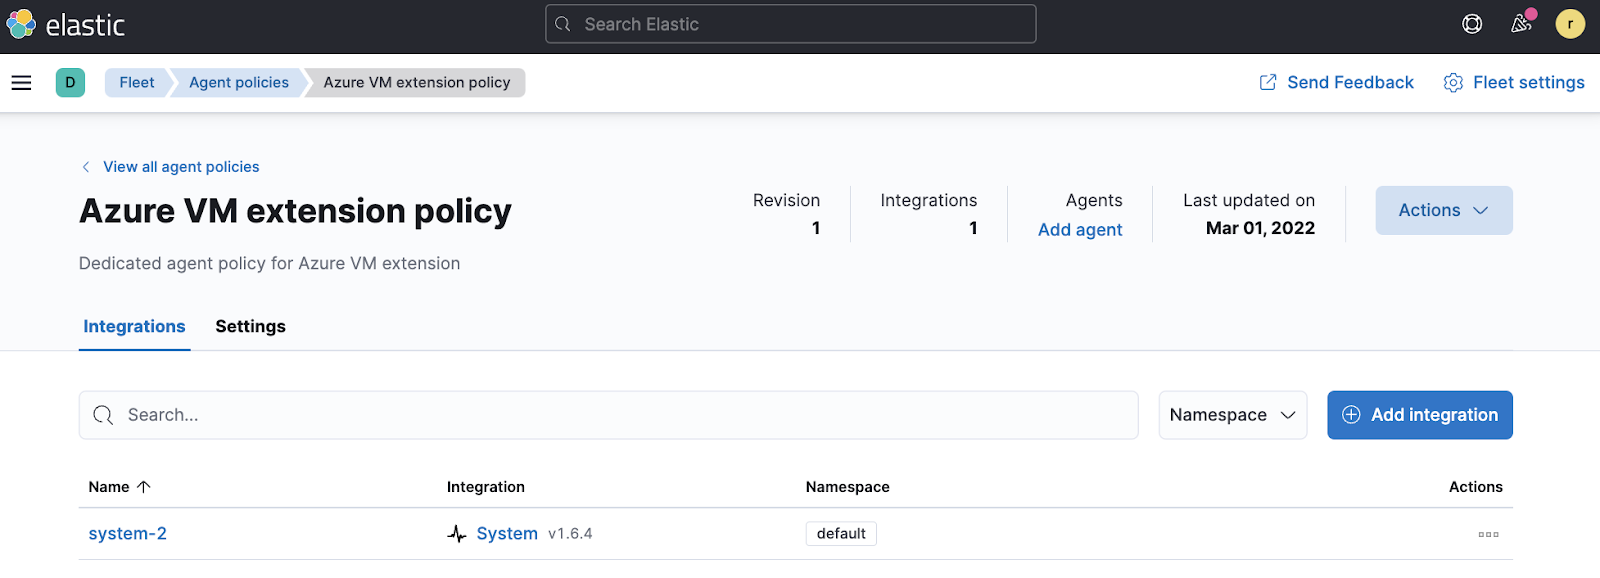
Elastic Agent Azure virtual machine extension
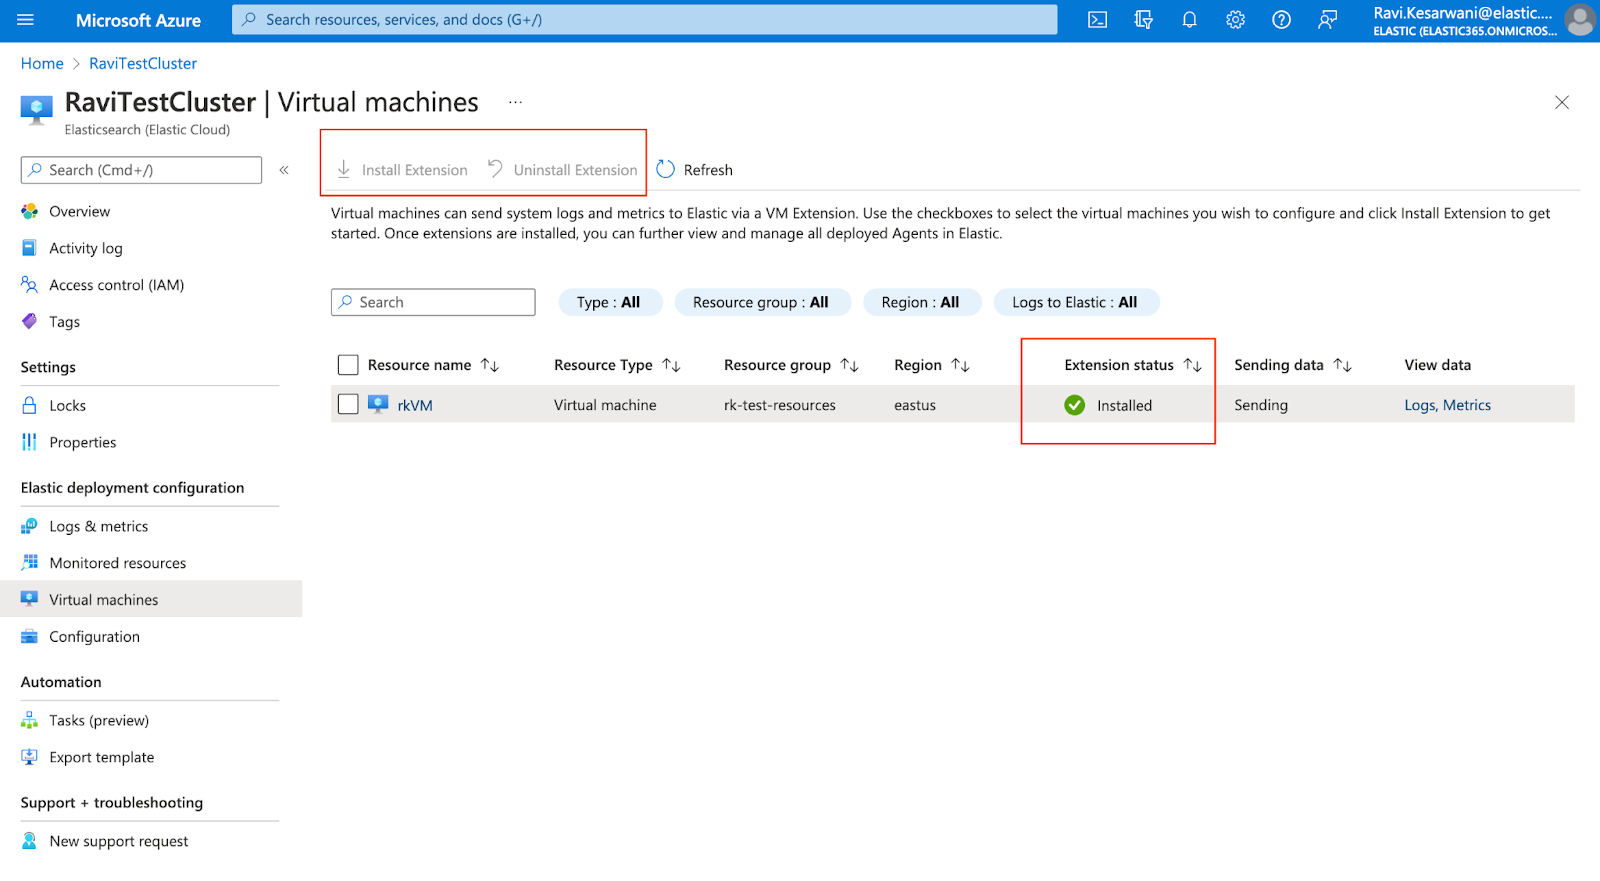
editThe new Microsoft Azure VM extension for Elastic Agent provides Azure users a straightforward way to install and register Elastic Agent on all their Azure VMs. It automatically installs Elastic Agent, registers it with Fleet, creates a separate policy that collects system logs and metrics, and assigns this policy — all with a single checkbox or command line option.
You can use the Elastic deployment pane on the Azure console to configure the Elastic Azure VM extension with a single click. If you prefer to manage with scripts, you can use Azure CLI or Powershell to interact with the extension and get Elastic Agent installed and configured on all your Azure VMs.
Then you can manage the lifecycle of your Elastic Agents from within Fleet. For more information, see the Native Azure integration documentation and Monitor Microsoft Azure tutorial.
Elastic Agent support for Logstash output (public beta)
editYou can now add a Logstash instance as an output to an Elastic Agent policy. This feature is available as a public beta, with the goal of making it generally available (GA) in 8.4. Inline instructions are provided to Configure Logstash for Elastic Agent (as shown below) that step through the requirements to establish a secure connection between agents and the Logstash instance. Please note that mutual TLS is enforced when agents are set to write to a Logstash output.
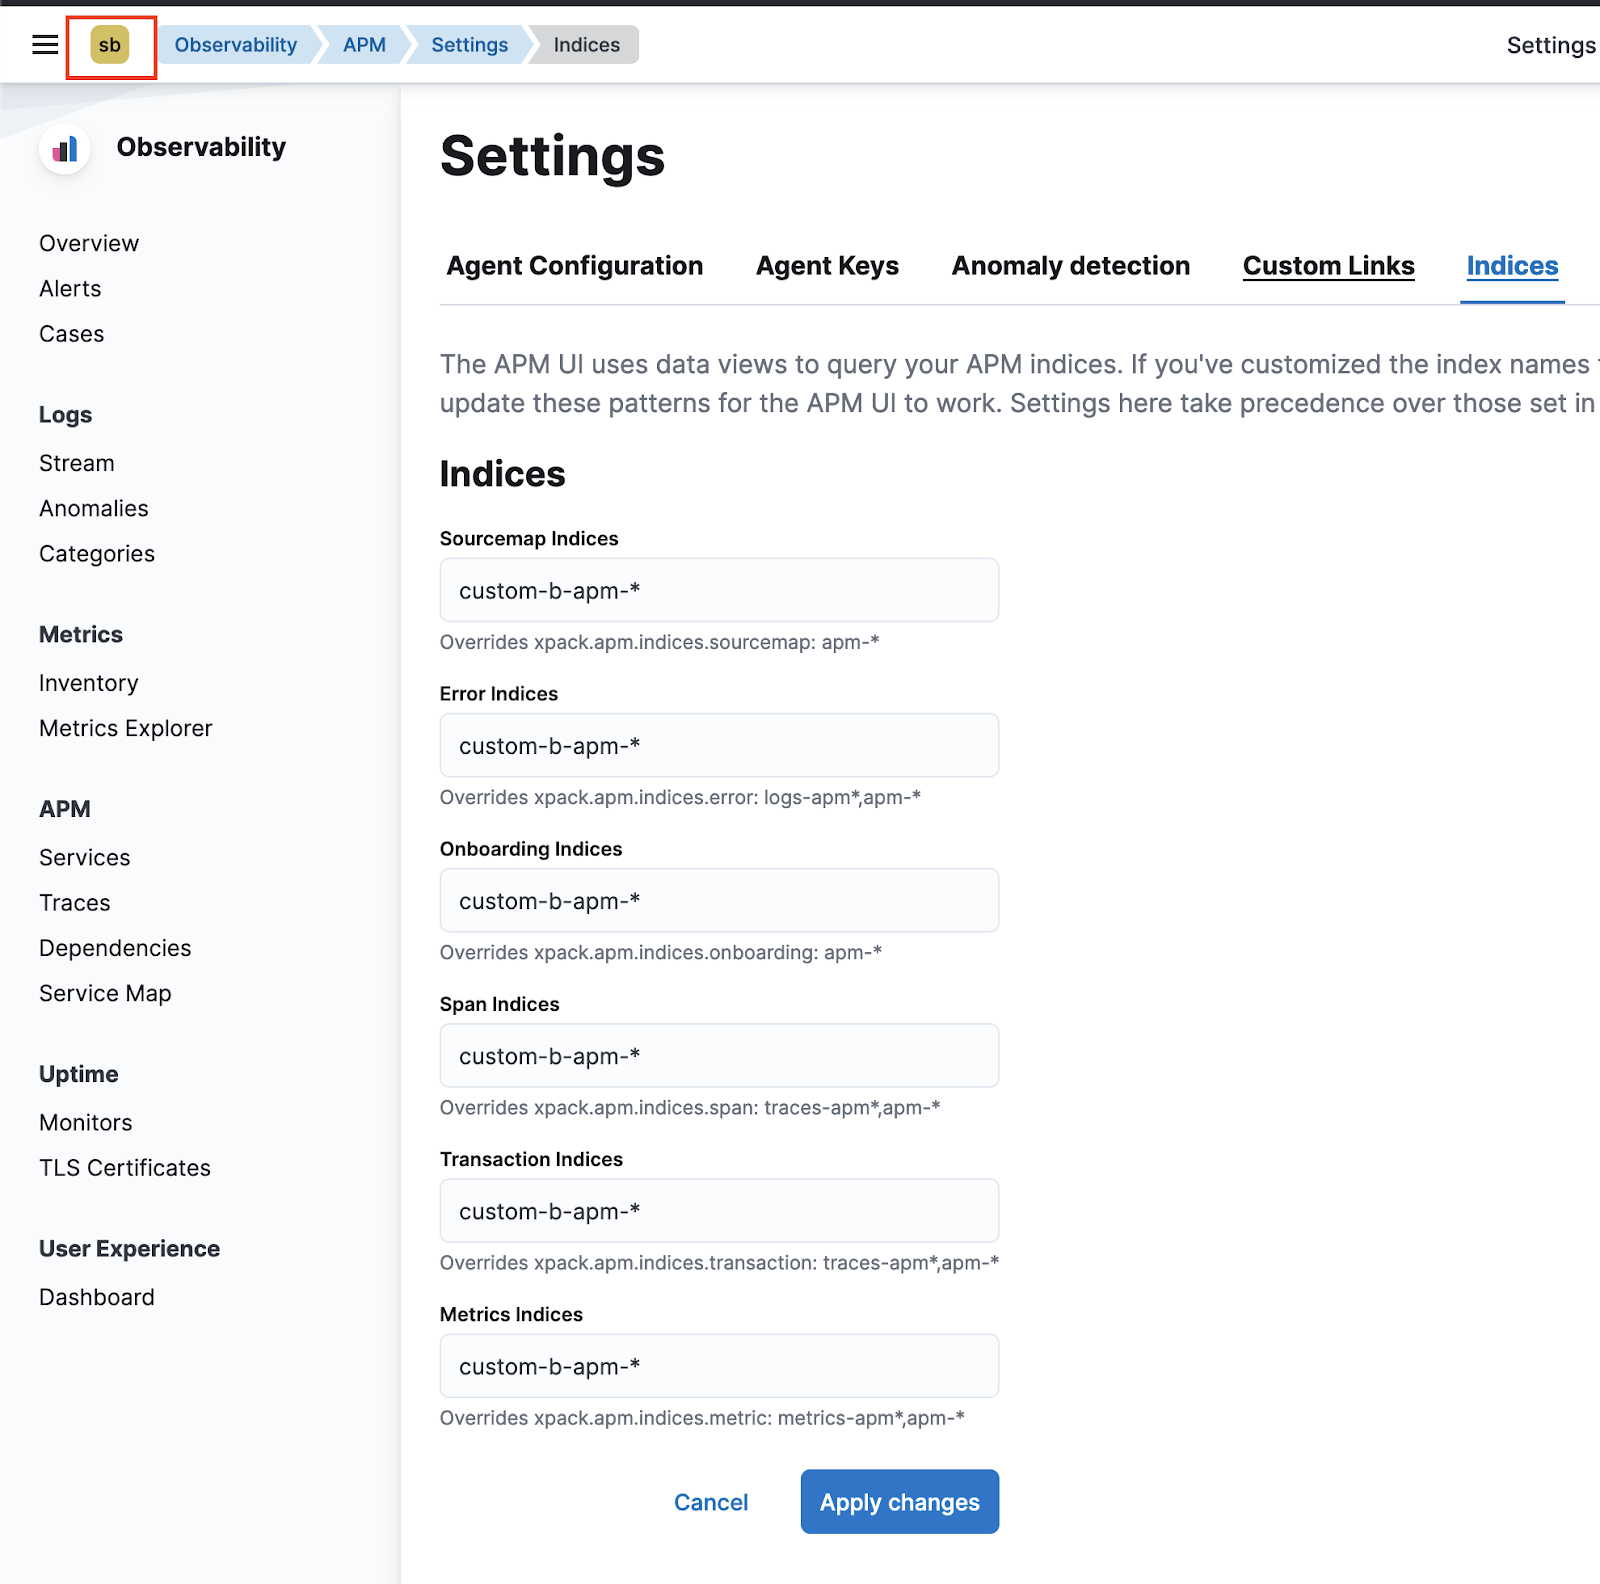
APM support for Kibana spaces
editYou can now configure APM UI indices in the context of Kibana spaces. This enables you to segment APM-related data to leverage Kibana spaces for access controls and UI performance improvements.
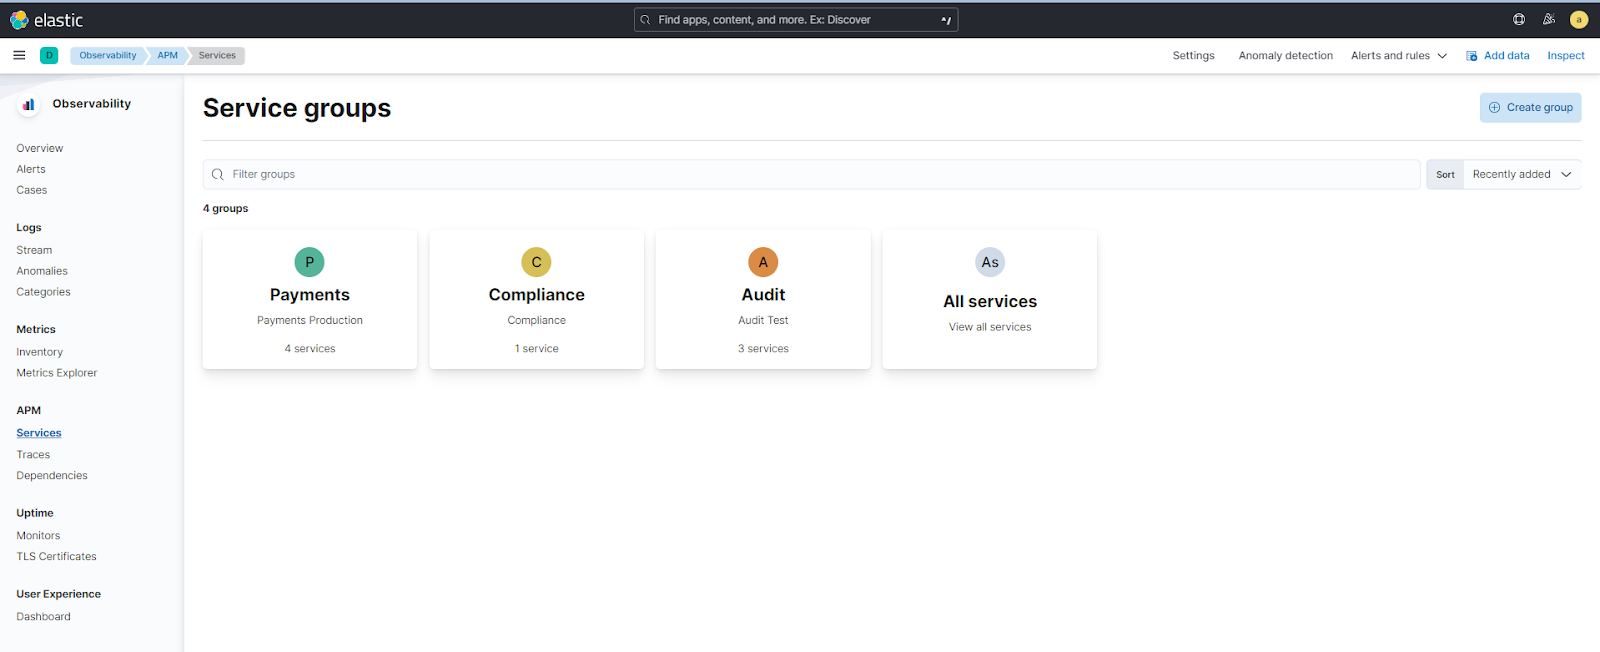
APM Service groups introduced
editAPM Service groups provide a simple way to curate services into groups. Group services together to build curated inventory views that remove noise and simplify investigations across services. Groups are Kibana space-specific and available for any users with appropriate access.
You can create Service groups with a simple KQL-based workflow to populate group members. Once created, group members can interact with the service inventory and service map within the group context.
Service groups are introduced as part of a technical preview — to enable Service groups, navigate to Kibana Stack Management > Advanced Settings > Observability, and enable Service groups feature.
APM visibility for AWS Lambda Functions
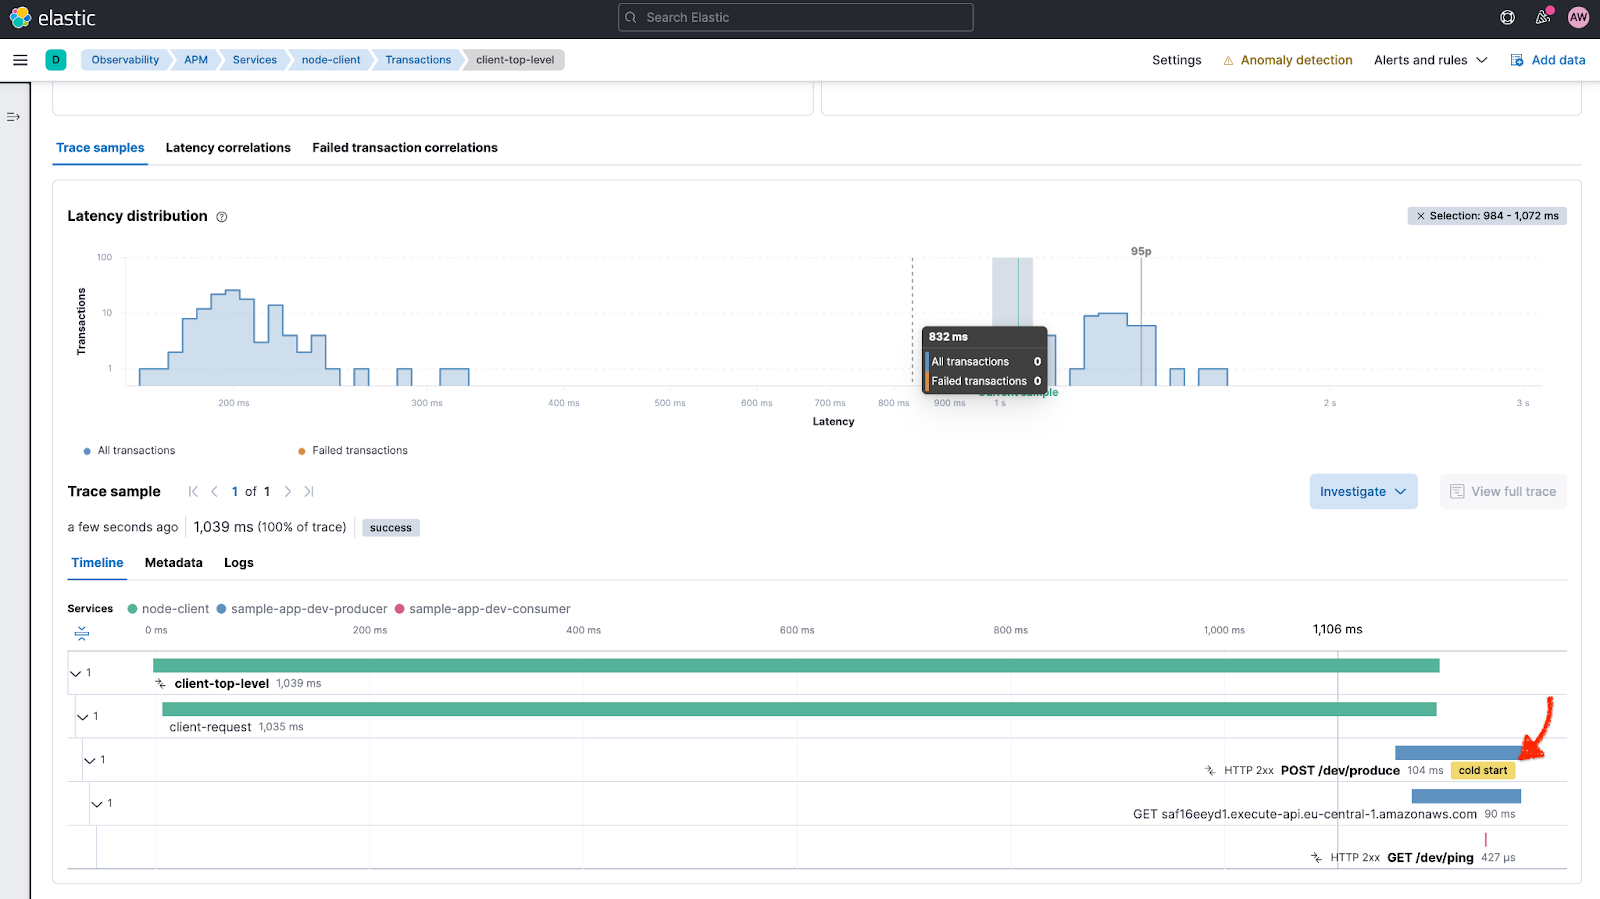
editElastic APM now supports distributed tracing for AWS Lambda Functions running in production environments. This feature is currently supported by the Java, Python, and Node.js Agents. It provides performance monitoring, error monitoring, and topology views showing dependencies within the distributed microservices architecture. Additionally, auto-instrumentation of traces, transactions, and spans out-of-the-box are supported.
The APM agent sends traces to the APM Lambda Extension which is responsible for APM server interactions. The APM agent identifies cold starts of AWS Lambda functions and collects trigger-specific information for each Lambda invocation, as well as metadata associated with the AWS Lambda runtime.
As can be seen in the following screenshot, cold starts of lambda invocations are directly denoted in the trace waterfall view.
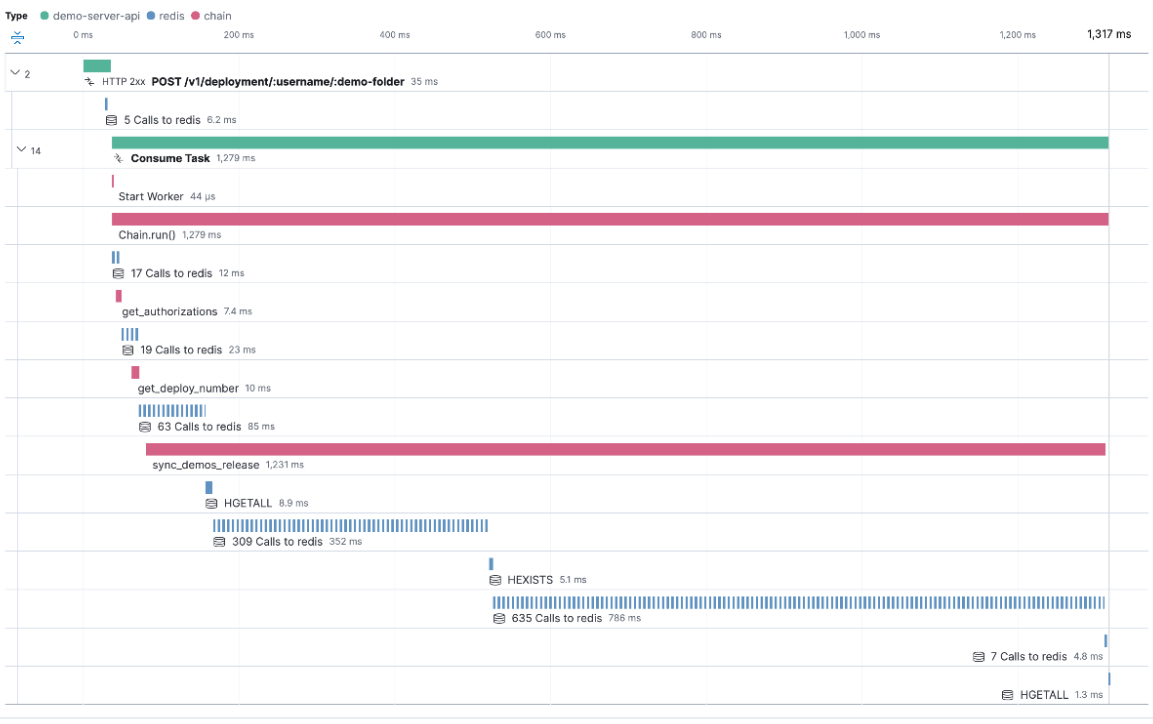
Support for compressed spans in Elastic APM
editYou can now reduce storage and processing overheads associated with low-value spans such as those encountered in an N+1 query to a database or cache. Normally, it would be quite difficult to analyze a trace waterfall in the UI involving hundreds of short duration spans. This feature enables such spans to be represented by a single aggregated span. The compressed span also provides contextual information such as the total number of spans included, total duration, and average span duration. This feature is currently supported by the Java, .NET, Python, GO, and PHP Agents.
New dedicated view for Observability alerting rules
editAs part of our ongoing improvements to Observability alerting features (currently available as a technical preview), you can now manage rules via a dedicated Observability rule management view available from the Alerts page. This means you don’t have to leave the Observability context to view observability-specific alerting rules, making it easier to find and manage relevant rules. Use search and filter options to quickly identify and select the rules you want to manage. In addition to the new view, you can now also include the alert reason message and View in app URL as variables within alert notifications.
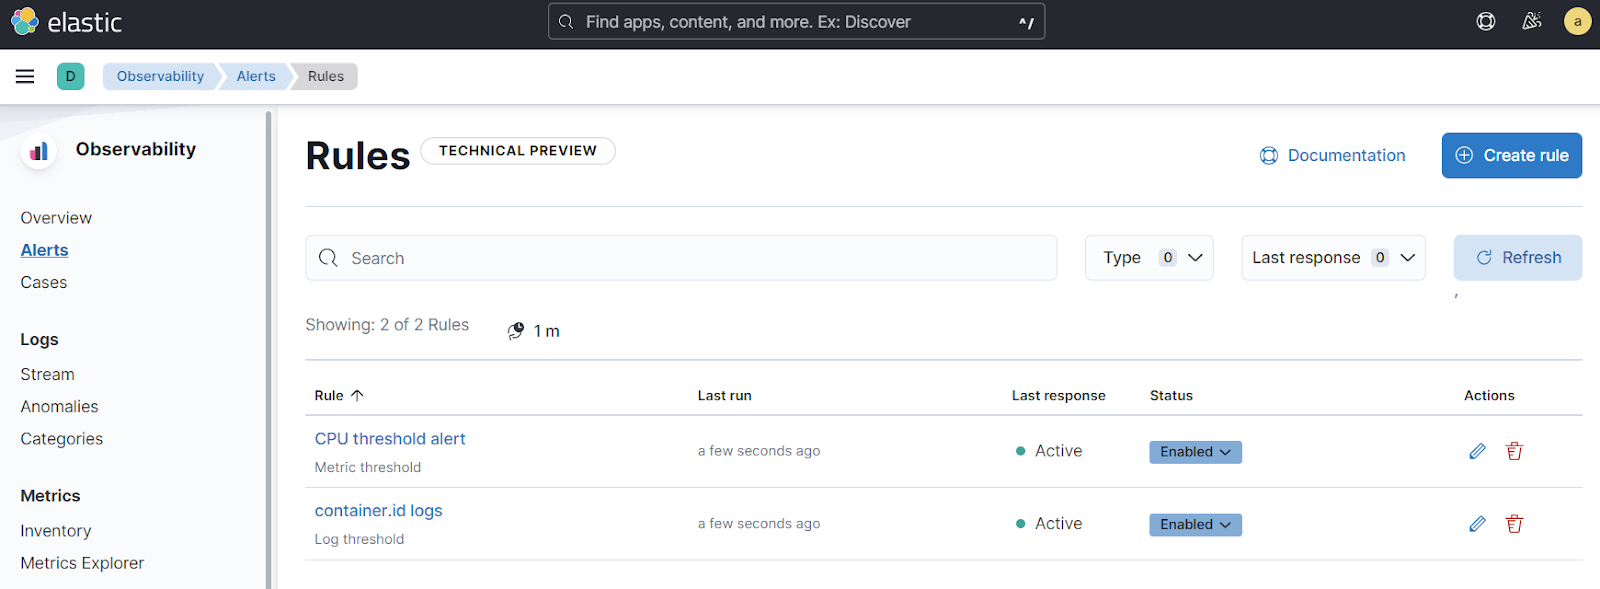
For more information, see the Alerts documentation.