What is Elastic Observability?
editWhat is Elastic Observability?
editObservability provides you with granular insights and context into the behavior of applications running in your environments. At Elastic, we view observability as an attribute of any system that you build and want to monitor. Being able to detect and fix root cause events quickly within an observable system is what we consider a minimum requirement for any analyst.
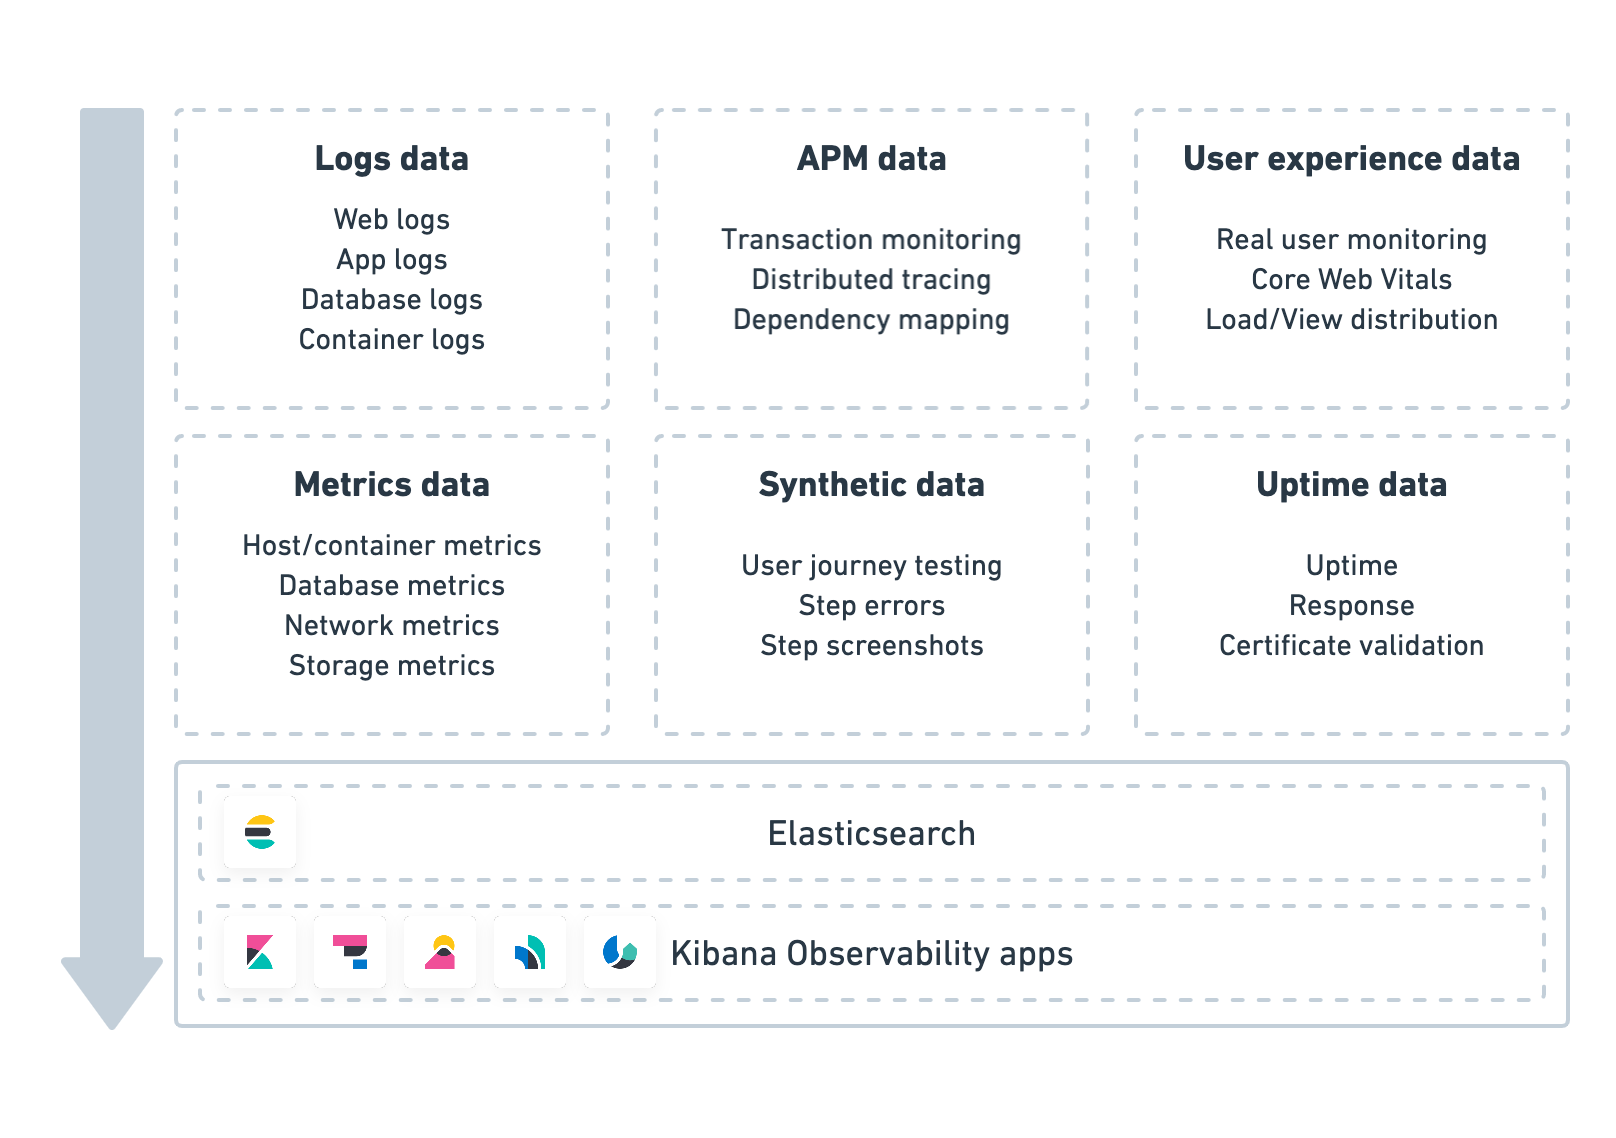
Elastic Observability provides you with a single stack to unify your logs, metrics, uptime data, application traces, user experience data, and synthetics. Ingest your data directly to Elasticsearch, where you can further process and enhance the data, before visualizing it in Kibana.
Search, monitor, and apply analytics in real time to events happening across all of your environments. Analyze the logs for a specific transaction, monitor the performance metrics for the host or container that it ran in, trace the transaction, and check the overall service availability.
Logs data
editAnalyze log data from your hosts, services, Kubernetes, Apache, and many more. To view a live stream of your logs and to filter, pin, or highlight the data you need, drill-down into the Logs app.
Metrics data
editMonitor system and service metrics from your servers, Docker, Kubernetes, Prometheus, along with other services and applications. To monitor and filter your data by hosts, pods, containers, or EC2 instances, drill-down into the Metrics app. You can also create custom groupings such as availability zones or namespaces.
APM data
editTo instrument your code and collect performance data and errors at runtime, install APM agents like Java, Go, .NET, and many more. To quickly find the APM traces for underlying services, drill-down into the APM app.
Uptime data
editInstall and configure Heartbeat on your servers to monitor host availability, service uptime, web site endpoints, and API monitoring. For detailed monitor summaries, with support for monitors from multiple locations, drill-down into the Uptime app.
User experience data
editUser Experience data, powered by the APM Real User Monitoring (RUM) agent, provides a way to quantify and analyze the perceived performance of your web application.
Synthetic monitoring data
edit[beta] This functionality is in beta and is subject to change. The design and code is less mature than official GA features and is being provided as-is with no warranties. Beta features are not subject to the support SLA of official GA features. Synthetic monitoring allows you to simulate actions and requests that an end-user would perform on your site at predefined intervals and in a controlled environment. The end result is rich, consistent, and repeatable data that you can trend and alert on.
Alerting
editTo help keep you aware of potential issues in your environments, the Logs app, Metrics app, APM app, and the Uptime app all integrate with Kibana’s alerting and actions feature. It provides a set of built-in actions and specific threshold rules for you to use and enables central management of all rules from Kibana Management.