Slow and steady: How to build custom grok patterns incrementally
In our blog post on structuring Elasticsearch data with grok on ingest for faster analytics, we took a look at how to structure unstructured data on ingest (schema on write) to make sure your analytics run at near real time. Speed like that can help take your observability use cases to the next level.
In this article, we’re going to build on what we learned by incrementally creating a new grok pattern from scratch! This means that no matter your use case or requirements, you’ll be able to structure your data to boost your speeds.
Debugging grok patterns
Two tools that can be helpful for building and debugging grok patterns are the simulate pipeline API, which we used in a previous installment of this blog series, and Kibana’s Grok Debugger. The incremental construction method shown here will work with either of these tools. In this article we’ll use Grok Debugger.
Structuring data
For this blog, let's assume that we are told to write a grok pattern to parse the following message:
"55.3.244.1 GET /index.html 15824 0.043 other stuff"
Let’s also assume that we have been told to structure the above data into Elastic Common Schema (ECS)-compliant field names, and we have been given the following information about the above message:
- The first token is a host IP address.
- The second token is an HTTP request method.
- The third token is a URI.
- The fourth token is the size of the request in bytes.
- The fifth token is the event duration.
- The remaining text is just some additional text that we don’t care about.
Based on these instructions, for the above message we would like to have the following ECS-compliant fields extracted:
"host.ip": "55.3.244.1"
"http.request.method": "GET"
"url.original": "/index.html"
"http.request.bytes": 15824
"event.duration": 0.043
Incrementally building a new grok expression
We will now incrementally build up a grok expression starting from the left and working to the right. Let’s start by seeing if we can pull out the IP address from the message. We will use the IP grok pattern to match the host.ip field, and the GREEDYDATA pattern to capture everything after the IP address. This would look as follows:
%{IP:host.ip}%{GREEDYDATA:my_greedy_match}
Let's go to Dev Tools in Kibana to use the Grok Debugger to see if this grok pattern is able to parse the message:
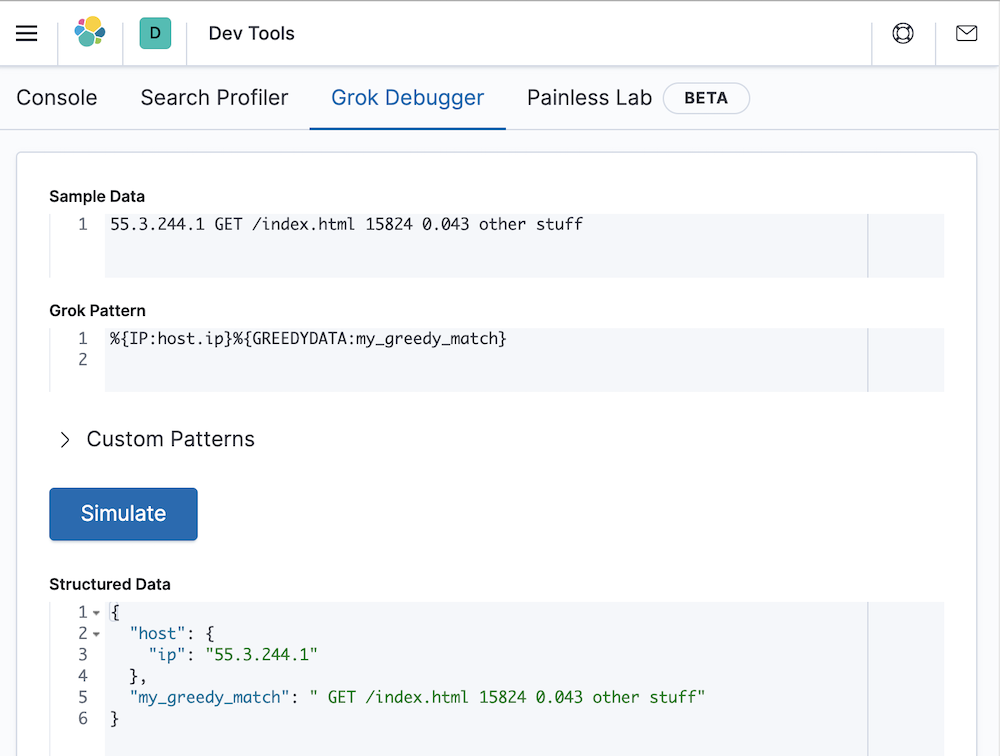
It worked as expected. The host.ip field has been correctly extracted and the remainder of the message has been stored in my_greedy_match. Success!
Let’s add in the next part of the grok pattern. We know that this is the http.request.method field, which is a WORD grok pattern. We therefore augment our grok pattern as follows:
%{IP:host.ip}%{WORD:http.request.method}%{GREEDYDATA:my_greedy_match}
However, as shown below, testing this in Kibana’s debugger gives an empty response. This is not what we expected!
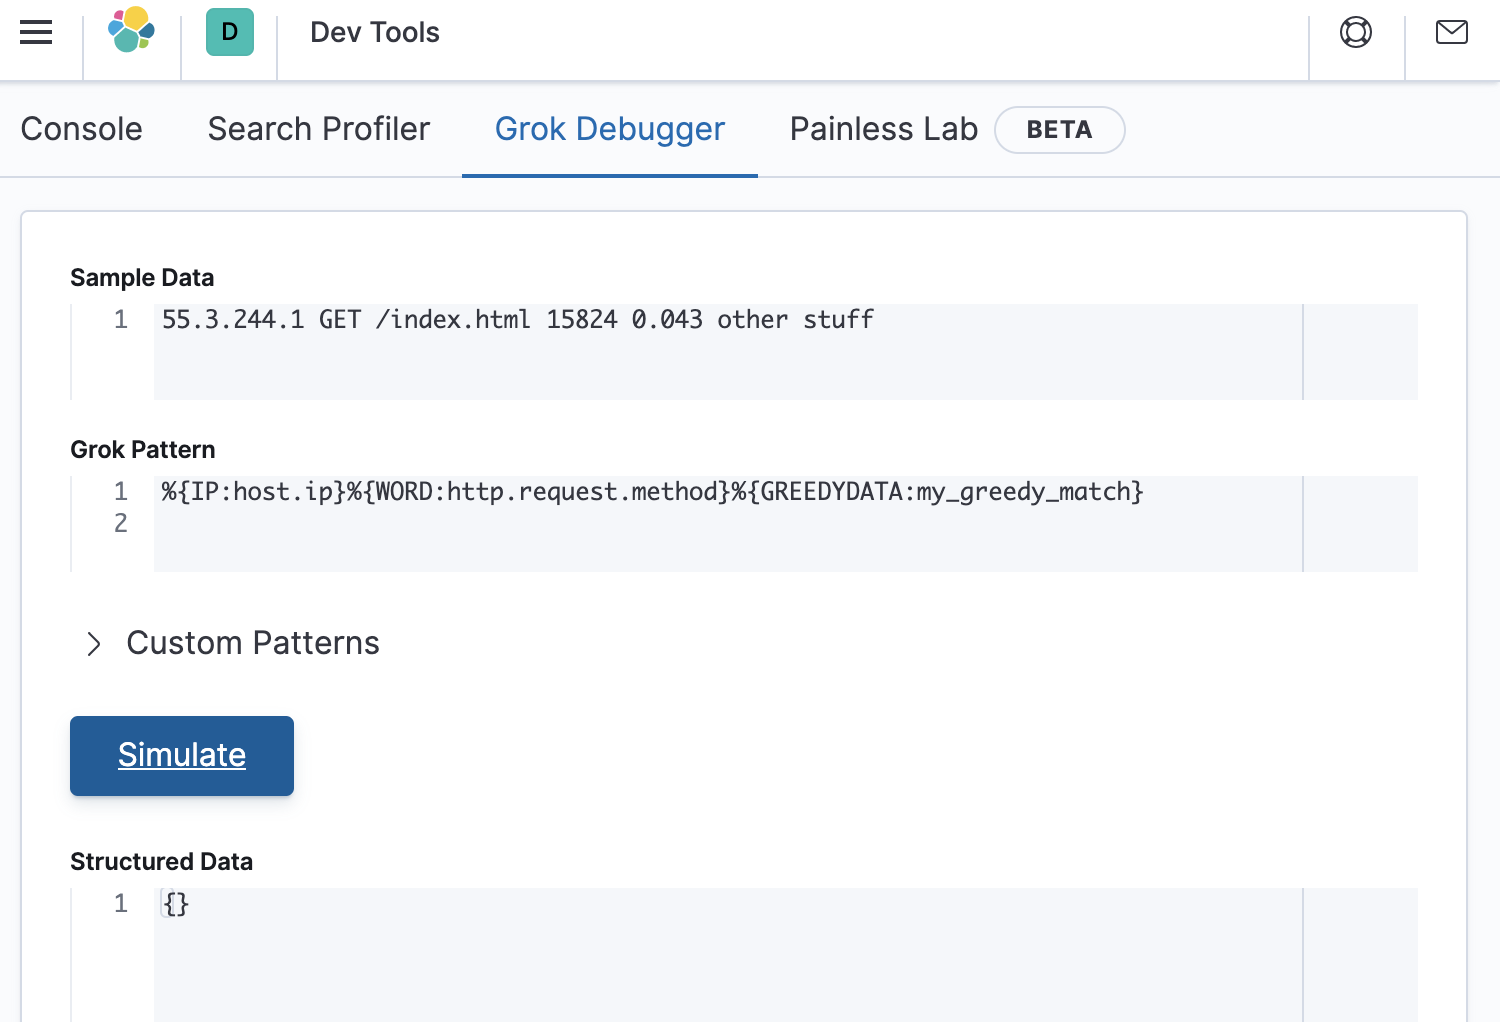
The reason for the empty response is that the pattern didn’t match. This is because the message has a space between the host.ip (in this example 55.3.244.1) and the request.method (in this example GET), but we did not include a space in the grok pattern. Let’s fix this error and try again with the following grok pattern.
%{IP:host.ip} %{WORD:http.request.method}%{GREEDYDATA:my_greedy_match}
And test it in Kibana as follows:
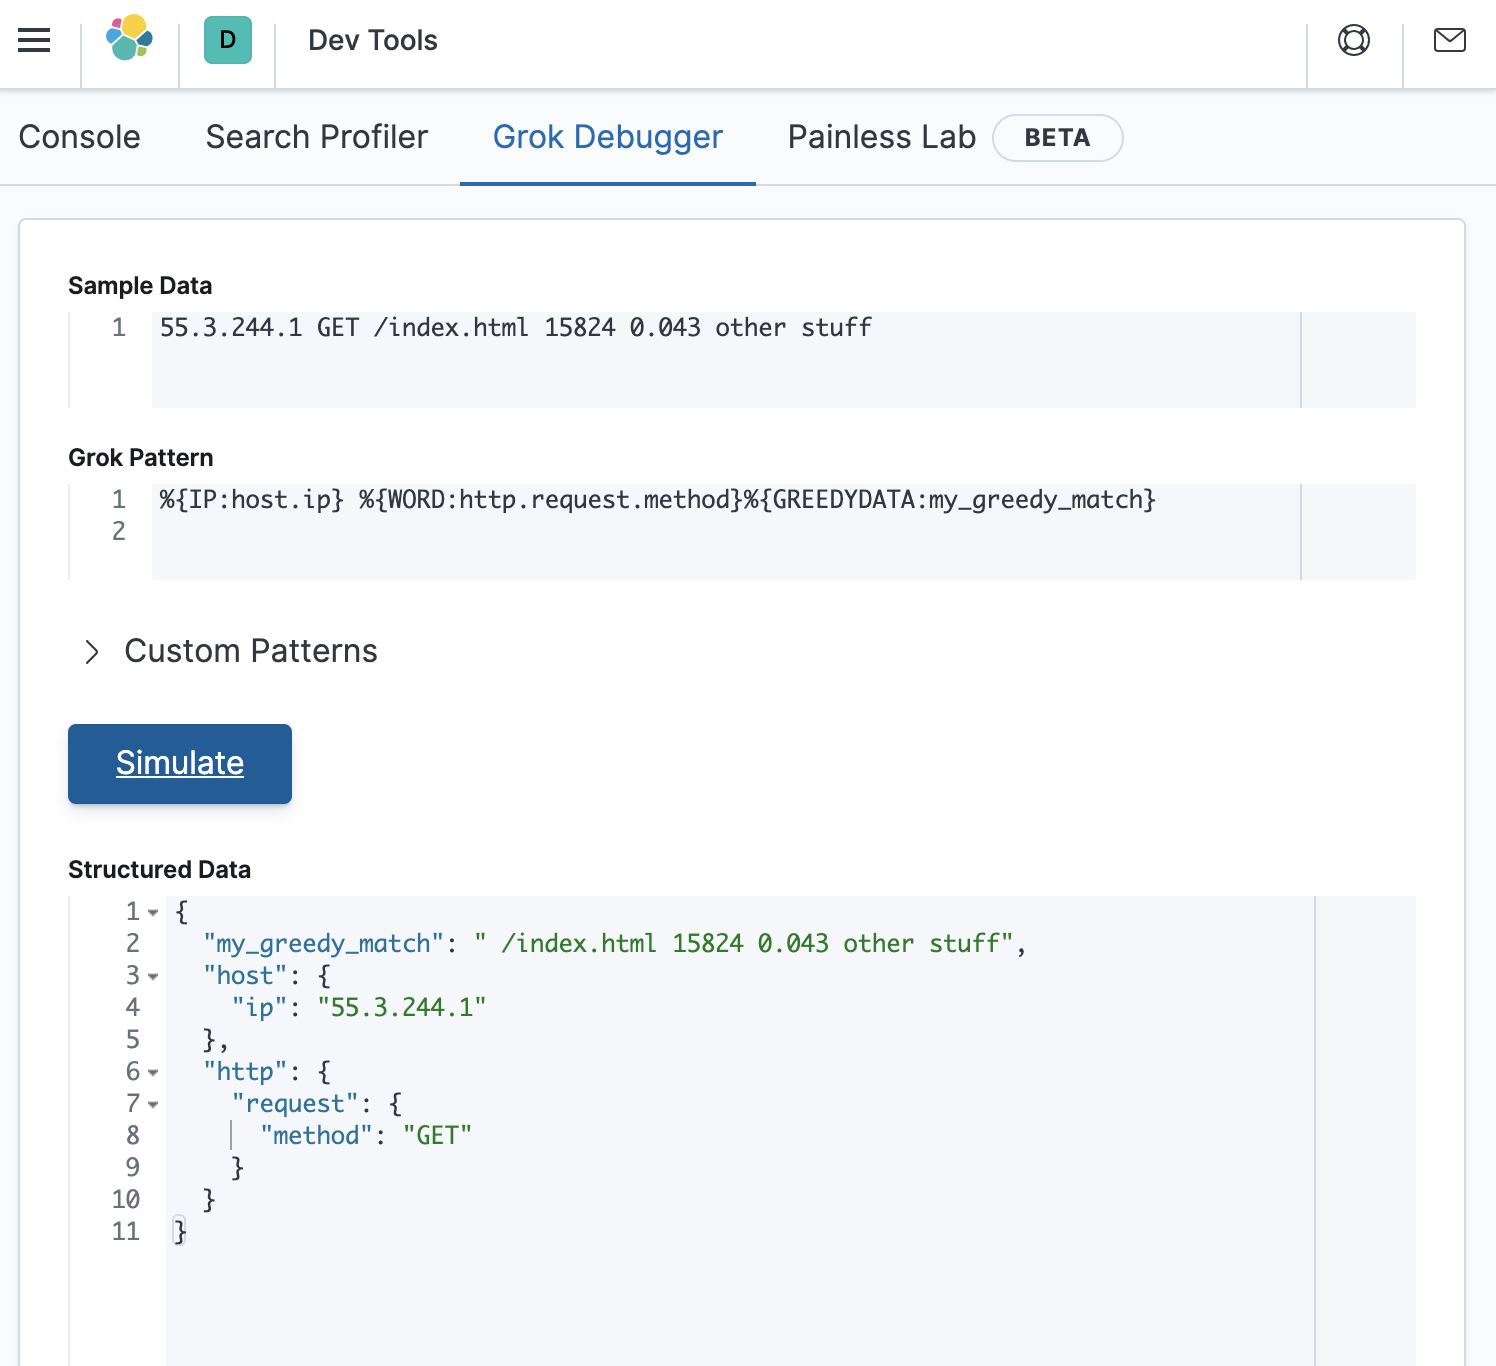
It worked! We have now extracted both the host.ip and the http.request.method fields.
Bringing it all together
We still have work to do to parse the remaining fields. We can continue to incrementally add to our grok pattern until we end up with the following grok pattern:
%{IP:host.ip} %{WORD:http.request.method} %{URIPATHPARAM:url.original} %{NUMBER:http.request.bytes:int} %{NUMBER:event.duration:double} %{GREEDYDATA:my_greedy_match}
We can test this in Kibana as follows:
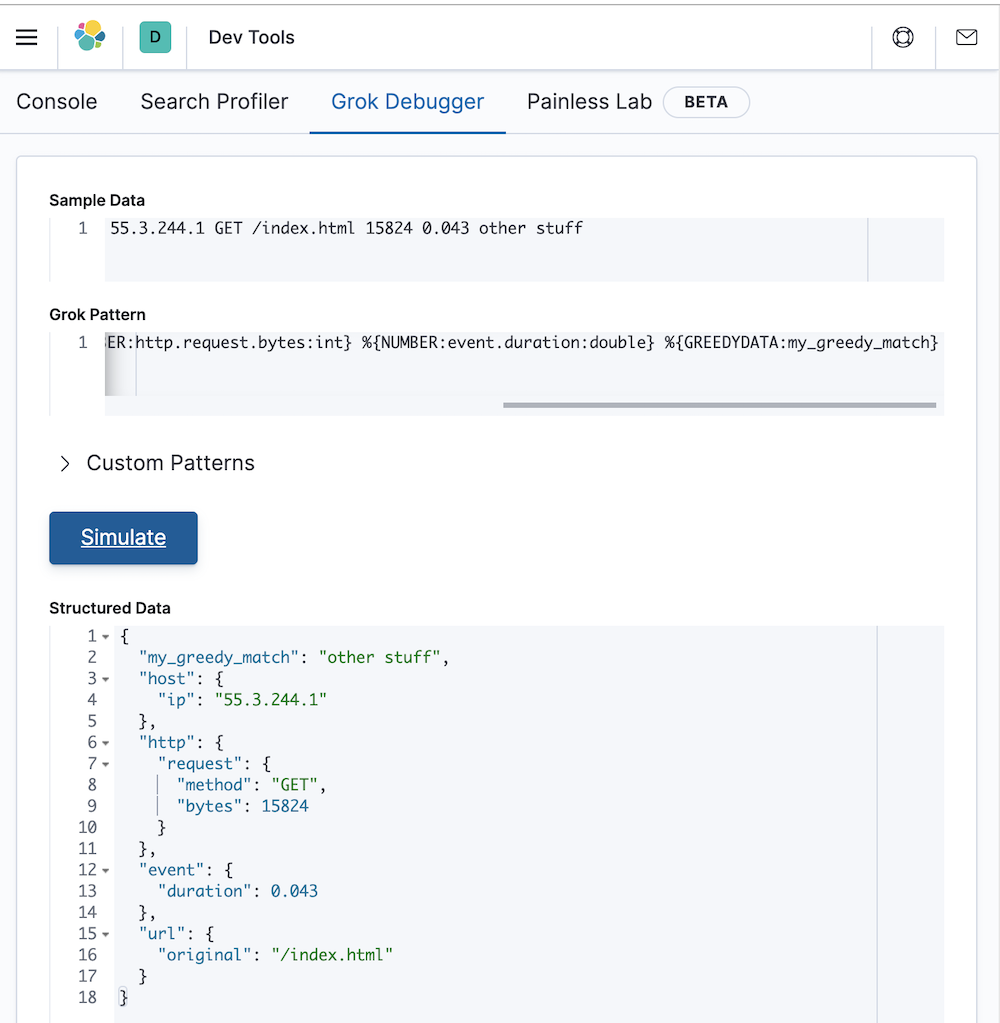
It works as expected! However, for this example we are not interested in keeping the my_greedy_match field around, and so we can remove this from our grok expression as follows:
%{IP:host.ip} %{WORD:http.request.method} %{URIPATHPARAM:url.original} %{NUMBER:http.request.bytes:int} %{NUMBER:event.duration:double} %{GREEDYDATA}
Which will look like the following in Kibana:
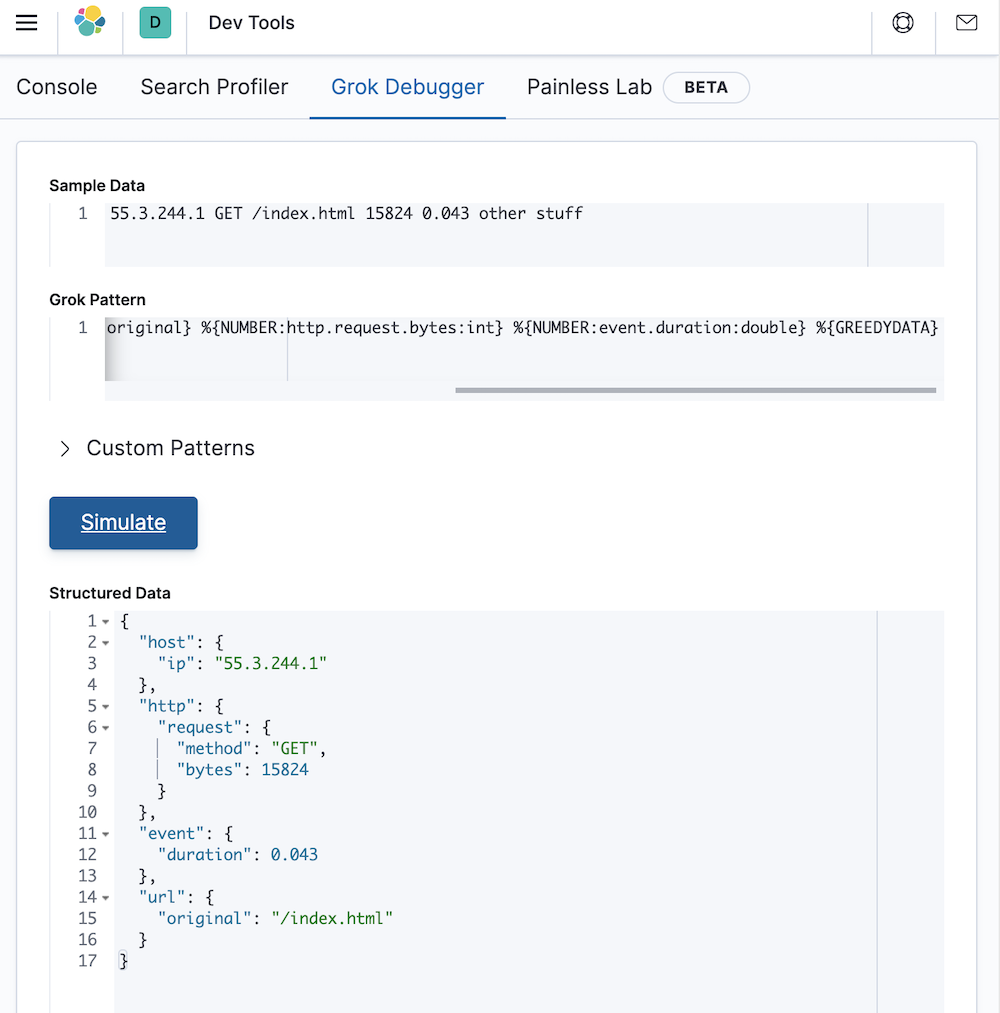
This looks exactly how we want it to look! We now have a grok pattern that we can use to structure the data that is contained in the message field.
Up next: Debugging your grok
Great! Now you’re grokking like a hurricane — well, like an incremental hurricane. But what happens when you run into an error in an existing grok expression? In our next post, we’ll explore debugging grok expressions.
This new knowledge (along with the ingest node documentation) should be enough for you to start creating your own custom ingest pipelines. So try it out locally, or spin up a 14-day free trial of Elastic Cloud and give it a whirl, on us.