Debugging broken grok expressions in Elasticsearch ingest processors
In two previous posts, we covered structuring data with grok and building custom grok patterns. But what happens if you just can’t get your grok patterns to work?
In this article, we’re going to use Kibana’s Grok Debugger to help us debug a broken grok pattern. The divide-and-conquer method described below should help you to quickly find the reason that a given grok pattern is not matching your data. Debugging your grok patterns and getting them to work correctly will allow you to structure your data, which will ensure that your observability and security use cases will run at peak performance.
Divide (your pattern) and conquer (your errors)
Let’s imagine that we are trying to parse a relatively long message, such as the following message, which is an entry from an Elasticsearch slow log:
[2020-05-14T20:39:29,644][INFO ][index.search.slowlog.fetch.S-OhddFHTc2h6w8NDzPzIw] [instance-0000000000] [kibana_sample_data_flights][0] took[3.7ms], took_millis[3], total_hits[416 hits], types[], stats[], search_type[QUERY_THEN_FETCH], total_shards[1], source[{"query":{"match":{"DestCountry":{"query":"AU","operator":"OR","prefix_length":0,"max_expansions":50,"fuzzy_transpositions":true,"lenient":false,"zero_terms_query":"NONE","auto_generate_synonyms_phrase_query":true,"boost":1.0}}}}], id[],
And let’s assume that we have found the following grok pattern on the internet, which we have been told should parse Elasticsearch slow logs, but for some reason it isn’t working!
\[%{TIMESTAMP_ISO8601:event.end}\]\[%{LOGLEVEL:log.level}\s*\]\[%{DATA:slowlog.type}\]\s*\[%{DATA:host.name}\]\s*\[%{DATA:slowlog.index}\]\s*\[%{DATA:slowlog.shard:int}]took\[%{DATA:slowlog.took}\],\stook_millis\[%{DATA:slowlog.took_millis:float}\],\stotal_hits\[%{DATA:slowlog.total_hits:int}\shits\]\,\stypes\[%{DATA:slowlog.types}\],\sstats\[%{DATA:slowlog.stats}\],\ssearch_type\[%{DATA:slowlog.search_type}\],\stotal_shards\[%{DATA:slowlog.total_shards:int}\],\ssource\[%{GREEDYDATA:slowlog.source}\],\sid\[%{DATA:slowlog.x-opaque-id}\]
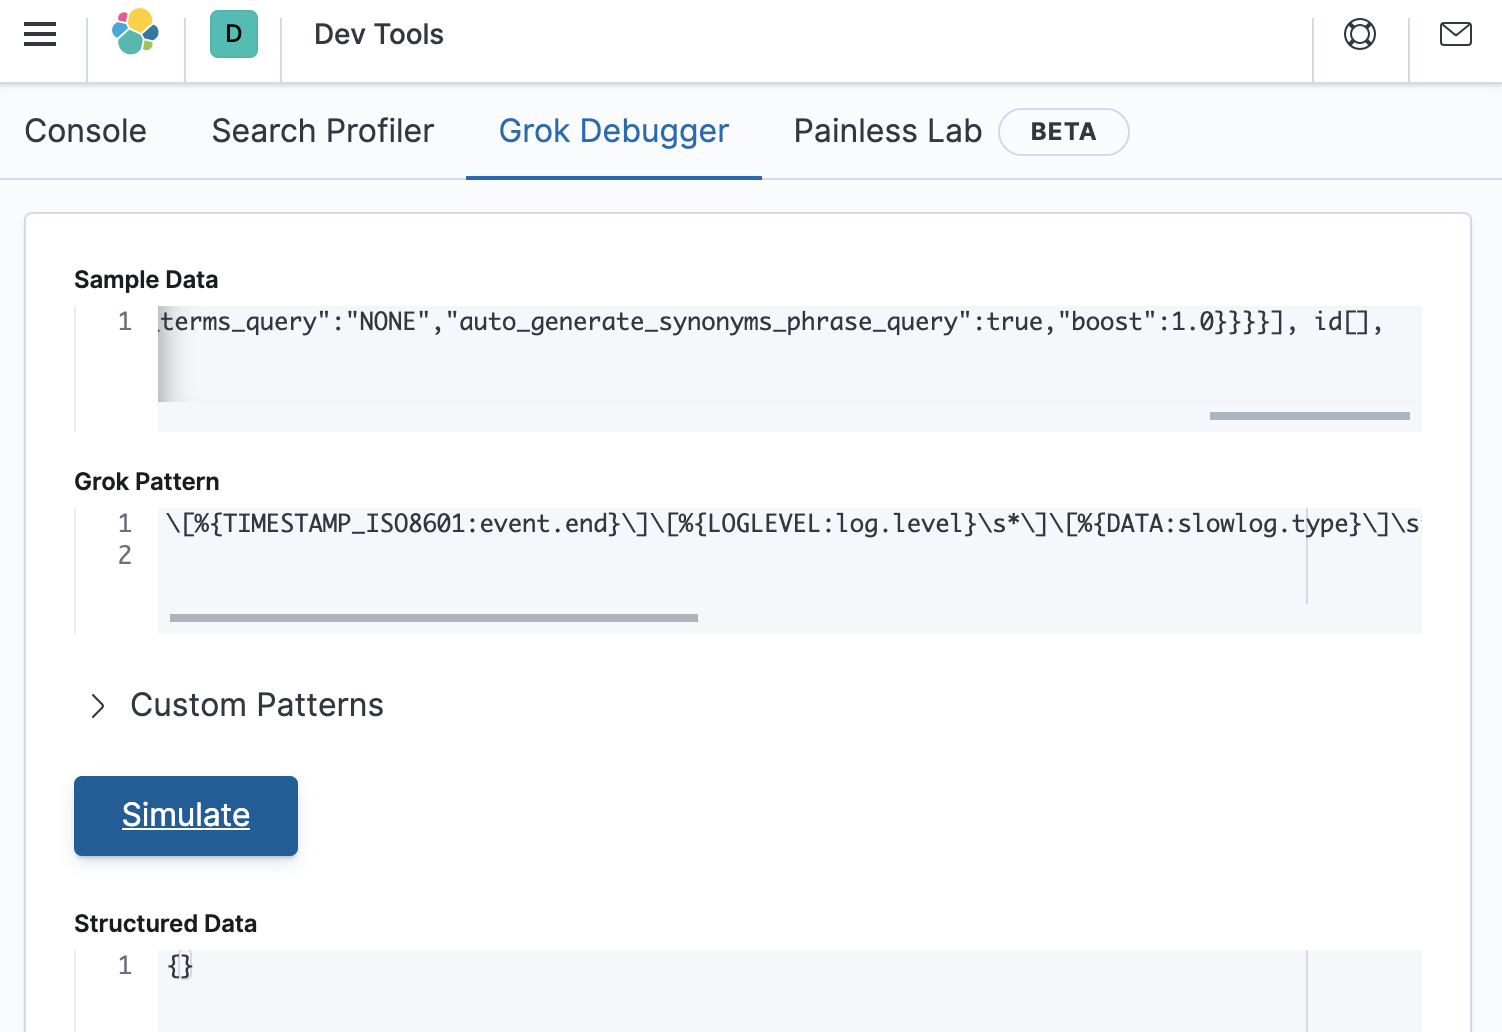
Looks like the internet made a promise it couldn’t keep. Luckily, we can use Grok Debugger to help to figure out where the error is. Within Kibana, go to Dev Tools > Grok Debugger, and then paste in the data and the grok pattern as shown below:
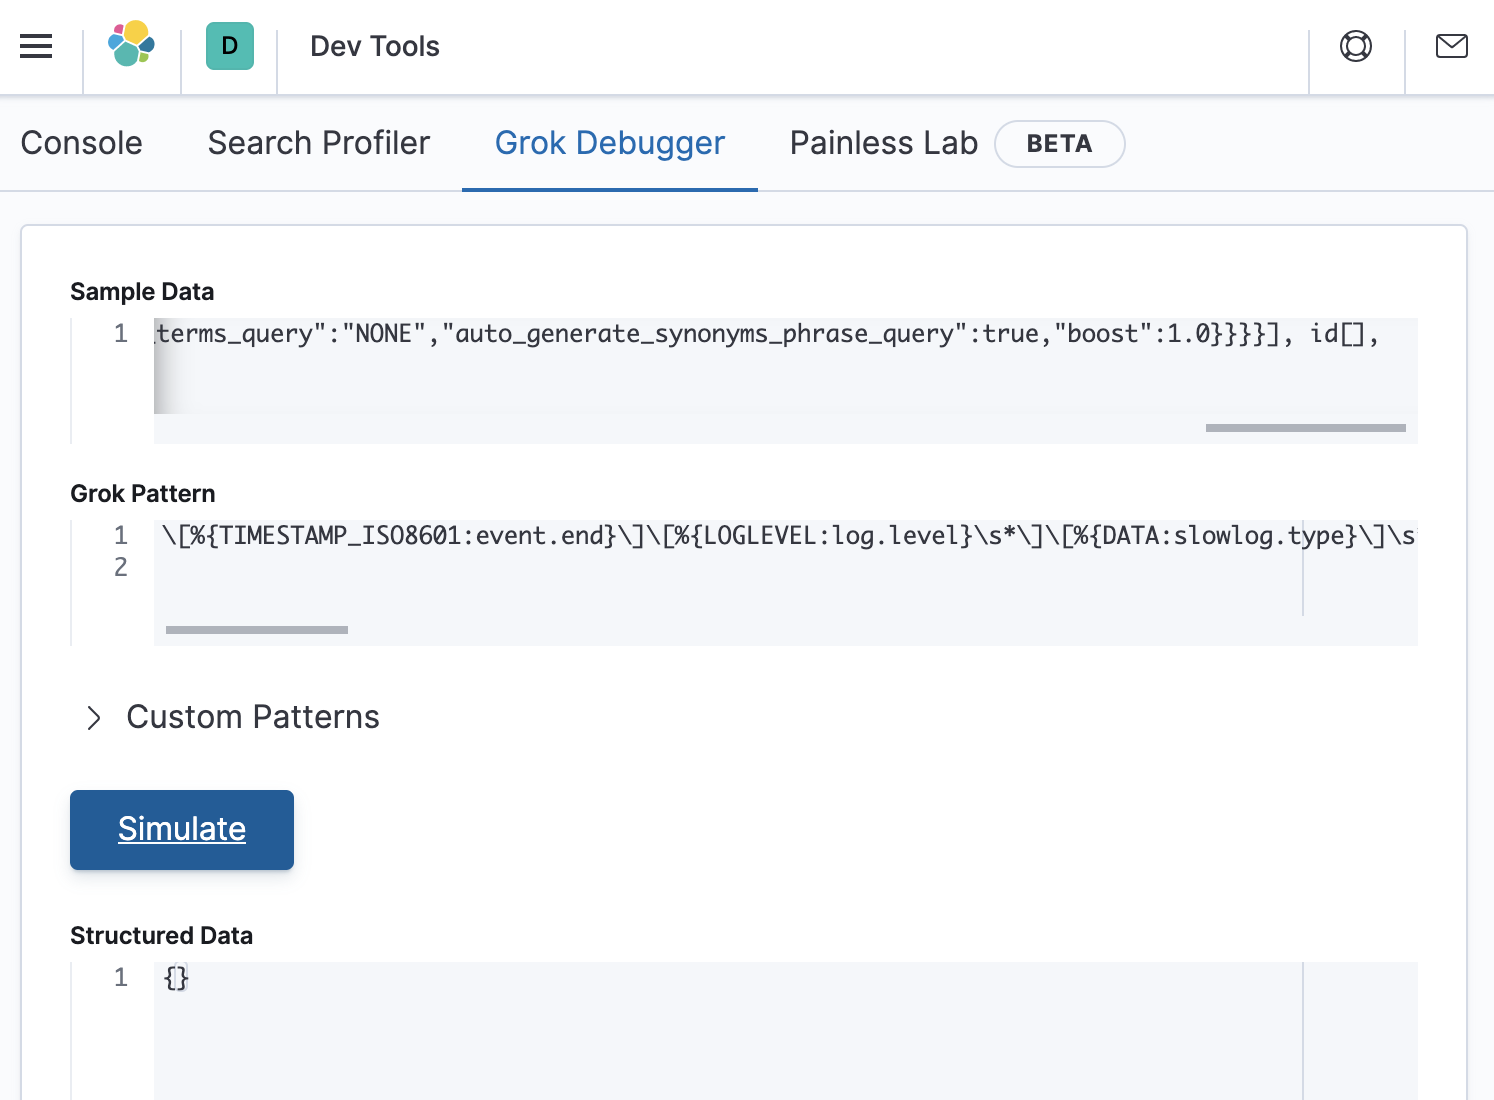
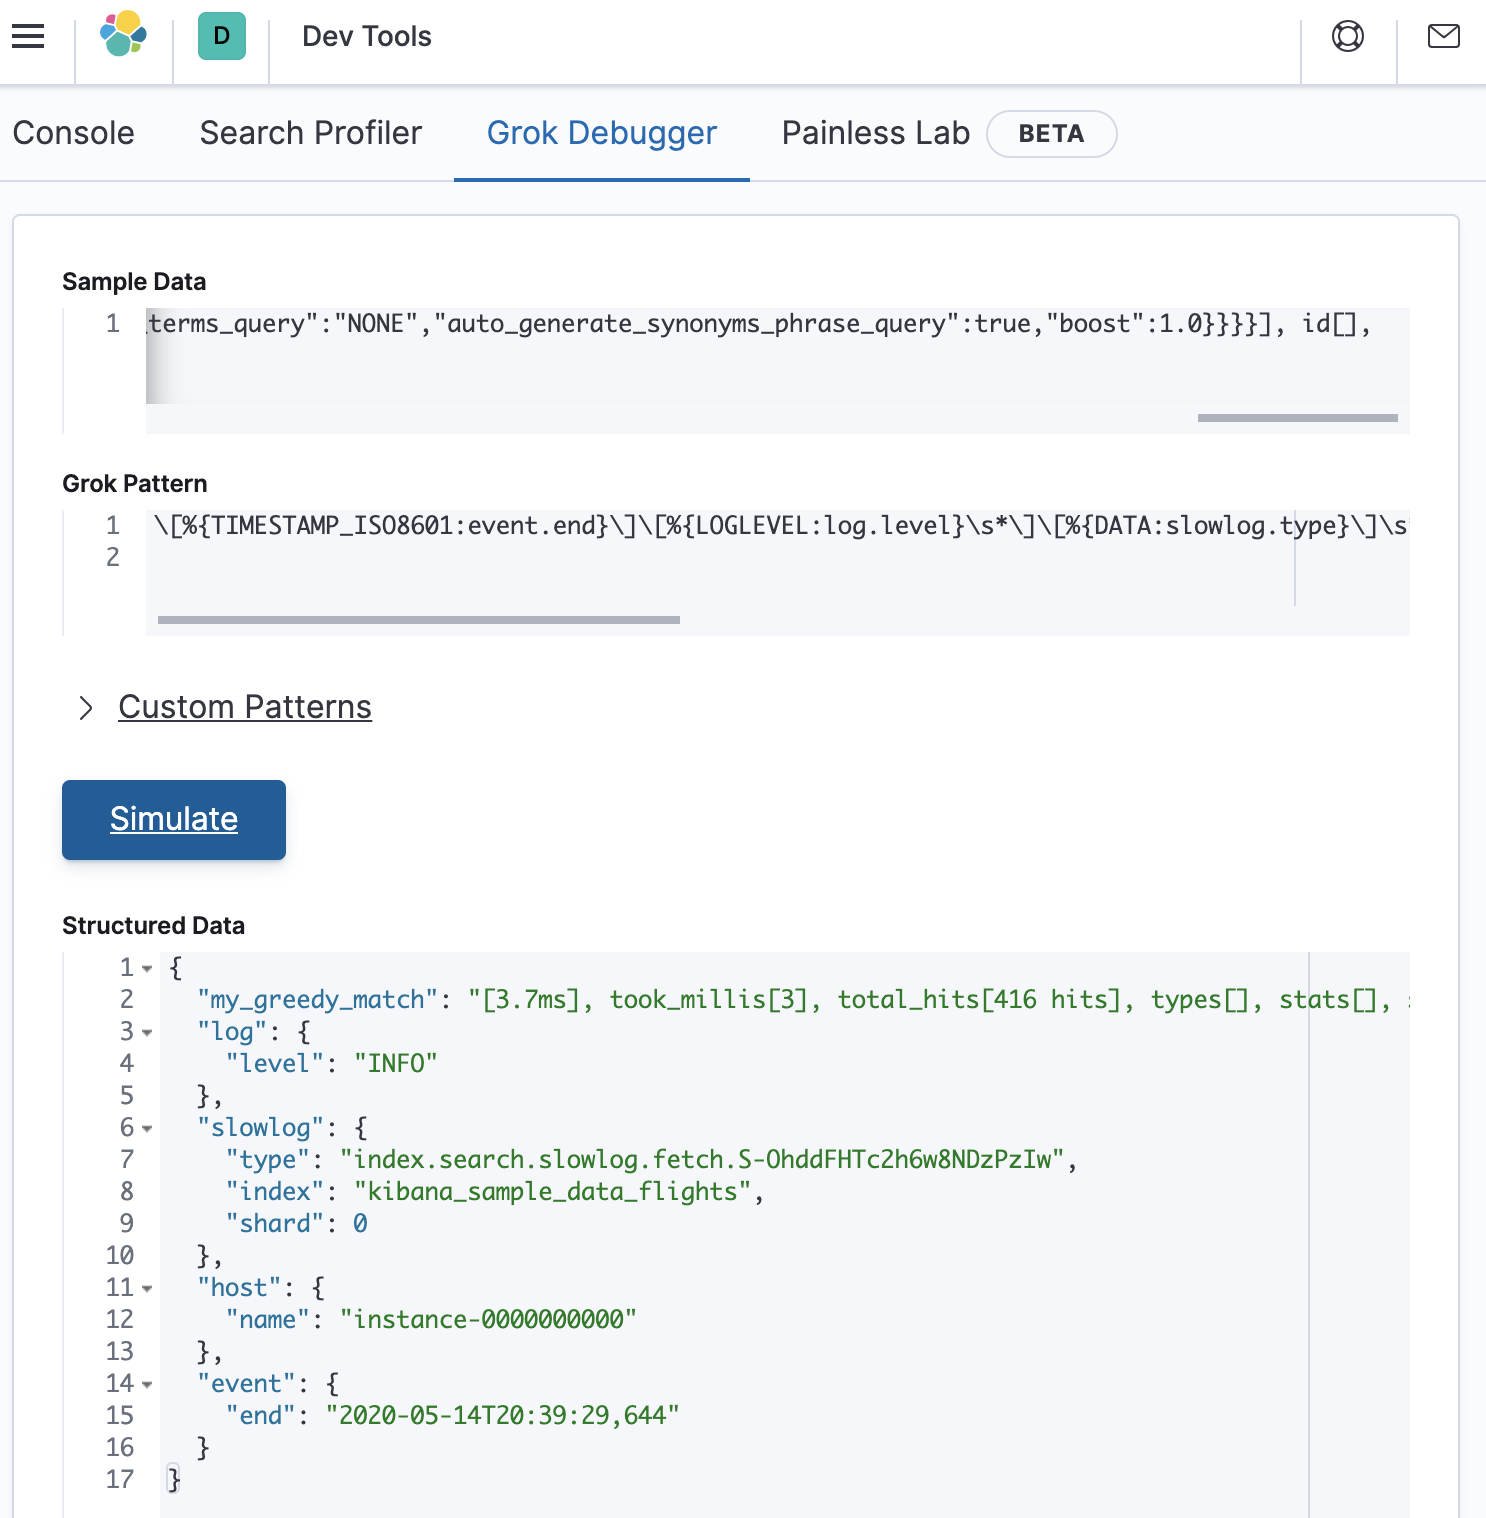
The structured data response is empty, which confirms that the grok pattern did not match the sample data. Let’s make sure that the Grok Debugger is working by defining a pattern that we know will match anything, and store the result in a field called my_greedy_match. This can be accomplished by defining a grok pattern as:
%{GREEDYDATA:my_greedy_match}.
This will result in an output that looks like the following:
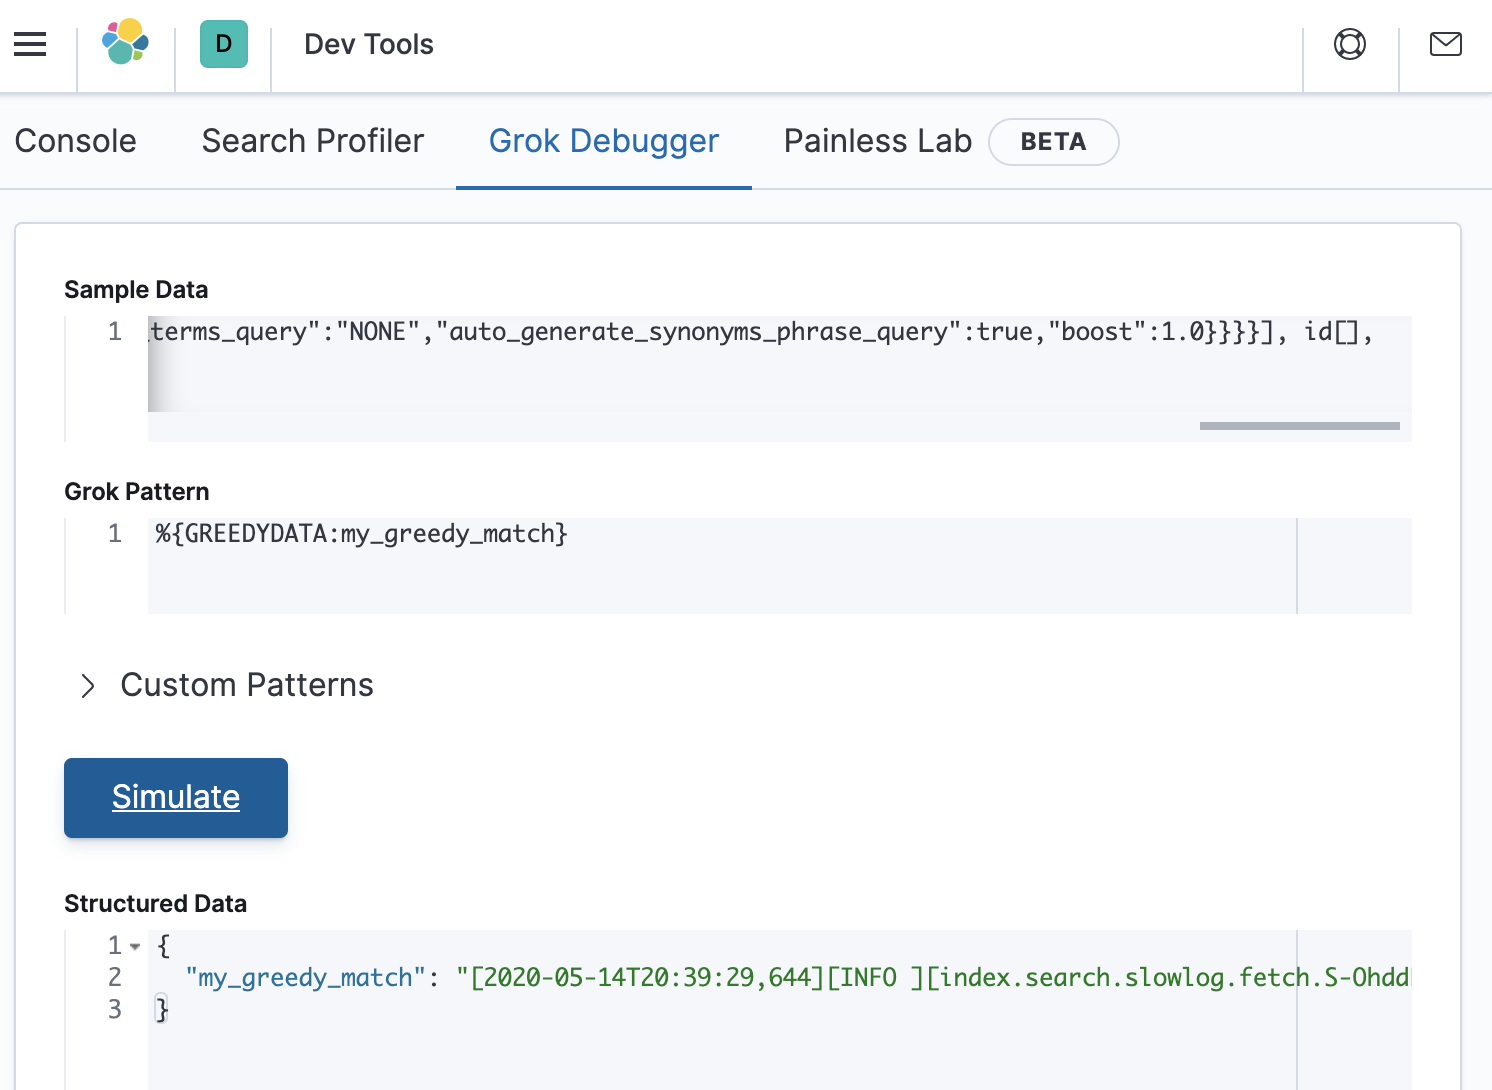
For this pattern, grok has stored the entire contents of the sample data into a field called my_greedy_match, which is what we expected for this test.
Next we start a divide-and-conquer approach to figure out where the error is in our grok pattern. We can do this by copying approximately the first half of the broken grok pattern into a new expression, and replacing the second half with the GREEDYDATA expression that we just saw. This new grok pattern would look as follows:
\[%{TIMESTAMP_ISO8601:event.end}\]\[%{LOGLEVEL:log.level}\s*\]\[%{DATA:slowlog.type}\]\s*\[%{DATA:host.name}\]\s*\[%{DATA:slowlog.index}\]\s*\[%{DATA:slowlog.shard:int}]took\[%{DATA:slowlog.took}\],\stook_millis\[%{DATA:slowlog.took_millis:float}\],%{GREEDYDATA:my_greedy_match}
After pasting this grok pattern into Grok Debugger, we see that the Structured Data response is still empty.
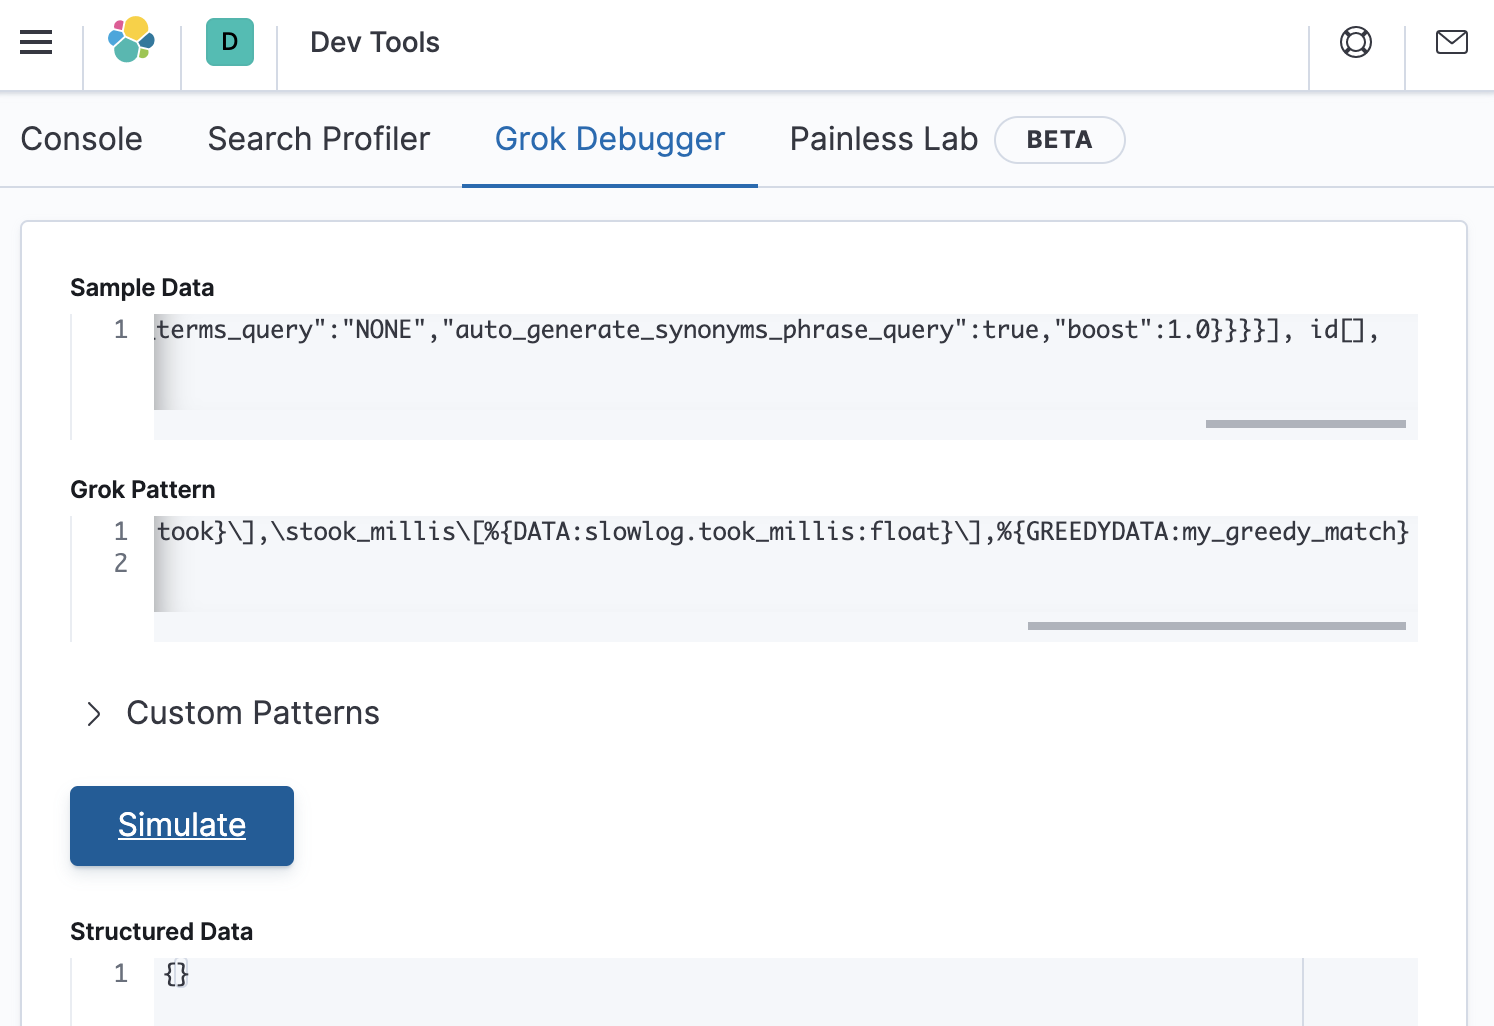
This means that the error is in the first half of the grok pattern. So let’s divide it in half again as follows:
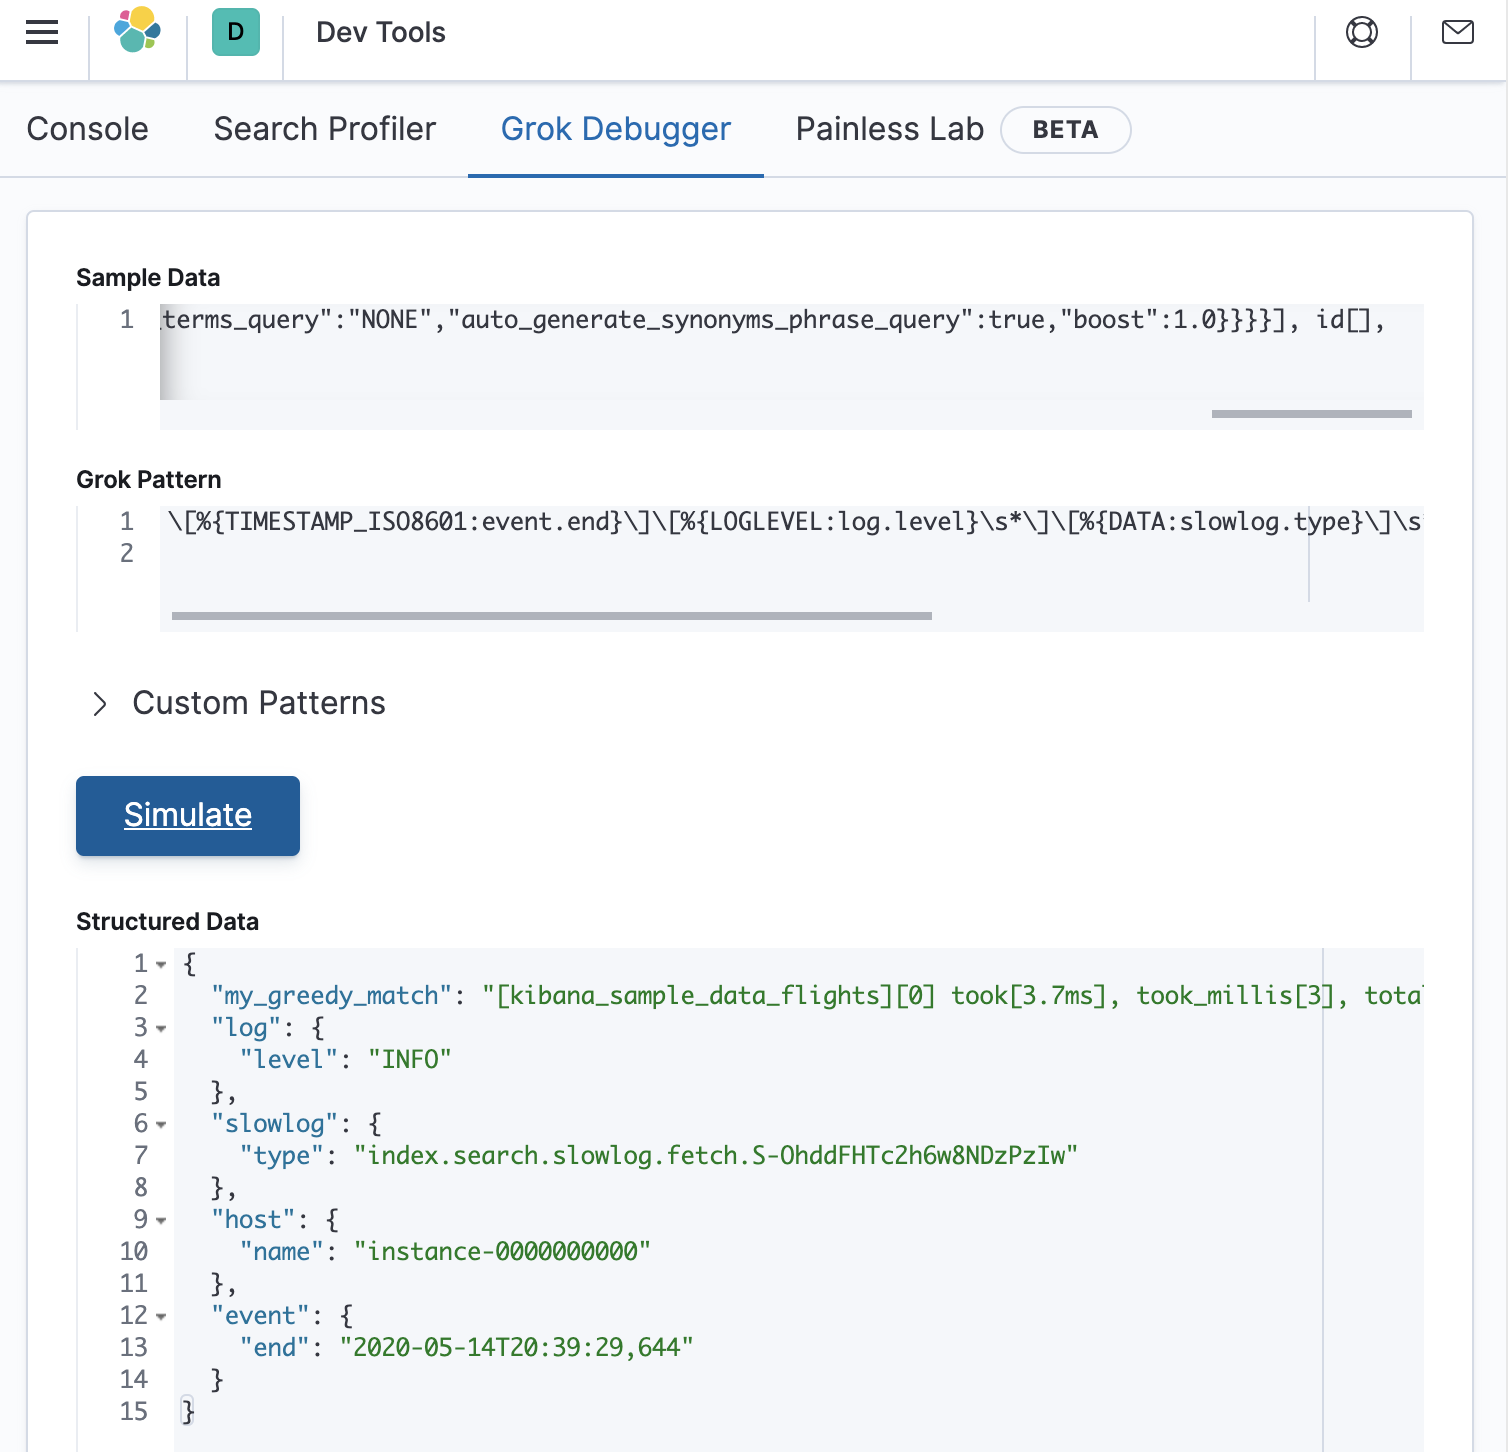
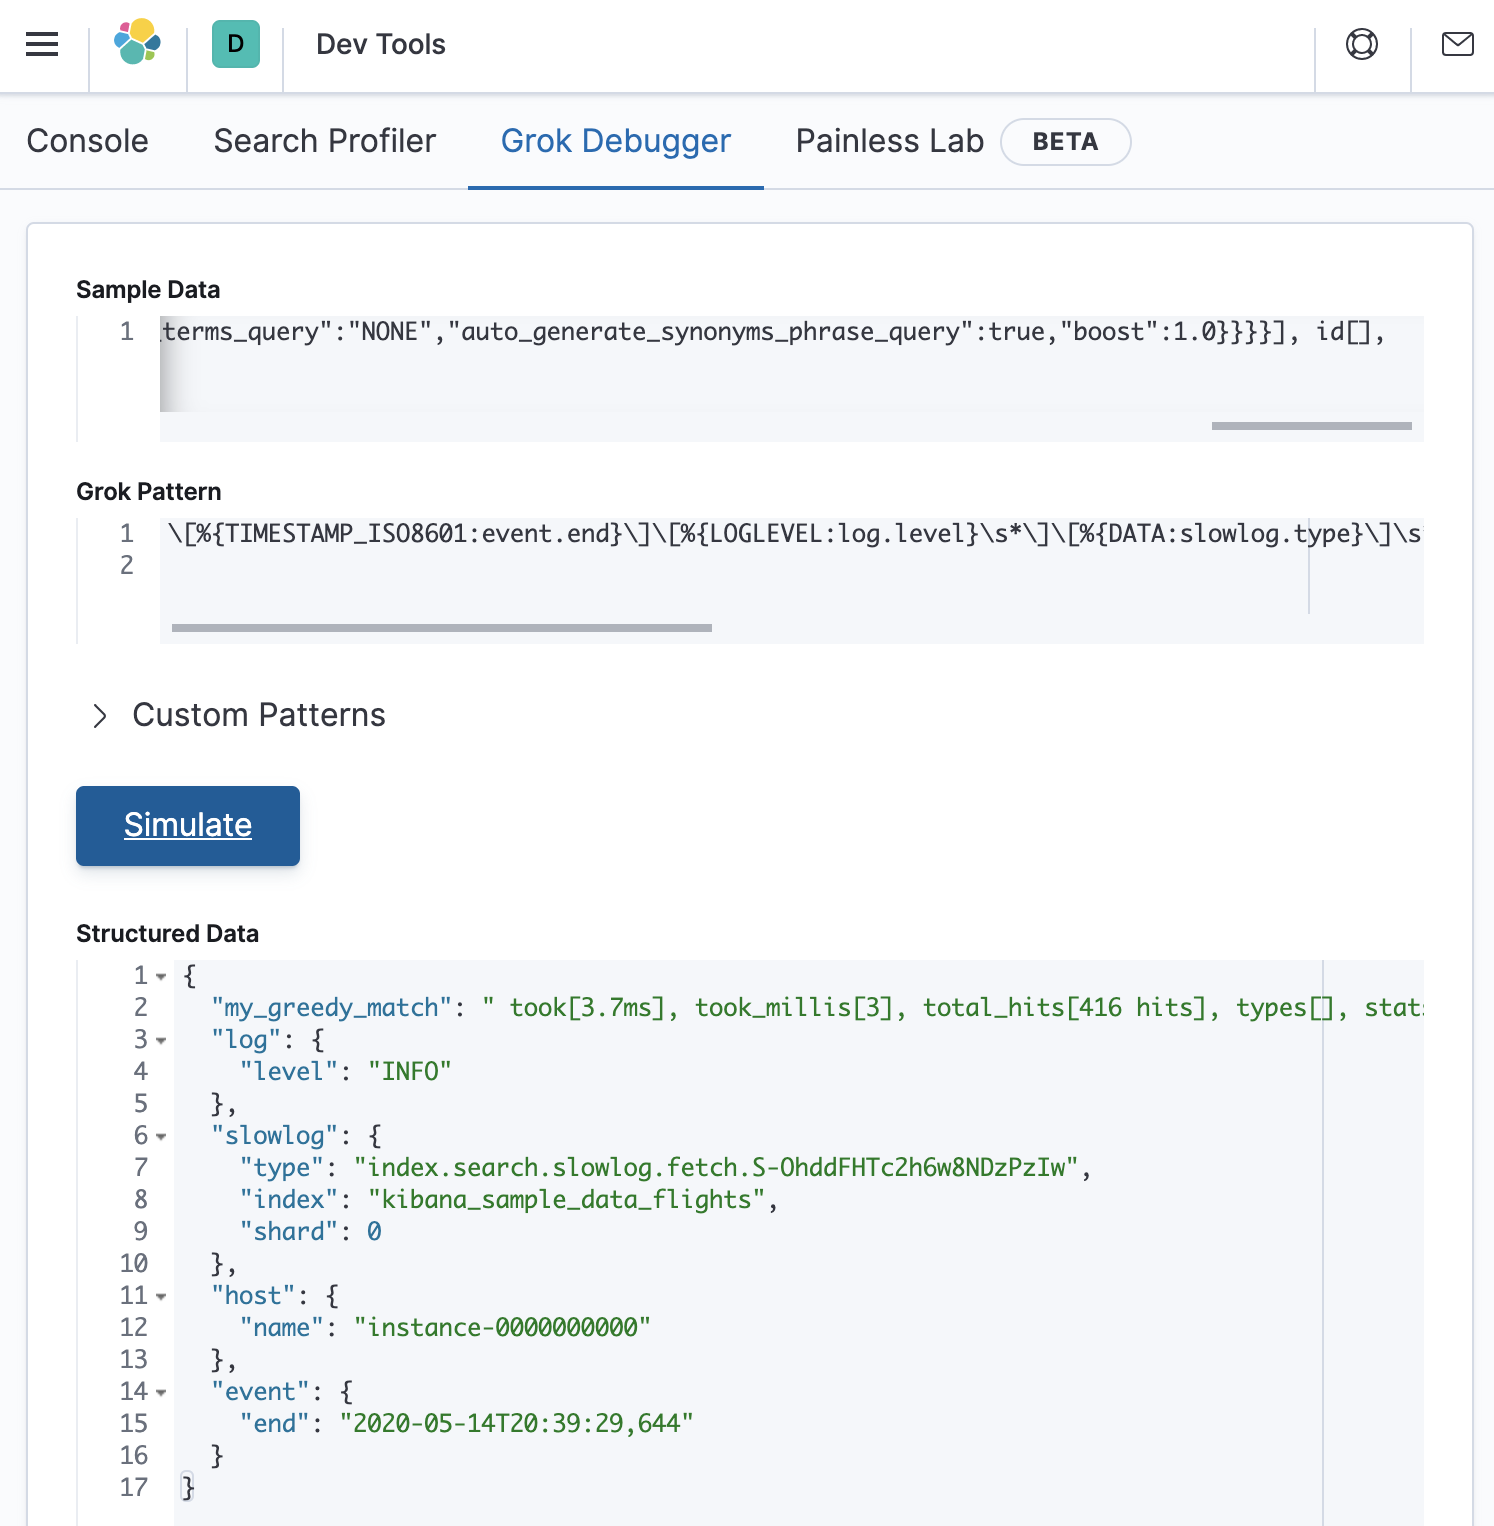
\[%{TIMESTAMP_ISO8601:event.end}\]\[%{LOGLEVEL:log.level}\s*\]\[%{DATA:slowlog.type}\]\s*\[%{DATA:host.name}\]\s*%{GREEDYDATA:my_greedy_match}
Pasting this into the debugger as follows shows that structured data has been correctly extracted:
Halfway there
We now know that there is not an error in the first quarter of the grok pattern, and that there is an error before the midpoint of the grok pattern. So let’s put the GREEDYDATA expression at approximately the three-eighths location of the original grok pattern, as follows:
\[%{TIMESTAMP_ISO8601:event.end}\]\[%{LOGLEVEL:log.level}\s*\]\[%{DATA:slowlog.type}\]\s*\[%{DATA:host.name}\]\s*\[%{DATA:slowlog.index}\]\s*\[%{DATA:slowlog.shard:int}]%{GREEDYDATA:my_greedy_match}
This will look as follows in the debugger (which is a match):
So we know that the error is somewhere between the three-eighths point and the midpoint of the grok pattern. Lets try adding back in a bit more of the original grok pattern as follows:
\[%{TIMESTAMP_ISO8601:event.end}\]\[%{LOGLEVEL:log.level}\s*\]\[%{DATA:slowlog.type}\]\s*\[%{DATA:host.name}\]\s*\[%{DATA:slowlog.index}\]\s*\[%{DATA:slowlog.shard:int}]took%{GREEDYDATA:my_greedy_match}
This returns an empty response as shown in the debugger below:
Almost there
There is something wrong after the extraction of the slowlog.shard.int value. If we re-examine the message that we are parsing, we will see that the took string should have a whitespace character in front of it. Lets modify the grok pattern to see if it works when we specify a whitespace in front of took, as follows:
\[%{TIMESTAMP_ISO8601:event.end}\]\[%{LOGLEVEL:log.level}\s*\]\[%{DATA:slowlog.type}\]\s*\[%{DATA:host.name}\]\s*\[%{DATA:slowlog.index}\]\s*\[%{DATA:slowlog.shard:int}]\stook%{GREEDYDATA:my_greedy_match}
It works, as shown below:
But we still have a bunch of data stored in my_greedy_match. Lets add back the remainder of the original grok pattern as follows:
\[%{TIMESTAMP_ISO8601:event.end}\]\[%{LOGLEVEL:log.level}\s*\]\[%{DATA:slowlog.type}\]\s*\[%{DATA:host.name}\]\s*\[%{DATA:slowlog.index}\]\s*\[%{DATA:slowlog.shard:int}]\stook\[%{DATA:slowlog.took}\],\stook_millis\[%{DATA:slowlog.took_millis:float}\],\stotal_hits\[%{DATA:slowlog.total_hits:int}\shits\]\,\stypes\[%{DATA:slowlog.types}\],\sstats\[%{DATA:slowlog.stats}\],\ssearch_type\[%{DATA:slowlog.search_type}\],\stotal_shards\[%{DATA:slowlog.total_shards:int}\],\ssource\[%{GREEDYDATA:slowlog.source}\],\sid\[%{DATA:slowlog.x-opaque-id}\]
And then paste the grok pattern into Grok Debugger as follows:
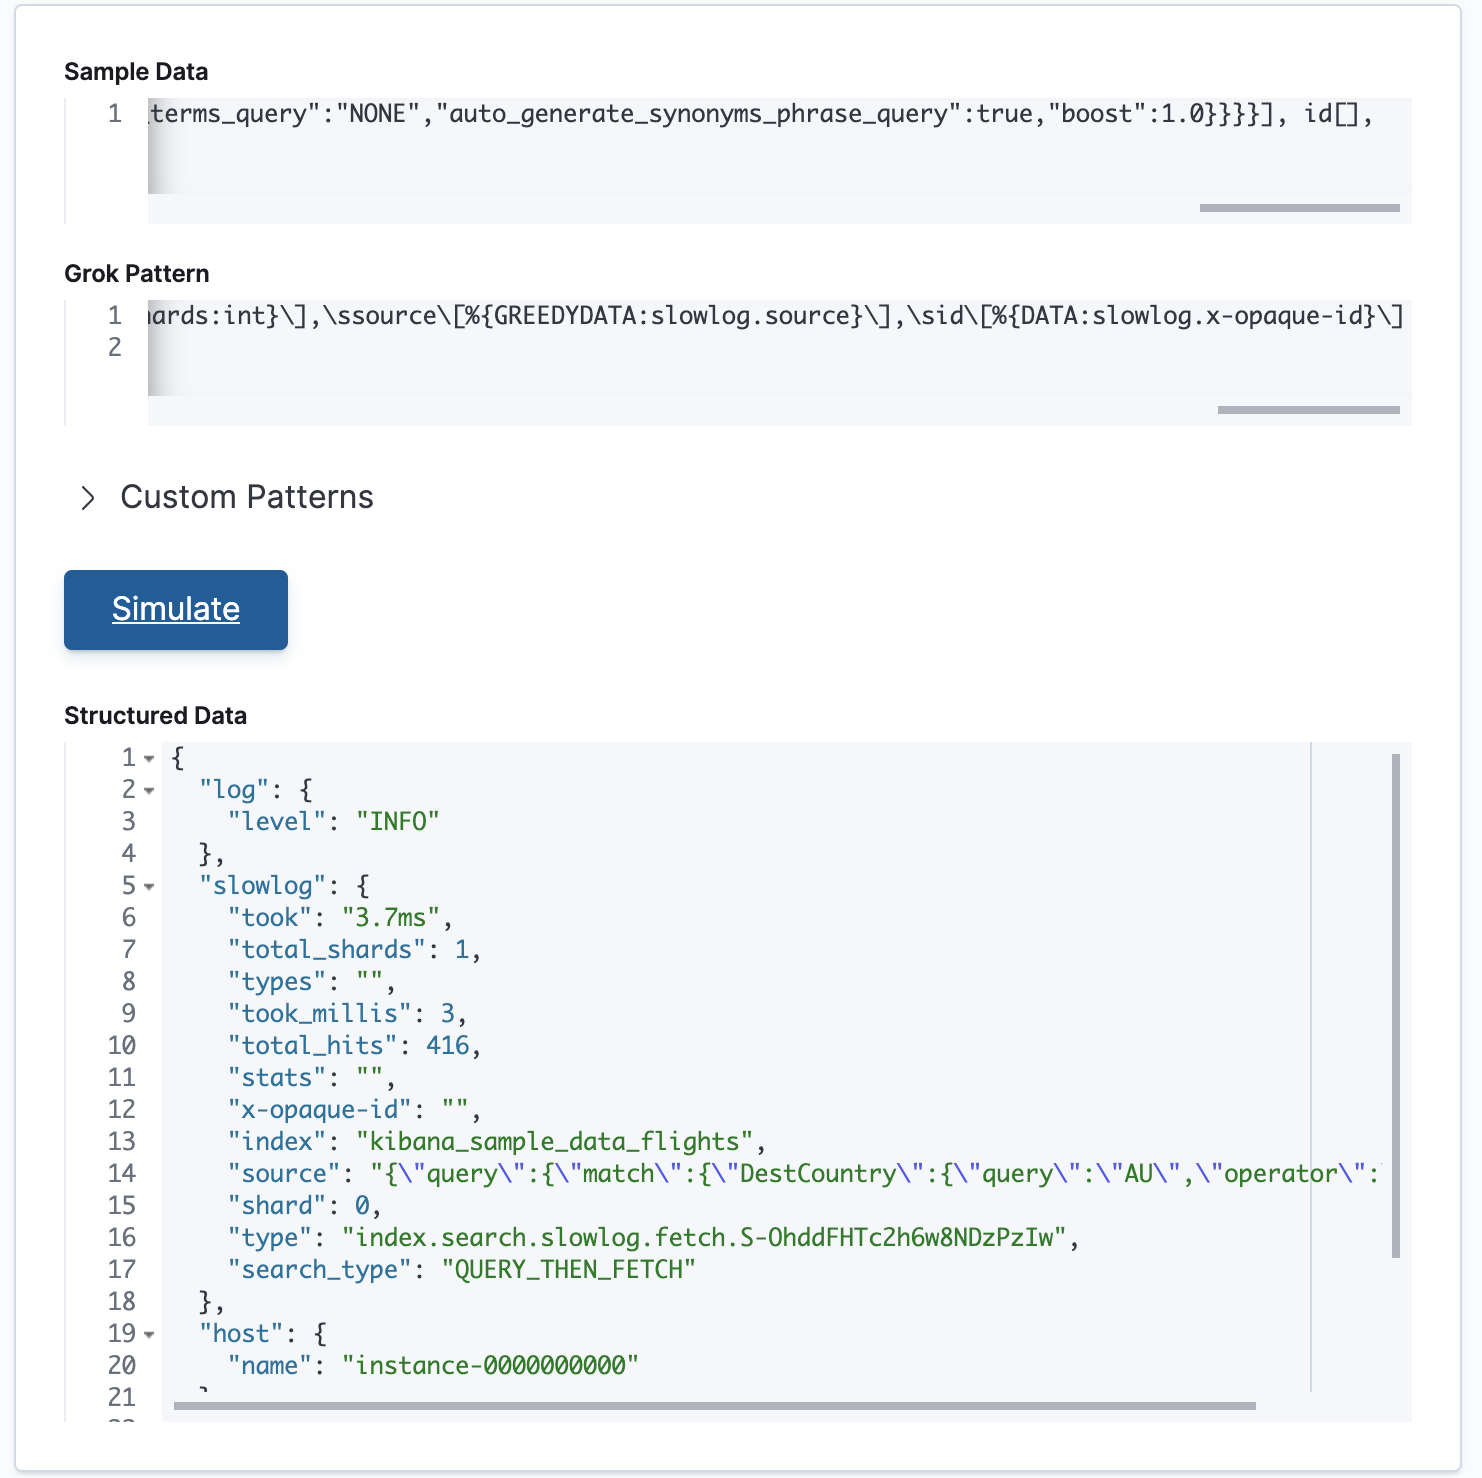
The grok pattern is working! We have now extracted structured data from the previously unstructured slowlog entry.
Publicly available grok patterns
Using basic grok patterns, you can build up complex patterns to match your data. Furthermore, the Elastic Stack ships with more than 120 reusable grok patterns. See ingest node grok patterns and Logstash grok patterns for the complete list of patterns.
Alternative to grok
In some cases it may be possible to use the Dissect Processor to extract structured fields out of a single text field. Similar to the Grok Processor, dissect also extracts structured fields out of a single text field within a document. However, unlike the Grok Processor, dissect does not use regular expressions. This allows dissect’s syntax to be simple and it may be faster than the Grok Processor.
That’s a wrap (for now)
In the past three blog posts, you learned how grok can be used for extracting structured fields from unstructured data, how to incrementally construct new patterns, and how to debug patterns that aren’t working. You now have a solid foundation for building patterns to parse and structure your data exactly the way you need to. So try it out for yourself in your existing deployments, or spin up a 14-day free trial of Elastic Cloud.
As always, if you run into any issues with your patterns, you can always reach out in our forums.