Monitoring Kubernetes and Docker Containers with Beats: Logs, Metrics, and Metadata
This blog is about monitoring a container environment — which could include Google Kubernetes Engine (GKE), IBM Cloud Kubernetes Service, and any other Kubernetes (k8s) and Docker environments. For the purposes of this blog, though, I am using the IBM Cloud Kubernetes Service.
You might be wondering why I am writing about monitoring Kubernetes and Docker containers. Surely the cloud providers are managing the infrastructure and I can just worry about my app, right? You might be right, but I am the kind of person who checks Yelp reviews even if I have received personal recommendations, and the more information I have, the better. I want all the logs and metrics from my app and its environment available, and I want to be able to search, visualize, and alert on them all together. That typical container monitoring is great, but I am also going to show you a cool way to use Kubernetes events and metadata to annotate my app performance chart with notifications about scaling or rolling updates.
Allow me to define a couple terms before I go on.
- Log: A timestamp and a message. This would include typical log entries like “NGINX started at 13:42” and it would include k8s events like “There was an NGINX container with a Back-off restarting failed container at 16:20.”
- Metric: A numeric measurement collected at a fixed time period. This could be “Sales through the eCommerce site were $50,000 over the past ten minutes” or “CPU utilization was 17% from 14:00:00 to 14:00:10.”
App Deployment in a Kubernetes Cluster
For my example, I'm going to use this application based on Apache HTTP Server, PHP, and Redis.
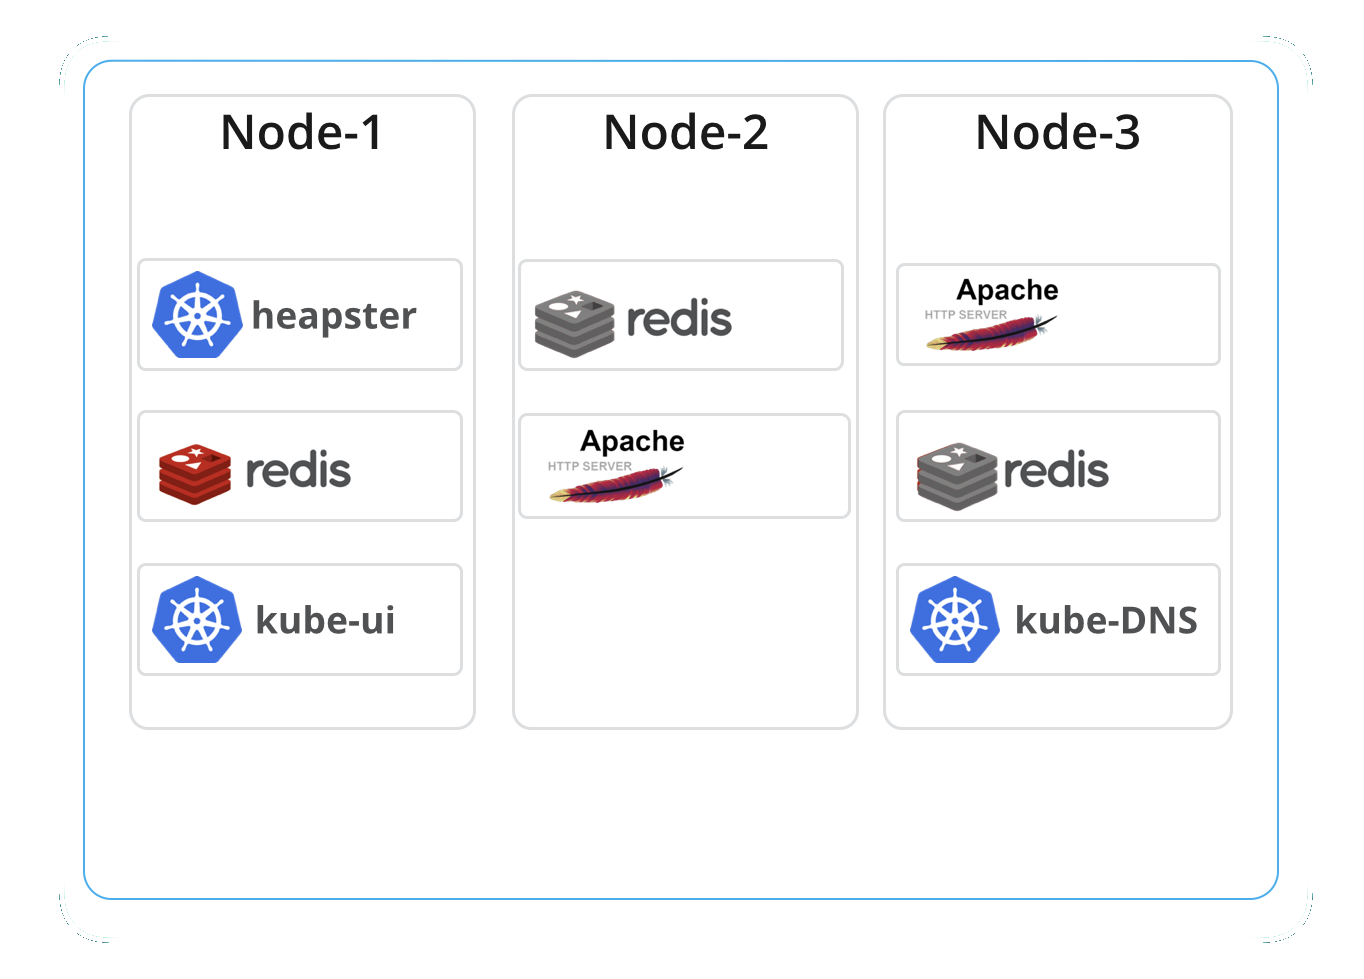
Additionally, to monitor the application and container infrastructure we have:
- A hosted Elasticsearch Service deployment in Elastic Cloud.
- Beats, the lightweight shippers for logs and metrics deployed as a DaemonSet in the same Kubernetes cluster. Note that this can replace fluentd that is typically deployed in a Kubernetes cluster.
Logs and Metrics
The above application is just a part of an ecosystem that's constantly generating useful information that we should be capturing. These are the levels that we collect those logs and metrics from:
- Orchestration (Kubernetes)
- Hosts
- Application
- Container (Docker)
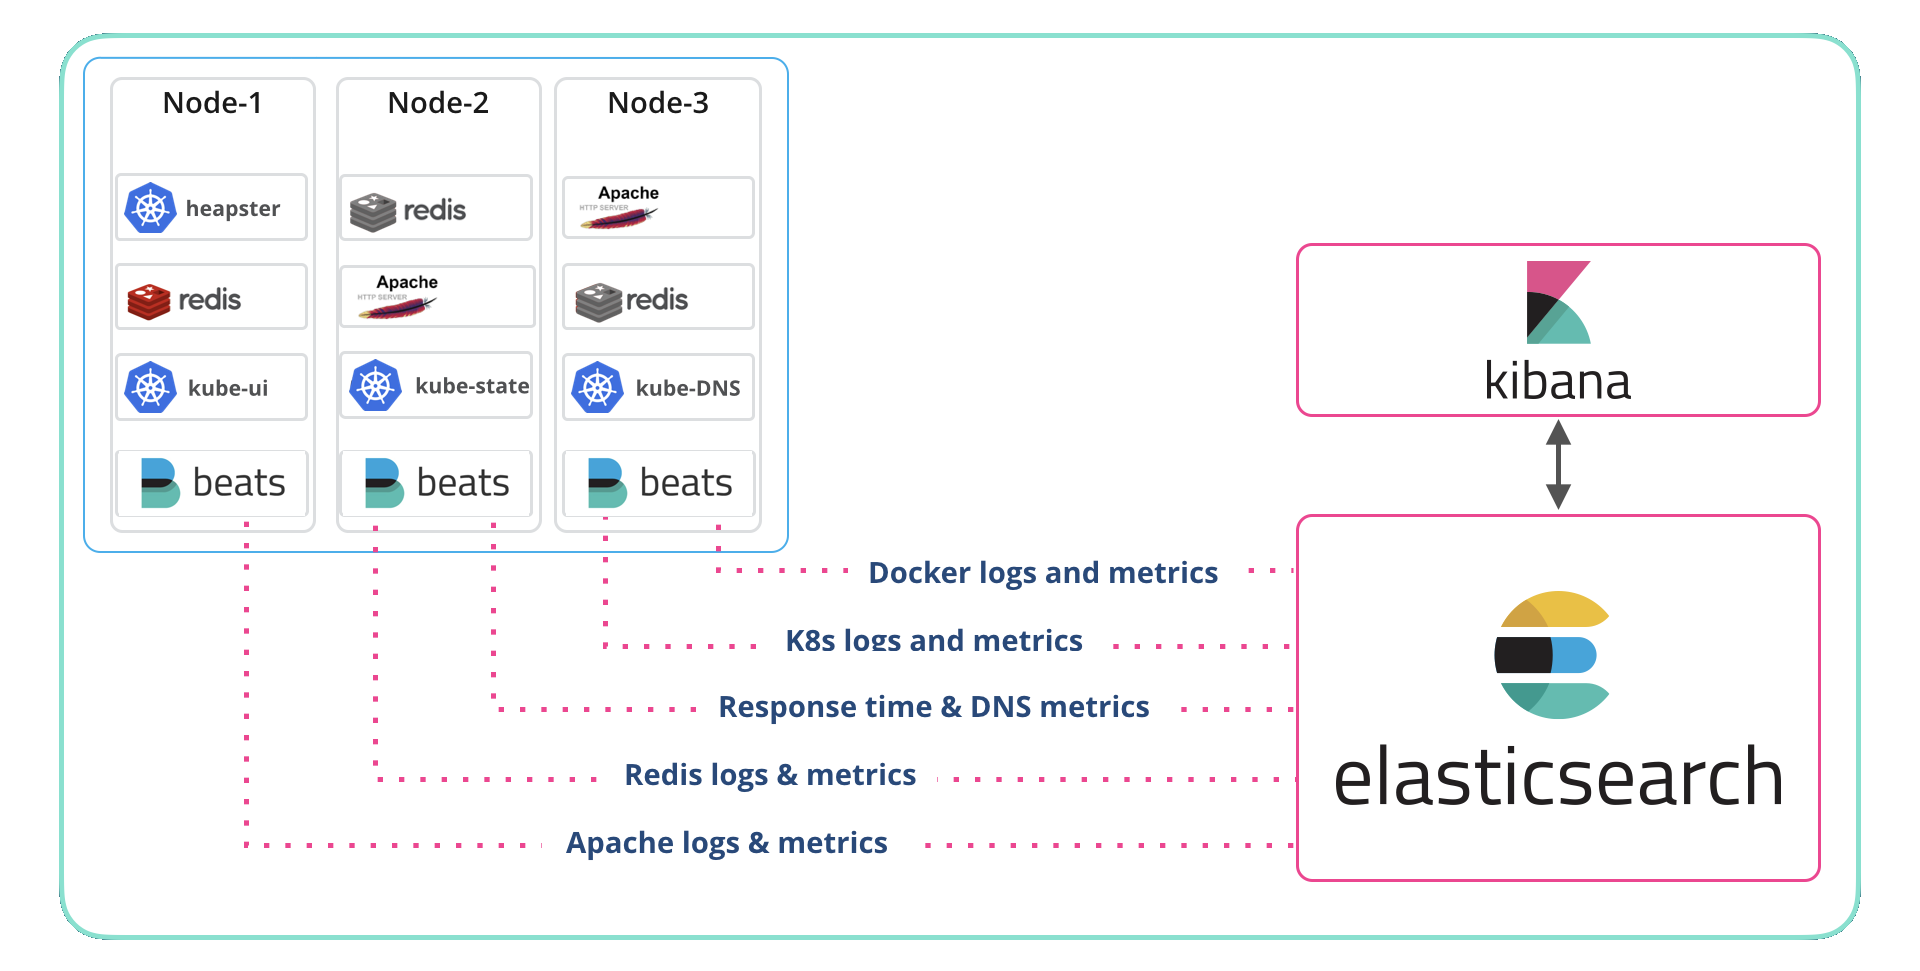
To collect the data, we use Beats (Filebeat, Metricbeat, and Packetbeat) and the System, Kubernetes, and Docker modules along with modules for the application (Apache and Redis). We deployed a DaemonSet for each Beat and let Kubernetes manage them. If that sounds like a long list, don’t panic as Beats autodiscover keeps it simple. The details on deploying the Beats to monitor an application are in this blog and the accompanying video. In fact, if you want to start at the beginning check out the container monitoring page at Elastic.
To index, store, search, analyze, and visualize the data, I used the hosted Elasticsearch Service. Deploying Elasticsearch Service in Elastic Cloud is detailed on our getting started page, as is deploying Elasticsearch and Kibana on a system that you manage yourself. Either way, it works just fine.
I mentioned Beats and modules, and those deserve a better introduction. A Beat is a lightweight agent that sends data to Elasticsearch or Logstash. Sometimes Beats are deployed where the data originates, like on a physical or virtual system, and sometimes they are deployed alongside the sources, for example, as a DaemonSet (which is what I did here). Modules simplify the collection, parsing, indexing, and visualization of common log formats.
That sounded a little boring, let me say it this way: Elastic modules are pre-packaged experience. Let’s say that you know everything about managing Apache HTTPD Server, but NGINX is new to you. You might go to someone who knows NGINX and ask “What do you look out for in the logs? What metrics do you keep an eye on? Can you give me the greps from your history file?” The answers to those questions define Beat modules to me; pre-packaged dashboards, saved searches, parsing, and collection for a bunch of things like Kubernetes, Docker, NGINX, Apache, operating systems, databases, etc. In my experience, this is a very powerful set of capabilities.
The k8s module collects metrics related to pods, nodes, volumes, ReplicaSets, deployments, etc. Each metric has a rich set of metadata attached to it so that you can tie the data to your app. For example, you might not care that pod xyz is close to the limit on memory use, but if that metric shows up as being associated with the frontend of your app then you know the value to your business. It also collects events (recall that I included Kubernetes events in the log definition above) which we will use to enrich a performance chart in the video down below.
The Docker module collects metrics related to containers, hosts, memory, network, healthchecks, etc. Like the Kubernetes module, the metadata is very valuable to understanding the performance of your app and the environment.
There are many other modules for Filebeat and Metricbeat. Additionally, Packetbeat ships with many dashboards for services like Cassandra, Flows, HTTP, MySQL, MongoDB, etc.
Watch and see how easy it is to turn data into actionable intelligence. The video features:
- Visualizing Kubernetes events with app performance metrics
- Diving into the Metricbeat Kubernetes module event metricset
- Navigating the Kubernetes events and build the custom visualization