Monitoring Java applications with Elastic: Multiservice traces and correlated logs
In this two-part blog post, we’ll use Elastic Observability to monitor a sample Java application. In the first blog post, we started by looking at how Elastic Observability monitors Java applications. We built and instrumented a sample Java Spring application composed of a data-access microservice supported by a MySQL backend. In this part, we’ll use Java ECS logging and APM log correlation to link transactions with their logs. Then we’ll add a second microservice so we can generate multiservice traces and correlated logs. Finally, we’ll use Kibana apps including APM, Visualize, and Machine Learning to explore and analyze the logs, metrics, and traces we have collected. To follow the steps in this post, make sure you have read and completed all of the steps in the first post.
Using ECS logging and APM log correlation
Let’s correlate the logs generated by our Java application with the transactions observed by the Java Agent. The easiest and best way to do this is to start by using Java ECS logging in the application. The logs generated in this manner will be structured as JSON objects and will use Elastic Common Schema (ECS)-compliant field names.
In our sample application, we’ll configure Logback, the default logger for Spring, to use Java ECS logging as follows. First we need to add a dependency to logback-ecs-encoder in mysql-service. Add the following dependency to pom.xml:
<dependency>
    <groupId>co.elastic.logging</groupId>
    <artifactId>logback-ecs-encoder</artifactId>
    <version>0.4.0</version>
</dependency>
We also need to add a configuration file for Logback, so we will create a new file called logback-spring.xml in src/main/resources with the following contents:
<?xml version="1.0" encoding="UTF-8"?>
<configuration>
    <property name="LOG_FILE" value="${LOG_FILE:-${LOG_PATH:-${LOG_TEMP:-${java.io.tmpdir:-/tmp}}}/spring.log}"/>
    <include resource="org/springframework/boot/logging/logback/defaults.xml"/>
    <include resource="org/springframework/boot/logging/logback/console-appender.xml" />
    <include resource="org/springframework/boot/logging/logback/file-appender.xml" />
    <include resource="co/elastic/logging/logback/boot/ecs-file-appender.xml" />
    <root level="INFO">
        <appender-ref ref="CONSOLE"/>
        <appender-ref ref="ECS_JSON_FILE"/>
        <appender-ref ref="FILE"/>
    </root>
</configuration>
Finally, we need to specify the location of the logs by adding the following line to application.properties in src/main/resources:
logging.file.name=<PATH_TO_YOUR_LOGS>/mysqlservice/mysqlservice.log
Adjust the log location based on your own environment.
Rebuild the application as usual using Maven and run it again. You will now see two log files in the location you specified. If you inspect the file mysqlservice.log.json you will see that the log entries are JSON objects such as:
{
  "@timestamp": "2020-09-06T03:14:20.223Z",
  "log.level": "INFO",
  "message": "Bootstrapping Spring Data JPA repositories in DEFERRED mode.",
  "service.name": "spring-boot-application",
  "event.dataset": "spring-boot-application.log",
  "process.thread.name": "main",
  "log.logger": "org.springframework.data.repository.config.RepositoryConfigurationDelegate"
}
To correlate these logs with the transactions they belong to, all we have to do is enable log correlation when starting the application. So, stop the application and restart it using:
java -javaagent:../agent/elastic-apm-agent-1.17.0.jar \
-Delastic.apm.service_name=mysqlservice \
-Delastic.apm.server_urls=<YOUR_SERVER_URL> \
-Delastic.apm.secret_token=<YOUR_SECRET_TOKEN> \
-Delastic.apm.application_packages=com.example \
-Delastic.apm.enable_log_correlation=true \
-jar target/mysql-service-0.0.1-SNAPSHOT.jar
Now, to test it, generate an error by calling the service using an unsupported method:
curl -XPOST "http://localhost:8080/friend/all"
Inspect the log file again and you will see that a transaction.id and a trace.id were inserted into the error’s log entry by the agent:
{
  "@timestamp": "2020-09-06T03:23:07.197Z",
  "event.dataset": "spring-boot-application.log",
  "log.level": "WARN",
  "log.logger": "org.springframework.web.servlet.mvc.support.DefaultHandlerExceptionResolver",
  "message": "Resolved [org.springframework.web.HttpRequestMethodNotSupportedException: Request method 'POST' not supported]",
  "process.thread.name": "http-nio-8080-exec-5",
  "service.name": "spring-boot-application",
  "trace.id": "bd13971e7ee07f0ce39f9e22961605d8",
  "transaction.id": "fbd29ee140c434ce"
}
Shipping correlated logs using Filebeat
Before we can view the correlated logs in the APM app, we need to ship them to our Elasticsearch cluster. This can be done using Filebeat with minimal configuration.
First, download the Filebeat agent appropriate for your Elastic Stack version and your application’s platform. The download instructions are slightly different for each platform. For example, for a Mac platform and the Elastic Stack version of the cloud instance we are using, the download instructions would be:
curl -L -O https://artifacts.elastic.co/downloads/beats/filebeat/filebeat-7.8.0-darwin-x86_64.tar.gz
tar xzvf filebeat-7.8.0-darwin-x86_64.tar.gz
cd filebeat-7.8.0-darwin-x86_64/
You can run these instructions in your java-monitoring folder if you wish to keep everything together.
Once in the Filebeat folder (in a new terminal), you can configure Filebeat by changing filebeat.yml to have an input of type log that is enabled and that points to the log file. Also set json.keys_under_root and json.overwrite_keys to true:
filebeat.inputs:
- type: log
  enabled: true
  paths:
    - <PATH_TO_YOUR_LOGS>/mysqlservice/mysqlservice.log.json
  json.keys_under_root: true
  json.overwrite_keys: true
The json. options make it possible for Filebeat to decode logs structured as JSON messages. Furthermore, json.keys_under_root: true will put the log fields at the top of the output document, while json.overwrite_keys: true will overwrite the fields that Filebeat normally adds (type, source, offset, etc.) in case of conflicts.
If you are using Elastic Cloud you will also set the cloud.id and cloud.auth keys in filebeat.yml. If you are running a self-managed deployment you need to set output.elasticsearch to point to your Elasticsearch cluster (you may need to set appropriate authentication credentials for the cluster). In our case, we are using Elastic Cloud:
cloud.id: "<YOUR_CLOUD_ID>"
cloud.auth: "<YOUR_CLOUD_AUTH>"
Filebeat comes with predefined assets for parsing, indexing, and visualizing your data. Filebeat loads these assets using the Kibana API. If you are running a self-managed deployment you need to configure the Kibana endpoint. If you are using Elastic Cloud no additional configuration is needed. To load these assets run:
./filebeat setup
Once setup is finished, you can go ahead and run Filebeat so it can start consuming the correlated logs:
./filebeat -e
Viewing the correlated logs in the Kibana APM app
To navigate from a transaction to its logs, go to the Kibana APM app, click on mysqlservice and then click on the DispatcherServlet#doPost transaction to find the error we generated previously. Now click on Actions and select Trace logs:
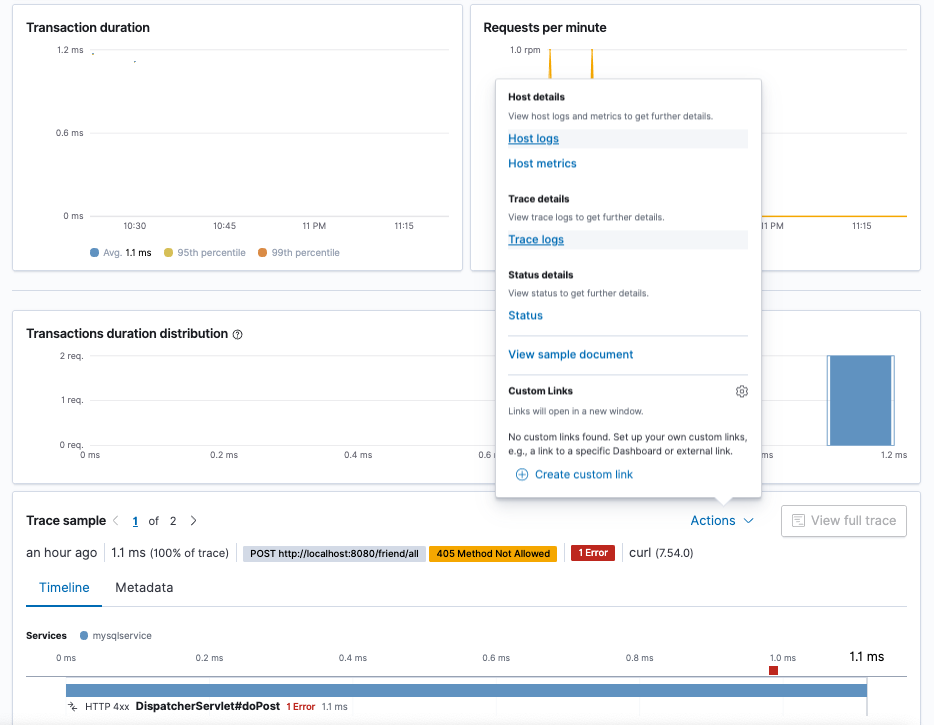
This will transfer you to the Logs app where the logs for that transaction will be shown.
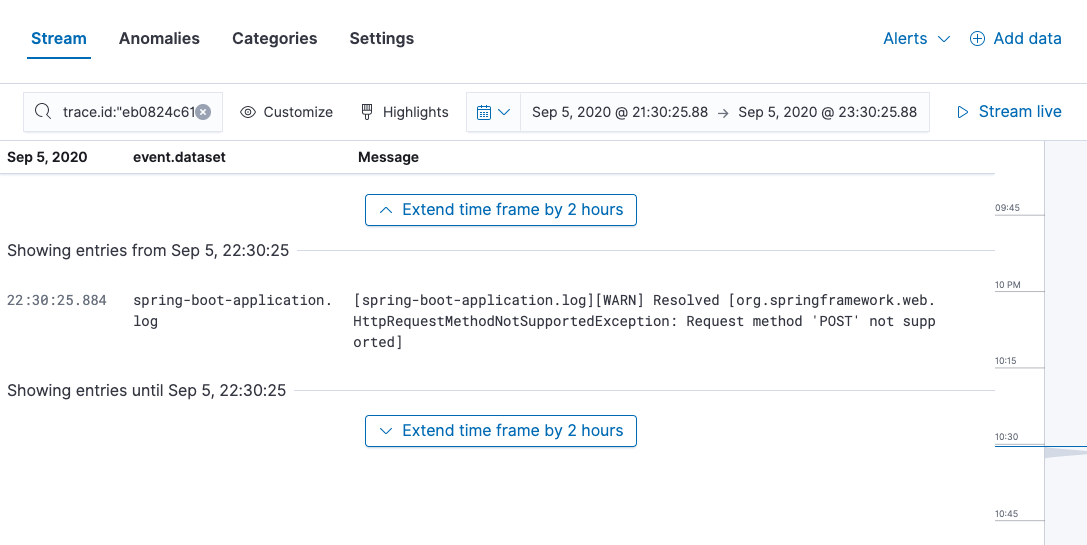
Since we made the effort to use ECS logging in our Java application, the data is already nicely structured (and named). There is no need to use an ingest node pipeline to process log entries!
Monitoring Java methods
What if we want to measure a specific piece of code? In that case, we can use the Elastic Java Agent API to instrument the code. For example, let’s say that before we can add a friend to the database, we need to call some method and we want it to show as a separate span within the current transaction. There are a number of ways to instrument the method. The simplest is to annotate it with @CaptureSpan.
If you recall the first post, we did not have to add a dependency to the Java Agent when we first instrumented mysqlservice. However, now that we want to use the agent API inside the application, we do need to add a dependency to the Elastic APM Java Agent API in pom.xml:
<dependency>
      <groupId>co.elastic.apm</groupId>
      <artifactId>apm-agent-api</artifactId>
      <version>1.17.0</version>
</dependency>
Let’s add a new delay method to MainController.java and call it when servicing the /add endpoint:
package com.example.mysqlservice;
import org.springframework.beans.factory.annotation.Autowired;
import org.springframework.stereotype.Controller;
import org.springframework.web.bind.annotation.GetMapping;
import org.springframework.web.bind.annotation.PostMapping;
import org.springframework.web.bind.annotation.RequestMapping;
import org.springframework.web.bind.annotation.RequestParam;
import org.springframework.web.bind.annotation.ResponseBody;
import co.elastic.apm.api.CaptureSpan;
@Controller
@RequestMapping(path="/friend")
public class MainController {
 @Autowired
 private FriendRepository friendRepository;
 @CaptureSpan(value="delay")
 public void delay(int length) {
   try {
     Thread.sleep(length);
   } catch(Exception e) {
     e.printStackTrace();
   }
 }
 @PostMapping(path="/add")
 public @ResponseBody String addNewFriend (@RequestParam String name) {
   delay(1000);
   Friend friend = new Friend();
   friend.setName(name);
   friendRepository.save(friend);
   return "Saved";
 }
 @GetMapping(path="/all")
 public @ResponseBody Iterable<Friend> getAllFriends() {
   return friendRepository.findAll();
 }
}
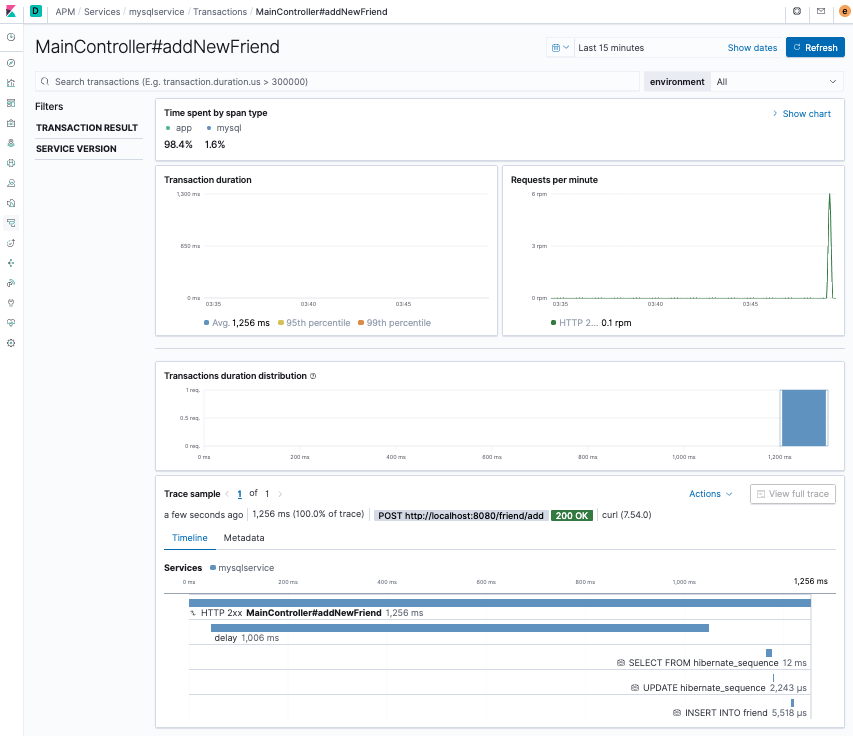
Rebuild and run the application as usual, then add a new friend to the database and view the transaction in Kibana. You now see the span within the addNewFriend transaction and can verify that it took about one second — corresponding to the delay we simulated using Thread.sleep().
To complete our custom instrumentation, let’s generate some (correlated) logs in the delay method. All we have to do is use the Spring Logback logger and the Elastic Java Agent will handle the correlation. Your application should look like this:
package com.example.mysqlservice;
import org.springframework.beans.factory.annotation.Autowired;
import org.springframework.stereotype.Controller;
import org.springframework.web.bind.annotation.GetMapping;
import org.springframework.web.bind.annotation.PostMapping;
import org.springframework.web.bind.annotation.RequestMapping;
import org.springframework.web.bind.annotation.RequestParam;
import org.springframework.web.bind.annotation.ResponseBody;
import co.elastic.apm.api.CaptureSpan;
import org.slf4j.Logger;
import org.slf4j.LoggerFactory;
@Controller
@RequestMapping(path="/friend")
public class MainController {
 @Autowired
 private FriendRepository friendRepository;
 Logger logger = LoggerFactory.getLogger(MainController.class);
 @CaptureSpan(value="delay")
 public void delay(int length) {
   logger.info("going to sleep for " + length + "ms.");
   try {
     Thread.sleep(length);
   } catch(Exception e) {
     e.printStackTrace();
   }
   logger.info("finished sleep");
 }
 @PostMapping(path="/add")
 public @ResponseBody String addNewFriend (@RequestParam String name) {
   logger.info("adding new friend: " + name  + ".");
   delay(1000);
   Friend friend = new Friend();
   friend.setName(name);
   friendRepository.save(friend);
   logger.info("added: " + name);
   return "Saved";
 }
 @GetMapping(path="/all")
 public @ResponseBody Iterable<Friend> getAllFriends() {
   return friendRepository.findAll();
 }
}
Rebuild, run, and add a friend:
curl localhost:8080/friend/add -d name=Johanna
Now, as you did before, find the transaction in the APM app in Kibana and view the trace logs. You should see the logs you generated among the other logs for the transaction.
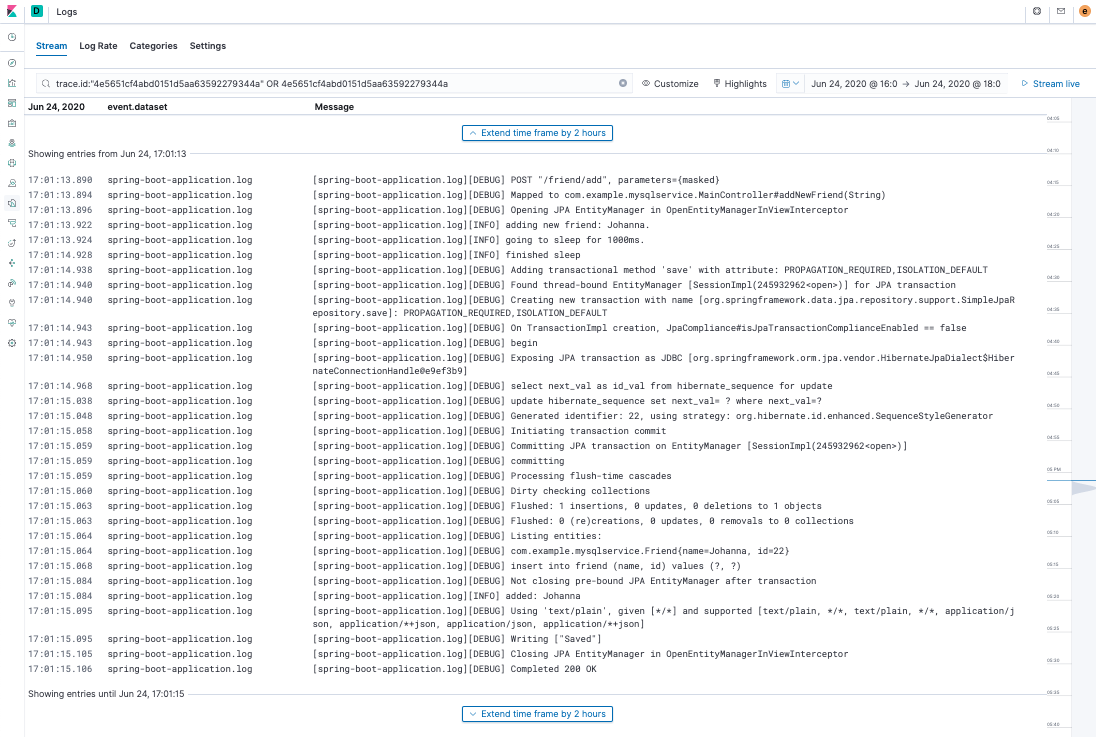
We are now able to go deep into an application and measure the performance of a particular method — plus the method’s logging output will be correlated with the transaction it's in!
Monitoring a multiservice application
Applications are often composed of a number of services that call one another across a network. Elastic APM is able to correlate a series of service transactions into an end-to-end trace. It does so automatically and it does so across multiple technologies. In this post, we will continue using Java, but we could well be switching to .NET or Node.js, among other Elastic APM agents.
We are now going to create a new Spring frontend application that uses mysqlservice to respond to its own endpoints. We are going to keep it simple to just show how Elastic APM builds a trace automatically.
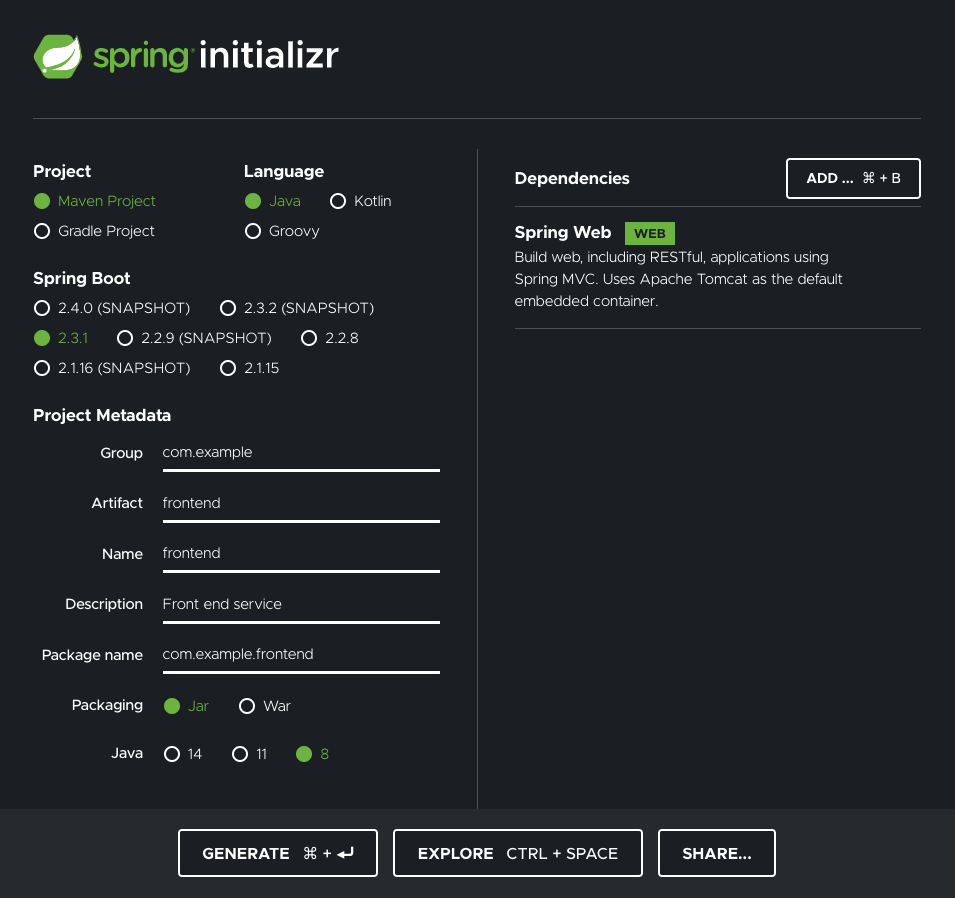
Once again, head over to start.spring.io and build an application as follows. Add the Spring Web dependency, name it frontend, and leave the defaults. Click GENERATE.
Unzip the download and move it to your java-monitoring workspace. We are simply going to make the FrontendApplication be a controller that responds to GET /friend-list requests by calling mysqlservice and returning the data received from this call to the client. We will do this using Spring’s RestTemplate. Replace the content of FrontendApplication.java with the following:
package com.example.frontend;
import org.springframework.boot.SpringApplication;
import org.springframework.boot.autoconfigure.SpringBootApplication;
import org.springframework.web.bind.annotation.GetMapping;
import org.springframework.web.bind.annotation.RestController;
import org.springframework.web.client.RestTemplate;
@RestController
@SpringBootApplication
public class FrontendApplication {
   private static String getFriendList() {
       RestTemplate rest = new RestTemplate();
       return rest.getForObject("http://localhost:8080/friend/all", String.class);
   }
   @GetMapping("/friend-list")
   public String friendList() {
       return getFriendList();
   }
   public static void main(String[] args) {
       SpringApplication.run(FrontendApplication.class, args);
   }
}
Since mysqlservice is already using port 8080, add this line to application.properties:
server.port: 8081
Build the application and run it with the Java Agent:
mvn package
java -javaagent:../agent/elastic-apm-agent-1.17.0.jar \
  -Delastic.apm.service_name=frontend \
  -Delastic.apm.server_urls=<YOUR_SERVER_URL> \
  -Delastic.apm.secret_token=<YOUR_SECRET_TOKEN> \
  -Delastic.apm.application_packages=com.example \
  -jar target/frontend-0.0.1-SNAPSHOT.jar
Now get a list of friends using the frontend service:
curl localhost:8081/friend-list
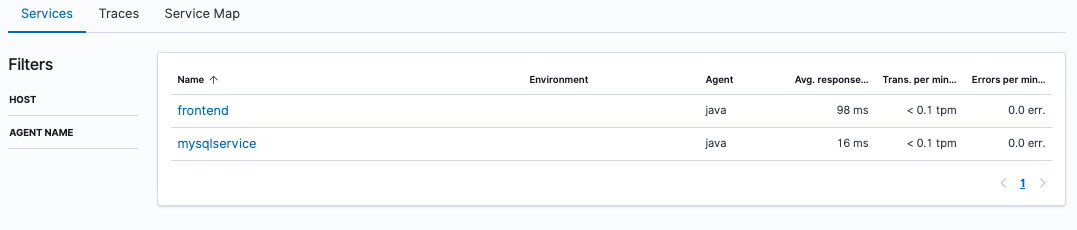
Go to the APM app in Kibana. You will now see two services: frontend and mysqlservice:
Kibana also has a great new feature, available with a Platinum subscription, that displays a service map:
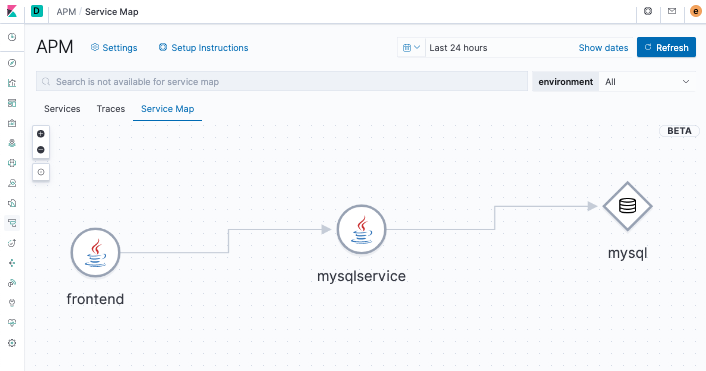
The service map, generated from the data sent to Elasticsearch by the APM Server, shows how the application is working as an orchestration of services and databases.
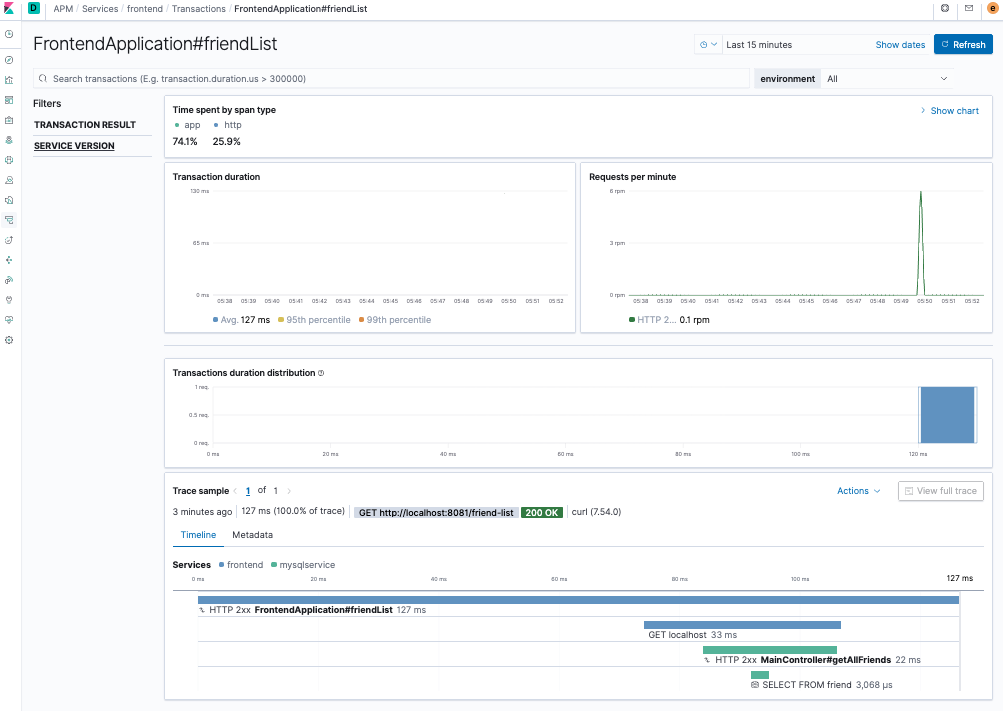
Now click on Traces and then on FrontendApplication#friendList. You can see how the request for a list of friends started with the frontend service, which called mysqlservice, which then retrieved data from MySQL — an end-to-end application trace!
Visualizing APM data in Kibana
It is, of course, possible to visualize and analyze APM data using the .apm* indices directly. Kibana provides a wide variety of visualizations. In particular, the Time Series Visual Builder (TSVB) offers a powerful, intuitive, easy way of visualizing multiple time series at the same time. For instance, we can display transaction and log metrics in the same visualization. We can also add annotations based on interesting conditions, such as error codes or messages appearing in the logs. If "drag and drop" is more your style, you can use Kibana Lens to build multiple types of visualizations.
We can even use Elastic machine learning features to find anomalies in the APM data.
Before we can try any of this out, we need to generate some data. Our next Spring application, trafficsim, will be a traffic simulator that will call the /friend-list endpoint with a random 0- to 2-second delay between calls. By now, you know the drill. Use the Spring quick start page to get started (you only need the Spring Web dependency) and add the following controller to simulate the traffic. Your TrafficsimApplication.java should look like this:
package com.example.trafficsim;
import org.springframework.boot.SpringApplication;
import org.springframework.boot.autoconfigure.SpringBootApplication;
import org.springframework.web.bind.annotation.RequestParam;
import org.springframework.web.bind.annotation.GetMapping;
import org.springframework.web.bind.annotation.RestController;
import org.springframework.web.client.RestTemplate;
@RestController
@SpringBootApplication
public class TrafficsimApplication {
   private static String getFriendList() {
       RestTemplate rest = new RestTemplate();
       return rest.getForObject(
           "http://localhost:8081/friend-list", String.class);
   }
   @GetMapping("/simulate-traffic")
   public String simulateTraffic(@RequestParam(value = "num-events",
       defaultValue = "10") int numEvents) {
       for (int i = 0; i < numEvents; i++) {
           try {
               int t = (int)(Math.random() * 2000);
               System.out.println("TBT: " + t);
               Thread.sleep(t);
           } catch (Exception e) {
               e.printStackTrace();
           }
           System.out.println(getFriendList());
       }
       return "simulated " + numEvents + " events.\n";
   }
   public static void main(String[] args) {
       SpringApplication.run(TrafficsimApplication.class, args);
   }
}
Build and start your trafficsim service without agent instrumentation using port 8082.
mvn package
java -jar target/trafficsim-0.0.1-SNAPSHOT.jar
We are also going to simulate a sporadic delay in the /friend-list transaction itself. The idea is to simulate rare, random anomalies that we can later try to find and explain in our visualizations.
Modify the /all endpoint handler in the mysqlservice MainController as follows:
…
@GetMapping(path="/all")
public @ResponseBody Iterable<Friend> getAllFriends() {
   double r = Math.random();
   // generate an unexpected delay (with prob = .01%)
   if (r < 0.0001) {
     r = Math.random();
     int ms = (int)(r * 8000);
     logger.warn("Unexpected " + ms + "ms delay start.");
     delay(ms);
     logger.warn("Unexpected " + ms + "ms delay end.");
   }
   return friendRepository.findAll();
}
...
What we are doing is introducing a random 0- to 8-second delay with a probability of .01%. We are also logging the delay (remember that we are using log correlation in mysqlservice).
Rebuild and restart mysqlservice as before. The frontend service should still be running on port 8081 and trafficsim on port 8082. Make sure that Filebeat is also still running.
We want to generate simulated data for a period of at least two hours. Open up three terminals and call the traffic simulator generating 10000 events in each one:
curl localhost:8082/simulate-traffic?num-events=10000
Analyzing APM data using TSVB
With our simulated data sets, we can now go to Kibana and create a TSVB visualization as follows:
- Go to Visualize in Kibana and select TSVB as the visualization type.
- Make sure the time picker reflects the two-hour period of your simulation.
- In the Data tab, pick Average as the aggregation and transaction.duration.us as the field
- In the Panel options tab, make sure that the index pattern apm-* is being used (override the default if necessary).
- In the Annotations tab, add filebeat-* as a data source and @timestamp as the time field. Enter log.level:WARN as the query string, log.level, message as the fields, and {{[log.level]}}: {{message}} as the row template. You can also use message:unexpected as the query string since we are looking for messages that have the word unexpected.
You should see a visualization similar to this:
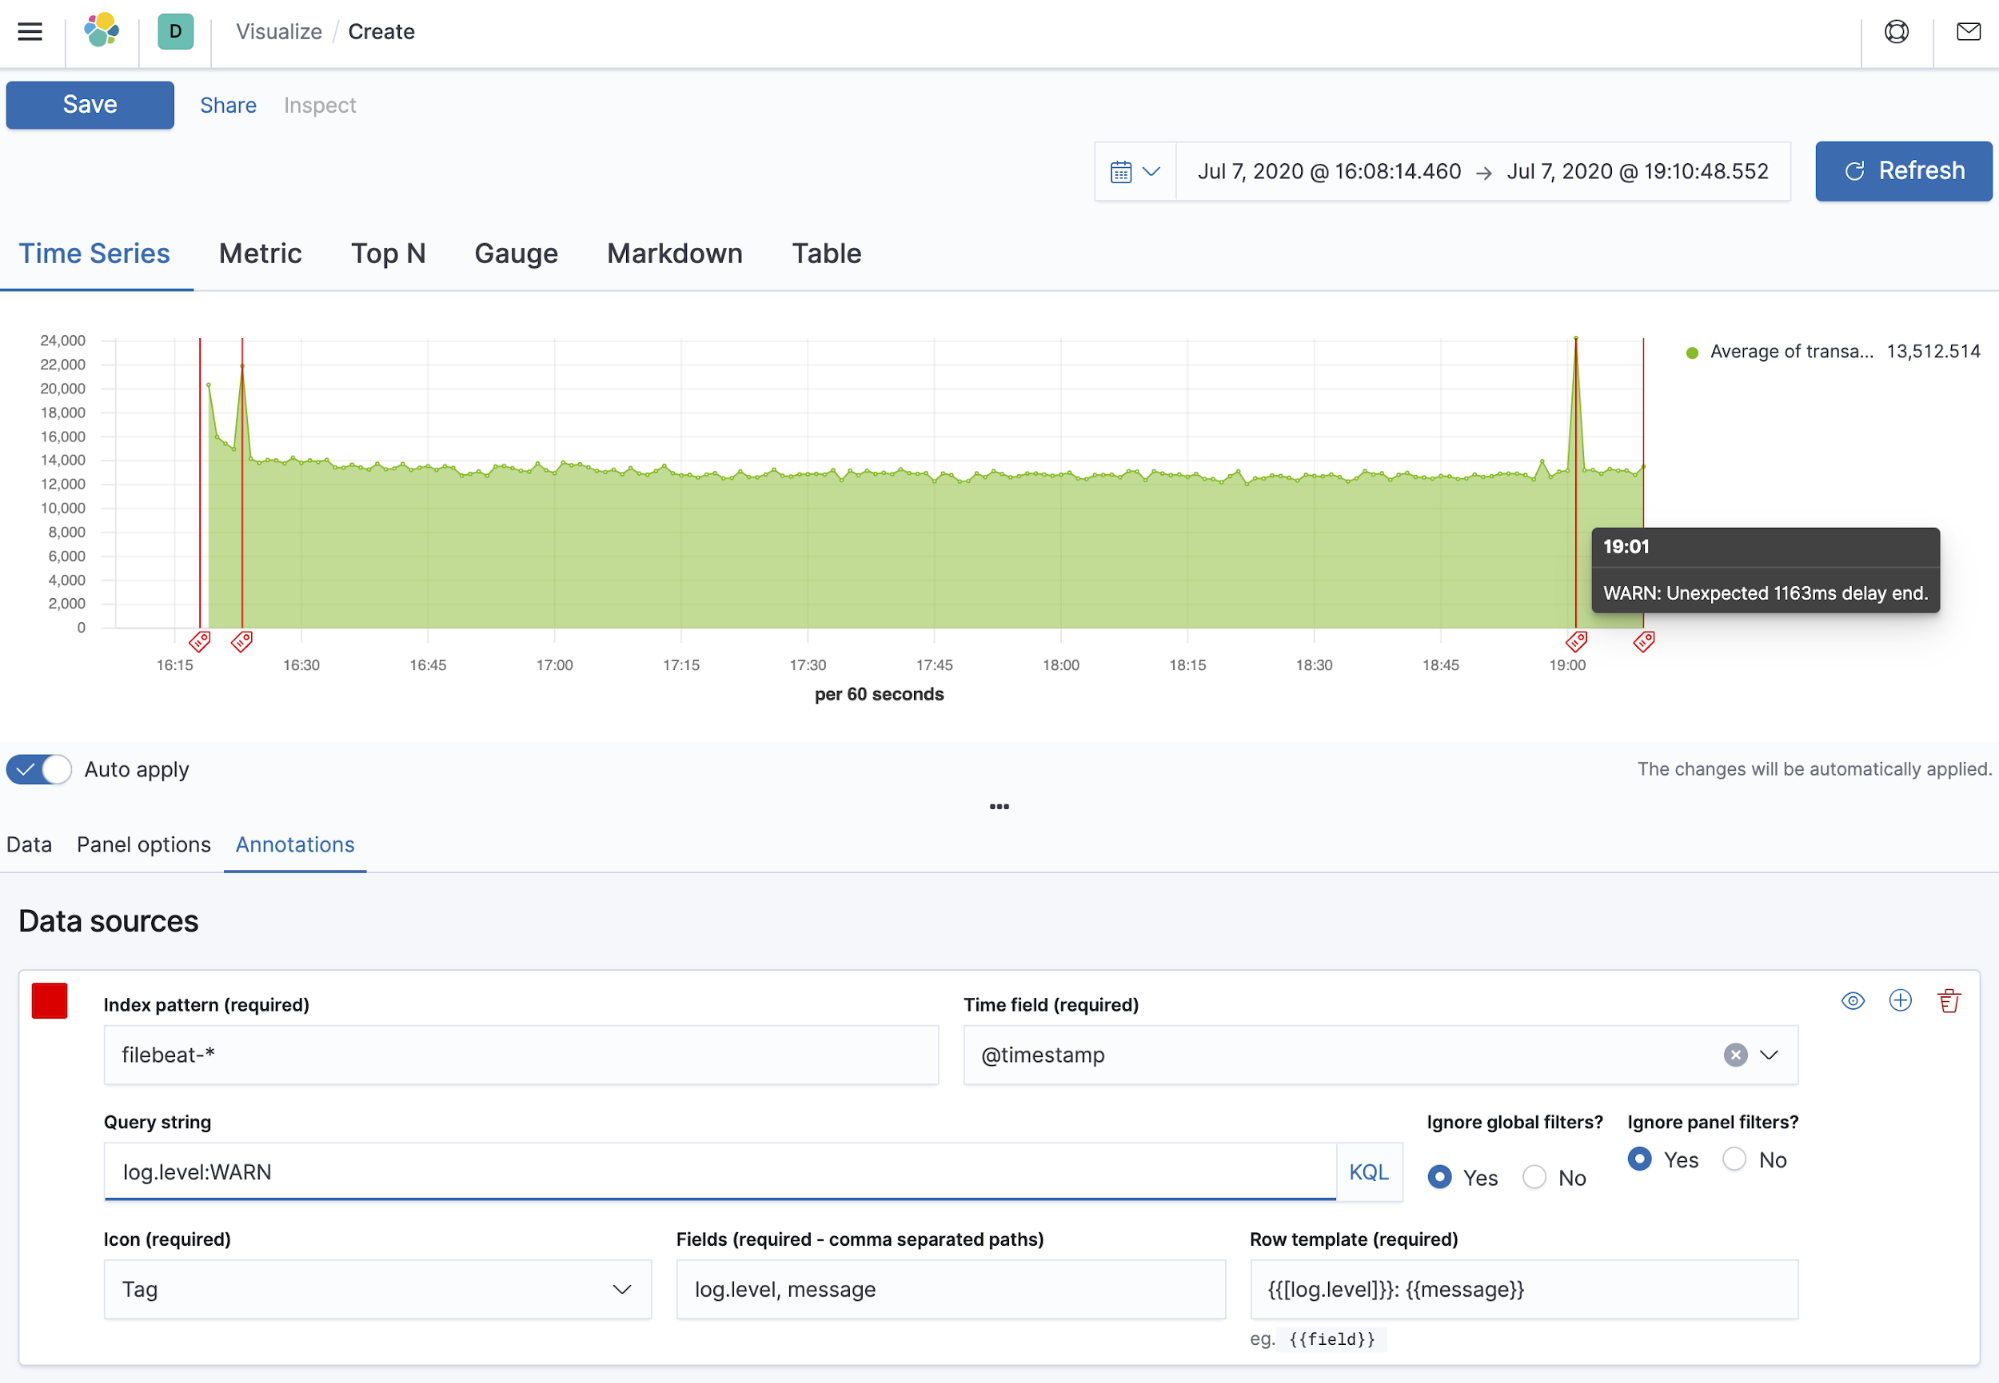
Using TSVB, we were able to correlate the spikes in the APM data (corresponding to the sporadic delays we simulated in the mysqlservice code) with the events logged at the time they occurred — a temporal way of correlating logs to application transactions.
Finding anomalies with machine learning
Elastic machine learning features (available with a Platinum subscription) can identify patterns and detect anomalies in time series data. Let’s see if machine learning can automatically find the sporadic delays we simulated in mysqlservice.
- Go to the Machine Learning app in Kibana and create a single metric job using the apm-* index pattern (if you are using Elastic Cloud, you will need to update your deployment and add a machine learning node).
- Pick the two-hour time range that reflects our simulation.
- Next, pick mean("transaction.duration.us") as the field and a 1m bucket span.
- Next, name your job — for example, mysqservice-anomalies.
- Click Next until you get to the summary and then create the job.
- Once the job runs, click to view the results.
You should see a single-metric visualization similar to this:
Using machine learning, we are able to find a behavior pattern for our APM data and detect anomalies automatically.
Summary
In this two-part blog, we have barely scratched the surface of the abilities of Elastic APM to monitor and analyze Java applications. Java is rich in technologies that have allowed it to become entrenched in application development. Elastic APM and its Java Agent make it possible to easily and effectively monitor any Java application. Keep watching our blog for more information and examples.
Exercises and next steps
In the meantime, here are some things you can try to enhance your skills:
- Attach the Java Agent to a Java application without restarting it using automatic setup
- Add ECS logging to the frontend service
- Run the frontend service with log correlation on
- Configure Filebeat to read the new log files
- Add a new dummy method to the frontend service and then instrument it using @CaptureTrace
- Use a more typical front end such as a Node.js application
- Add real user monitoring (RUM) to the mix
- Add alerts using alerting in Kibana directly or through the Machine Learning app
- Take the Elastic Observability Engineer training and become an Elastic Certified Observability Engineer