Making deployment health on Elastic Cloud better, one error at a time


 Share on Twitter
Share on Twitter

 Share on LinkedIn
Share on LinkedIn

 Share on Facebook
Share on Facebook

 Share by Email
Share by Email

 Print this page
Print
Maintaining a healthy deployment is critical for a successful Elastic Cloud experience. We want to make it easy for Elastic Cloud users to run healthy deployments, and with our new health reporting capability, this is exactly what we enable.
If you have been using Elastic Cloud for a while, you are probably used to seeing an error banner when your deployment is unhealthy; this includes issues with Elasticsearch, Kibana, Integration server, or Enterprise Search instances.
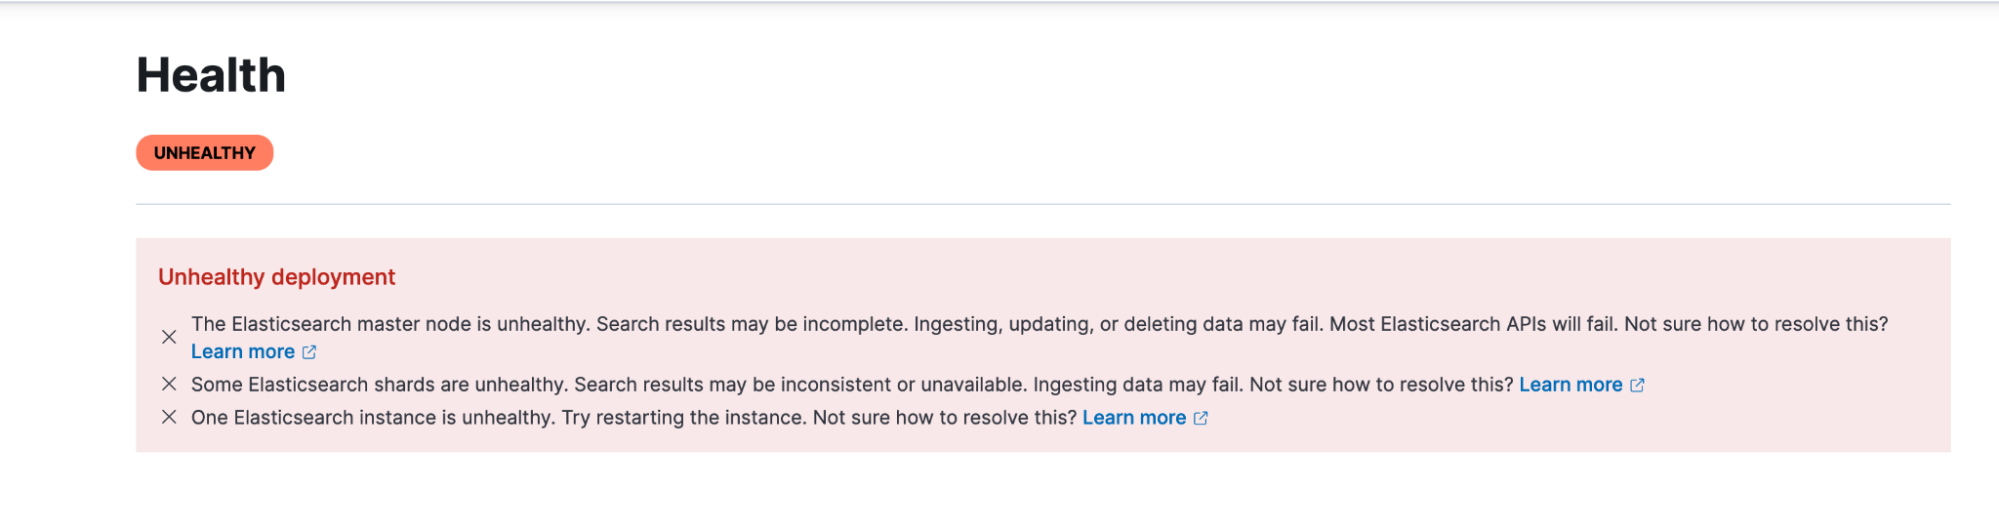
While the banner tells you something is wrong, it has limited information about the impact you might see and what you should do to resolve the issue. We realize this leaves you to either contact support or dig around to understand the issue better to resolve it. This can be challenging for many users, especially in crunch times when you just want to get the deployment up and running again. We got you!
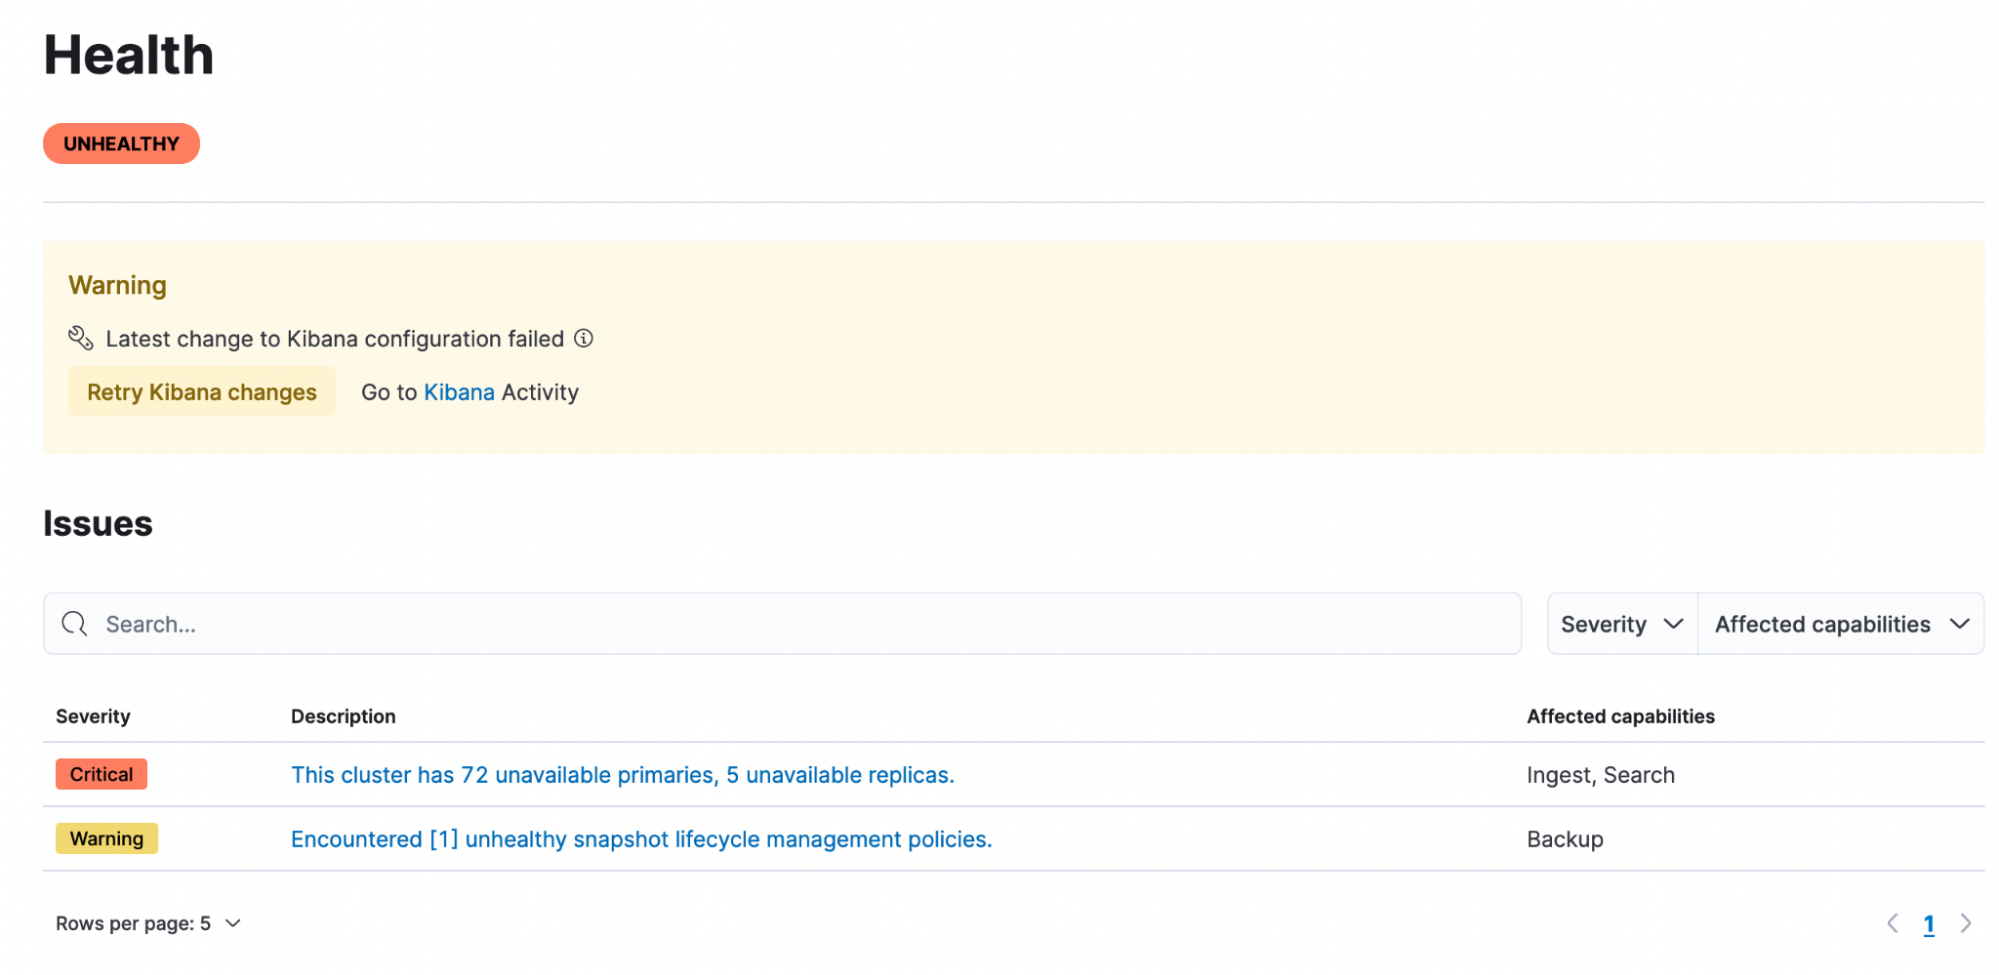
Deployments on stack versions 8.4 and above have a much better health reporting experience, allowing users to understand impact, diagnose, and resolve issues using specific troubleshooting instructions. For deployments using version 8.4 and above, we have a new and improved health reporting experience especially for Elasticsearch cluster issues.
[Related article: Six ways to streamline development with Elastic Cloud]
Why start with better health reporting for Elasticsearch?
We started with Elasticsearch because it’s the heart of every deployment, and maintaining the health of your cluster is critical to every use case.
With the newer stack versions, we now lead you to a dedicated health page in the Elastic Cloud console, and when there are issues with your Elasticsearch cluster, we present you with information that breaks down the issues.
Each issue has severity, description, and impact areas focussed on Elasticsearch cluster issues:
- Shard health
- Master node health
- Snapshot lifecycle management
- Index lifecycle management
- Health of the repositories used for storing snapshots (repository integrity)
Impact areas are described in terms we often hear our users describe when something isn’t working:
- Search
- Ingest
- Backup
- Deployment management
You can also dig down to specific issues to troubleshoot and resolve them. The troubleshooting links lead to detailed instructions on resolving issues.
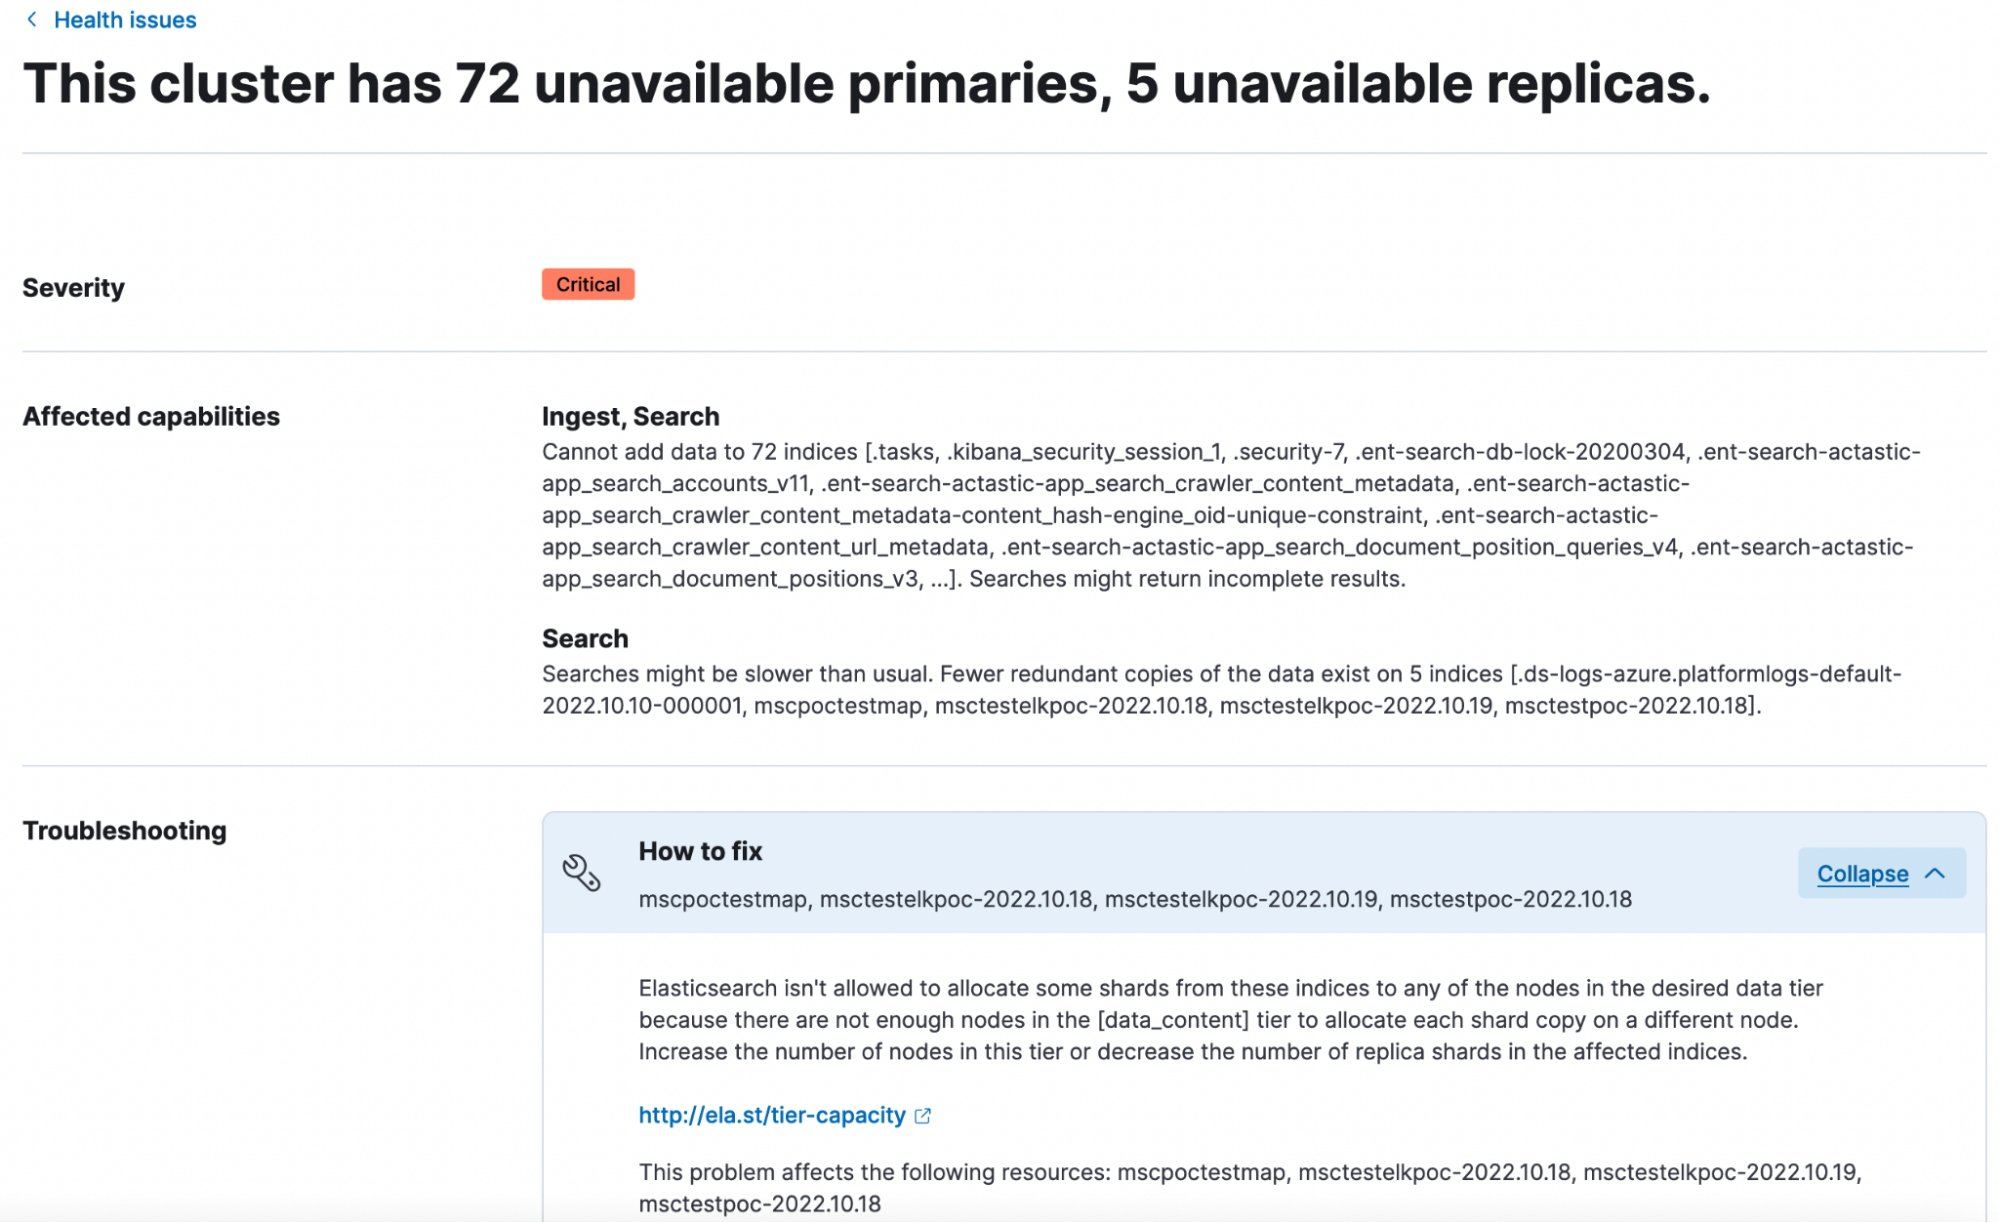
Health reporting is complex, but with 8.4 we have simplified it by relying on the Elasticsearch Health API. In fact, most of the information you see on the UI is returned directly by the API. In the future, we are working on adding more indicators for Elasticsearch health to capture a wider variety of scenarios, such as the disk utilization indicator and guided troubleshooting guides in the cloud console. We want to make it easier for users to understand the impact of issues, as well as debug and resolve them quickly.
If you haven’t yet upgraded your deployment to the latest version, I hope we have given you one more reason to do so. Find out more about our 8.5 release, or learn how to get started with Elastic Cloud.
Share
- Share on Twitter
Share on Twitter
- Share on LinkedIn
Share on LinkedIn
- Share on Facebook
Share on Facebook
- Share by Email
Share by Email
- Print this page
Print