Introducing Logstash on Elastic Cloud on Kubernetes (ECK) technical preview

 Share on Twitter
Share on Twitter

 Share on LinkedIn
Share on LinkedIn

 Share on Facebook
Share on Facebook

 Share by Email
Share by Email

 Print this page
Print
Today, we’re excited to announce the availability of the Logstash Operator for Elastic Cloud on Kubernetes (ECK) in technical preview. Logstash® on Kubernetes integrates with the rest of the Elastic Stack on ECK and removes the need to manage all the resources individually and manually.
The Logstash operator allows you to manage and configure Logstash pods in just a few lines of YAML with support for configuring Logstash pipelines using the familiar Logstash Domain Specific Language (DSL) inline in the Custom Resource Definition (CRD) or in mounted volumes. Multiple pipelines and pipeline->pipeline configurations are fully supported, and any updated pipelines will be detected and reloaded inside the pod, without requiring a restart of the pod.
The technical preview includes streamlined Elasticsearch® integration with Logstash plugins through the use of elasticsearchRef and pre-populated environment variables to help configure plugins. Monitoring Logstash has also been simplified with full support for stack monitoring and minimal effort.
We will be adding further streamlined integration with the rest of the Elastic Stack as we continue development of the Logstash operator.
Let’s create a Logstash cluster!
Creating your first Logstash pipeline on ECK
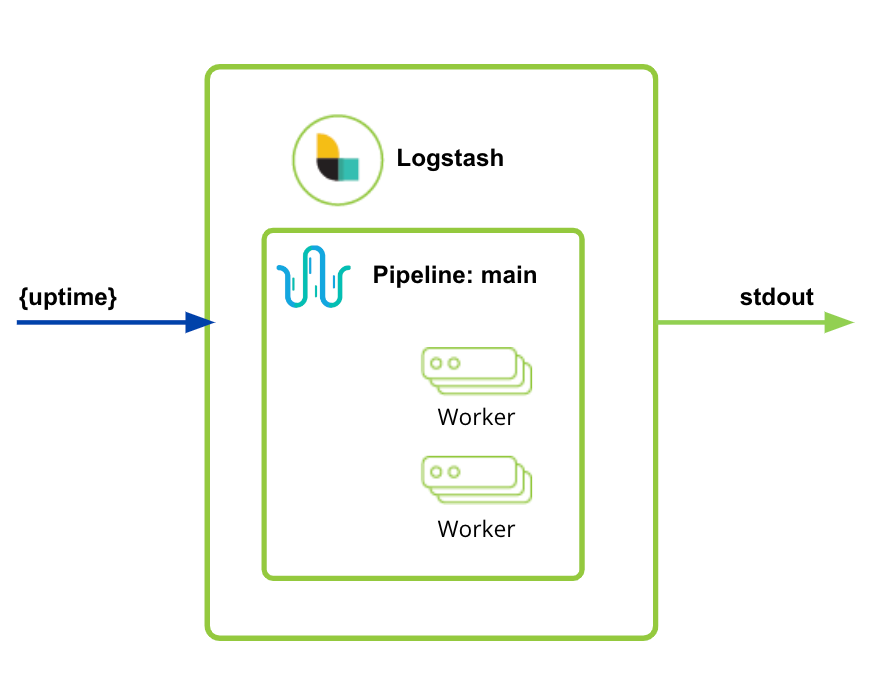
You’re going to create a single Logstash pod with a pipeline sending the result of uptime to stdout.*
apiVersion: logstash.k8s.elastic.co/v1alpha1
kind: Logstash
metadata:
  name: logstash
spec:
  count: 1
  version: 8.9.0
  config:
    pipeline.batch.size: 125
  pipelines:
    - pipeline.id: main
      pipeline.workers: 2
      config.string: |
        input {
          exec {
            command => 'uptime'
            interval => 1000
          }
        }
        output {
          stdout{}
}Send data to Elasticsearch
This is great, but sending data to stdout isn’t very useful or interesting. Let’s send it to Elasticsearch instead. Let’s assume we already have an Elasticsearch instance in the same Kubernetes cluster as Logstash called quickstart.
First, you need to create a spec.elasticsearchRef to create the association between Logstash and Elasticsearch:
  elasticsearchRefs:
    - clusterName: eck
name: quickstartSpecify the name of the existing Elasticsearch cluster in the name parameter, and define a cluster name to refer to the Elasticsearch cluster in our environment (more interesting things are coming soon with clusterName to make plugin configuration even easier!).
Next, you need to update your pipeline to add an Elasticsearch output:
  pipelines:
    - pipeline.id: main
      pipeline.workers: 2
      config.string: |
        input {
          exec {
            command => 'uptime'
            interval => 1000
          }
        }
        output {
          elasticsearch {
            hosts => [ "${ECK_ES_HOSTS}" ]
            user => "${ECK_ES_USER}"
            password => "${ECK_ES_PASSWORD}"
            cacert => "${ECK_ES_SSL_CERTIFICATE_AUTHORITY}"
          }
}The Logstash operator creates the association between Logstash and Elasticsearch and populates environment variables to simplify the use of Elasticsearch plugins in pipeline configurations.
Add Elastic Agent
Next, add a listener for Elastic Agent. This requires you to create an input plugin to receive the data and create a service for this plugin.
First, let’s add the service, which you can do right in the Logstash CRD definition:
  services:
    - name: agent
      service:
        spec:
          type: LoadBalancer
          ports:
            - port: 5044
              name: agent
              protocol: TCP
targetPort: 5044And then update the pipeline to add the elastic_agent plugin:
  pipelines:
    - pipeline.id: main
      pipeline.workers: 2
      config.string: |
        input {
          elastic_agent {
            port => 5044
          }
        }
        output {
          elasticsearch {
            hosts => [ "${ECK_ES_HOSTS}" ]
            user => "${ECK_ES_USER}"
            password => "${ECK_ES_PASSWORD}"
            cacert => "${ECK_ES_SSL_CERTIFICATE_AUTHORITY}"
          }
}Now, your Logstash is listening for traffic from Elastic Agent and sending that data to Elasticsearch!
Add Stack monitoring
Next, you can use Elastic Stack monitoring to monitor the Logstash pod(s) you have created. Assuming you have an Elasticsearch monitoring instance, you can add stack monitoring by adding a spec.monitoring section:
 monitoring:
    metrics:
      elasticsearchRefs:
- name: elasticsearch-monitoringFull Logstash configuration
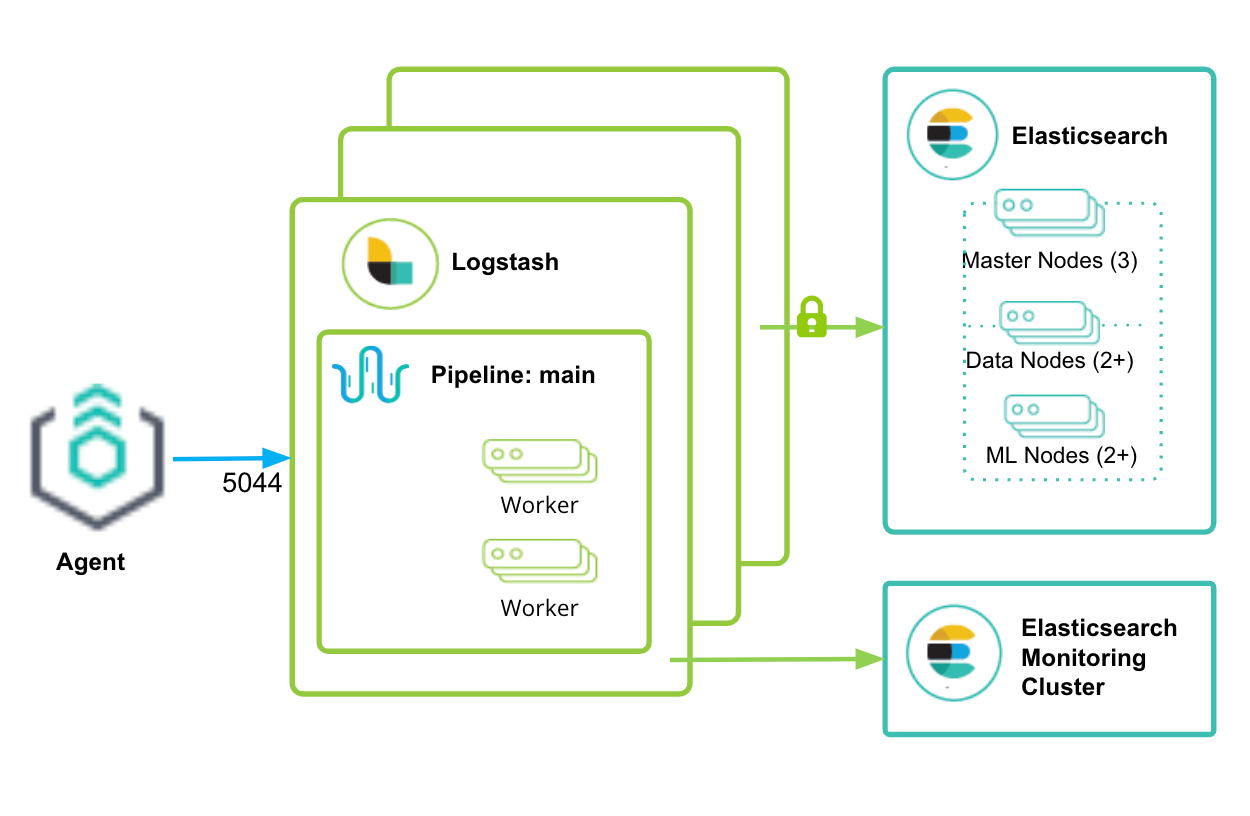
And now, you have our full Logstash configuration:
apiVersion: logstash.k8s.elastic.co/v1alpha1
kind: Logstash
metadata:
  name: logstash
spec:
  count: 3
  version: 8.9.0
  elasticsearchRefs:
    - clusterName: eck
      name: quickstart
  config:
    pipeline.batch.size: 125
  monitoring:
    metrics:
      elasticsearchRefs:
        - name: elasticsearch-monitoring
  pipelines:
    - pipeline.id: main
      config.string: |
        input {
          elastic_agent {
            port => 5044
          }
        }
        output {
          elasticsearch {
            hosts => [ "${ECK_ES_HOSTS}" ]
            user => "${ECK_ES_USER}"
            password => "${ECK_ES_PASSWORD}"
            cacert => "${ECK_ES_SSL_CERTIFICATE_AUTHORITY}"
          }
        }
  services:
    - name: agent
      service:
        spec:
          type: ClusterIP
          ports:
            - port: 5044
              name: agent
              protocol: TCP
targetPort: 5044And that’s it! In a few lines of YAML, you’ve created a 3-node Logstash cluster that will listen for Elastic Agent traffic, send it to an Elasticsearch cluster, and be monitored on a separate monitoring cluster!
From here, you can create multiple pipelines, each of which can be restarted individually without restarting a pod, sending data to multiple Elasticsearch clusters, sending Logstash logs to a stack monitoring cluster, and more.
For further examples of how to use Logstash on ECK, check out the sample recipes, including examples of configuring pipelines in secrets and mounted volumes, updating Elasticsearch roles to use custom indices, and running multiple pipelines.
This feature is still in technical preview and is still under development with more features and functionality to come.
Get started
To get started with Logstash for ECK, download Elastic Cloud on Kubernetes 2.9.0.
*Note: The pipeline definition at spec.pipelines — the syntax is the same as pipelines.yml and can be created inline or as a secret pointed to by a pipelinesRef. This includes the pipeline configuration and the pipeline settings, such as pipeline.workers — note that you can also have pipeline definitions point to a volume mount using the path.config setting. The spec.config setting is used for logstash.yml settings.
The release and timing of any features or functionality described in this post remain at Elastic's sole discretion. Any features or functionality not currently available may not be delivered on time or at all.
Share
- Share on Twitter
Share on Twitter
- Share on LinkedIn
Share on LinkedIn
- Share on Facebook
Share on Facebook
- Share by Email
Share by Email
- Print this page
Print