Integrating JMS with Elasticsearch Service in Elastic Cloud using Logstash
If you are reading this you probably already know that JMS message queues, such as IBM MQ, Apache ActiveMQ, or Solace PubSub+, provide asynchronous communication for your application. Here are two use cases combining message queues with ELK reported to us by our customers where their goal was to analyze and visualize large amounts of data to make better business decisions:
- Internet of Things (IoT): Monitoring performance metrics from a machinery line. The machinery on this customer's production line sends metrics to a message queue.
- Application Monitoring (Observability): Application performance metrics are sent to IBM MQ.
In both of the above cases, Logstash consumes the metrics from the message queue and the ELK Stack is used to parse, index, analyze, and visualize the resulting information to help the customer make the right business decisions.
This Logstash plugin for JMS allows Logstash to act as a queue or topic consumer. Updates in version 3.1.0 of the Logstash JMS input plugin:
- TLS
- Commercial support from Elastic for some brokers
- Failover across your queue managers
- Enhanced documentation
- Connecting as a durable subscriber
- Efficiency improvements
- Additional unit tests
- The ability to selectively include headers, properties, and the body of messages
Here is a simplified view of the data flow:
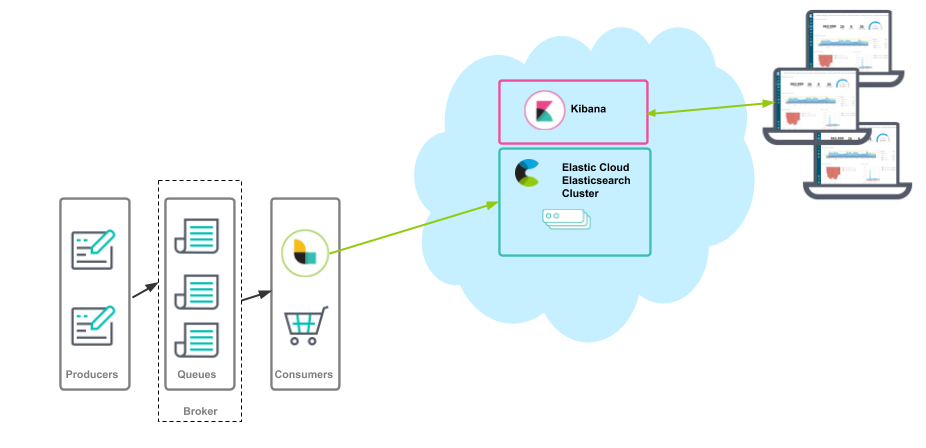
This blog details sending IBM MQ records to Elasticsearch Service in Elastic Cloud, but you can adapt the configuration to send to Elasticsearch and Kibana running on your laptop, in your data center, etc.
Configuring Logstash
Configuring Logstash is a two-step process:
- Configure the input (the connection to the message queue).
- Configure the output (the connection to Elasticsearch).
Input
Logstash is a consumer of a message queue, and the following information is needed:
- Broker protocol, host, and port (used in
broker_url)
Note: JNDI is also supported, see the examples in the plugin docs - Username and password
- Queue name (used in
destination) - Channel (used in
factory_settings)
In this example Logstash is a consumer of an IBM MQ message queue named DEV.QUEUE.1. This is the file logstash.conf:
input
{
  jms {
        broker_url => 'tcp://localhost:1414'
        destination => 'DEV.QUEUE.1'
        factory => 'com.ibm.mq.jms.MQQueueConnectionFactory'
        factory_settings => {
                              transport_type => 1
                              channel => 'DEV.APP.SVRCONN'
        }
        # JMS provider credentials if needed
        username => 'app'
        password => 'password'
        # Jar Files to include
        require_jars => ['/opt/IBMMQ/wmq/JavaSE/com.ibm.mq.allclient.jar']
  }
}
output
{
    stdout { codec => rubydebug {}}
}
Notes:
- The above
com.ibm.mq.allclient.jarcan be downloaded from IBM Support Fix Central by searching for your specific version of MQ, and all of the providers that support JMS should have similar jar files. - The above example is for an IBM MQ queue, the syntax for the broker_url is specific to the message queue vendor. Similarly, the configuration for a topic is different than a queue. For example configurations see the JMS input plugin docs, your vendor docs, and the examples from the JRuby JMS Gem used by the Logstash JMS input plugin.
- The configuration of the message queue connection factory (factory_settings) is specific to the vendor. See the documentation from your message queue vendor for specific settings that may be needed to set up the connection.
Output
The logstash.conf shown in the input section above used STDOUT as the output; in this section I will change that to send to Elasticsearch Service in Elastic Cloud. To deploy Elasticsearch and Kibana, I used a free trial, and created a default cluster in GCP. When I did this I was presented with all of the information necessary to connect Logstash to Elasticsearch. Here is a list of what is needed:
- Username
- Password
- Elasticsearch endpoint
You can collect all of the above while the deployment is being created. When you create your deployment you will see this information:
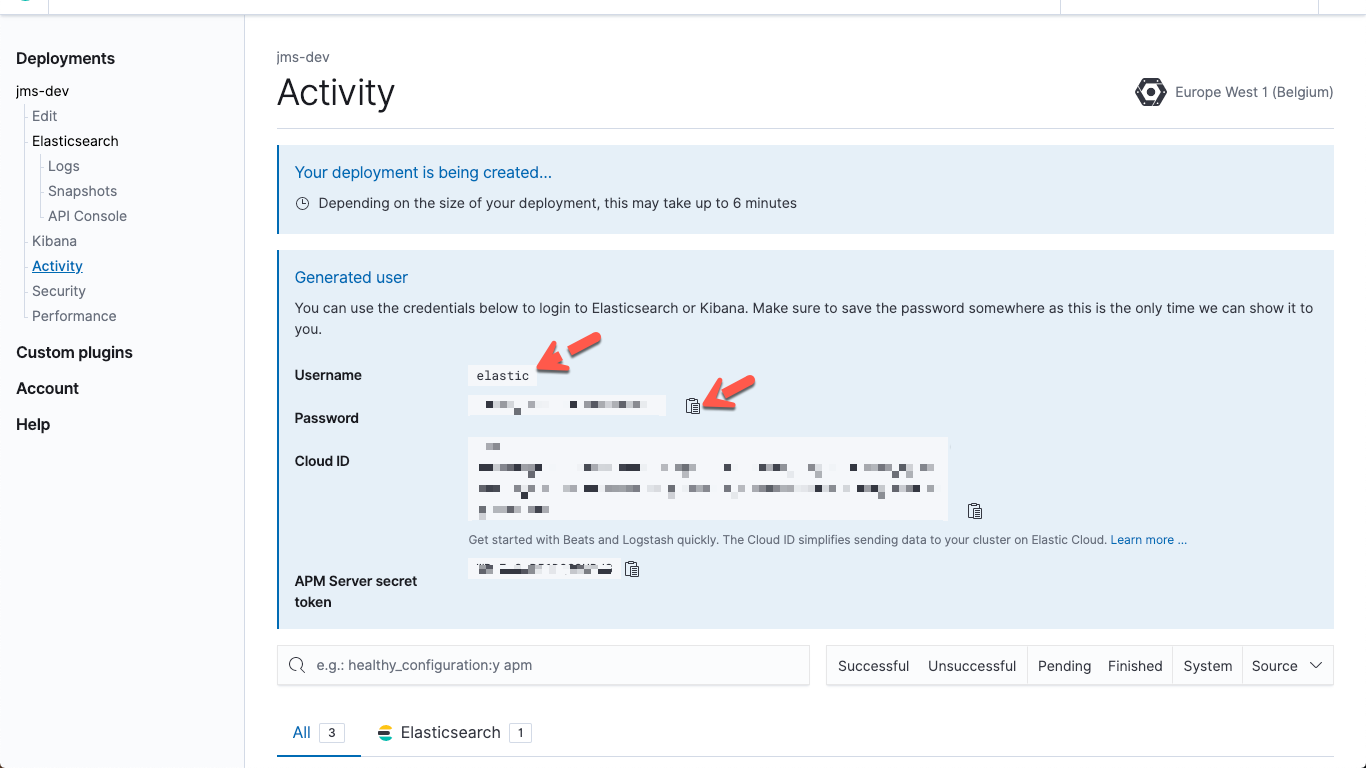
Collect the username and password
Note: When you navigate away from this page the password for the user elastic will no longer be displayed. If you need to reset that password click the Kibana -> Security entry in the left navigation list.
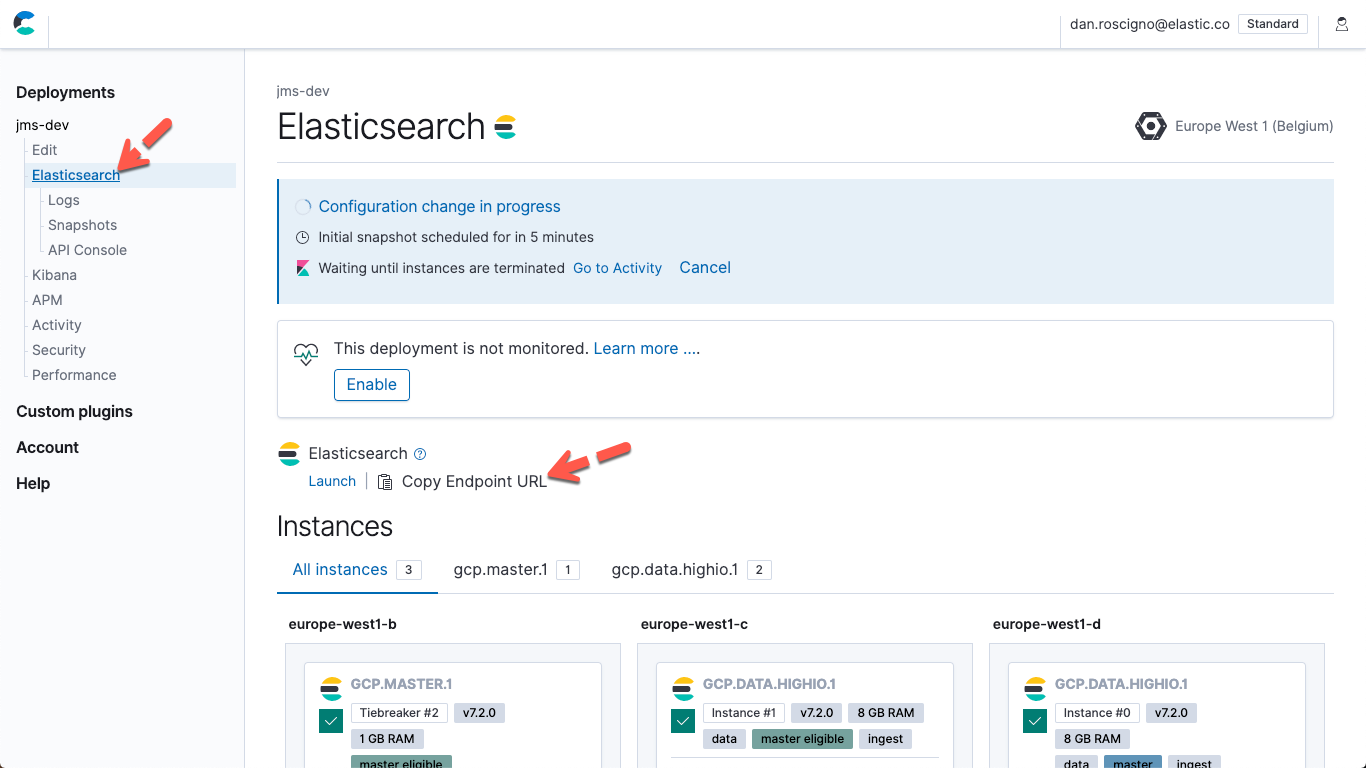
To get the Elasticsearch endpoint URL, click Elasticsearch in the left navigation list, and then click the Copy Endpoint URL button:
Configure Elasticsearch output
Modify the output{} section of logstash.conf to connect to Elasticsearch Service:
- Add the Elasticsearch Endpoint URL.
- Add the password for the user
elastic. - Comment out the
rubydebugoutput (optional).
output {
  elasticsearch {
    # hosts => ["https://abcdefghijklmnop-east-1.aws.found.io:9243"]
    hosts => ["<Elasticsearch Endpoint URL from above>"]
    user => "elastic"
    password => "<password for elastic user from above>"
  }
  #stdout { codec => rubydebug {}}
}
Enable Monitoring
Modify logstash.yml to enable monitoring and set the destination:
xpack.monitoring.enabled: true
xpack.monitoring.elasticsearch.hosts: ["<Elasticsearch Endpoint URL from above>"]
xpack.monitoring.elasticsearch.username: "elastic"
xpack.monitoring.elasticsearch.password: "<password for elastic user from above>"
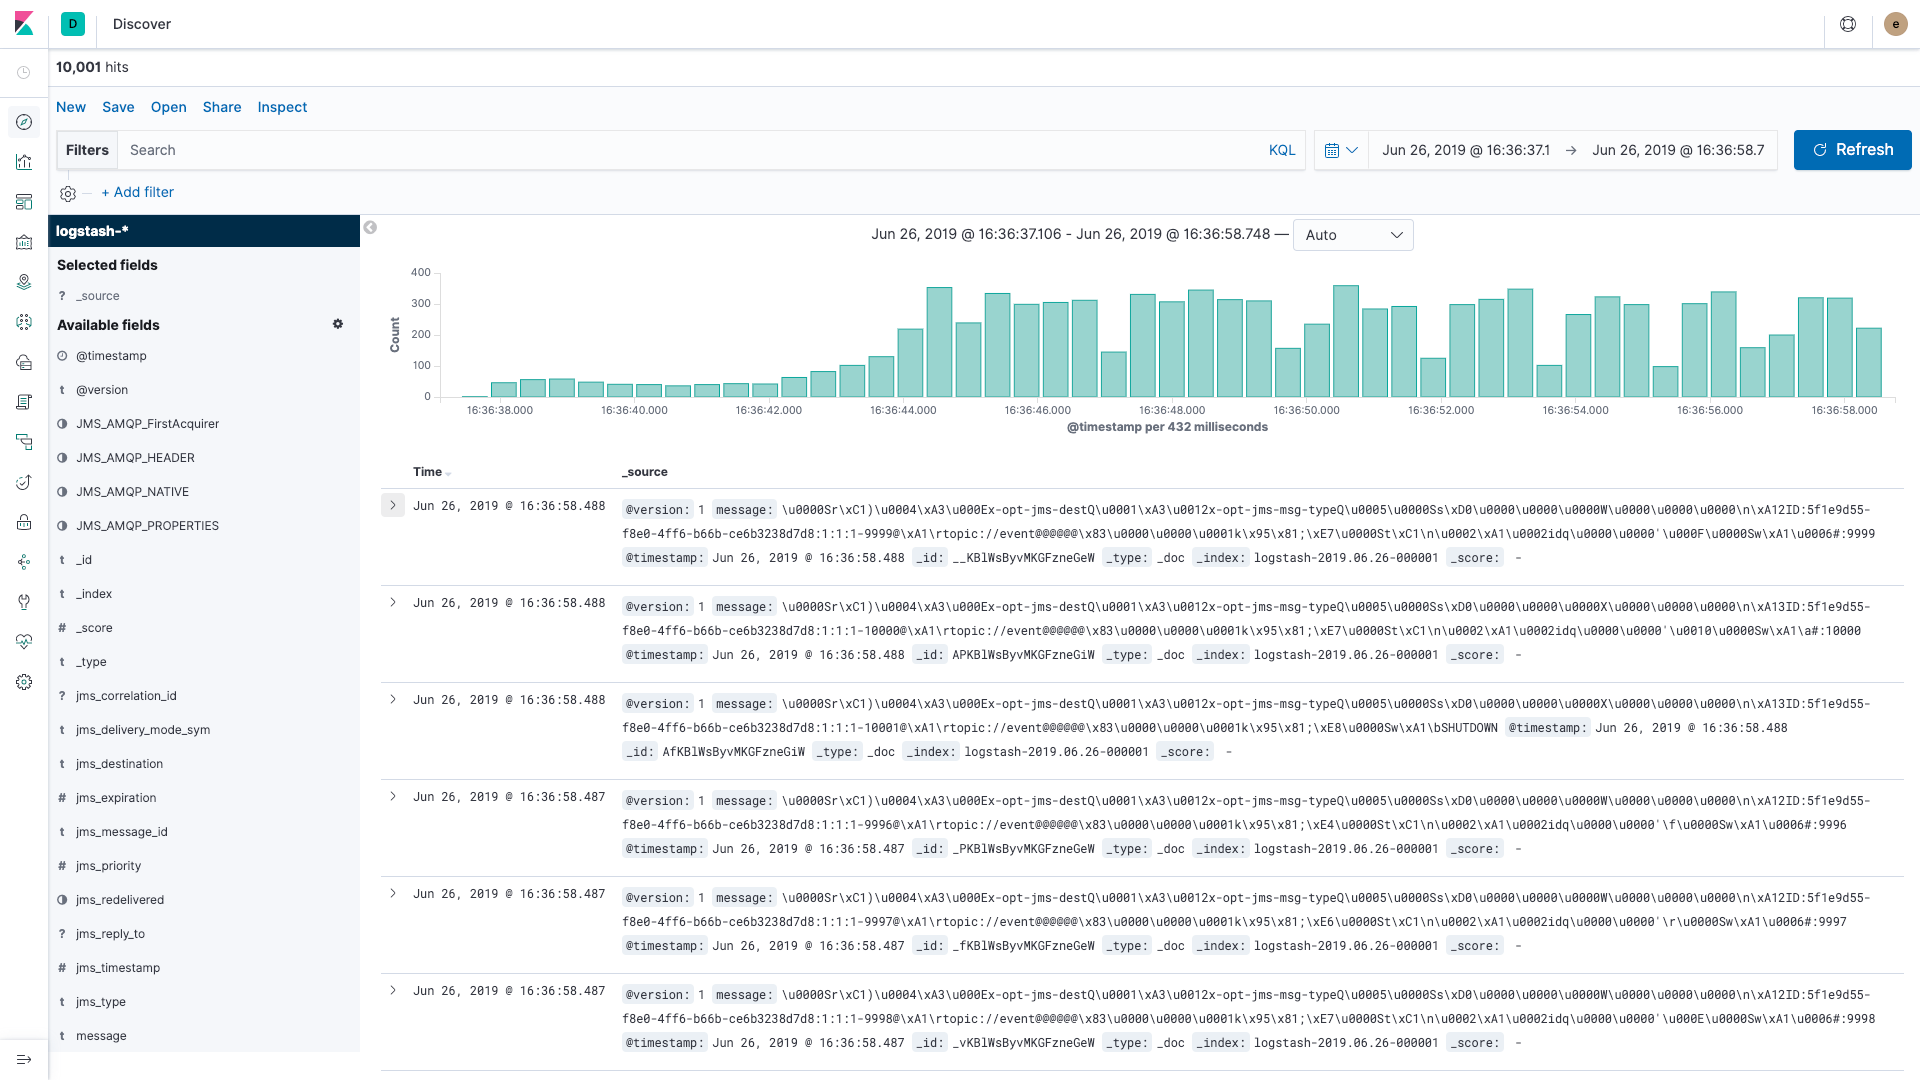
View your data
After making the changes above and restarting Logstash, add some data to your queue and then open Kibana. The Discover app in Kibana will show your data:
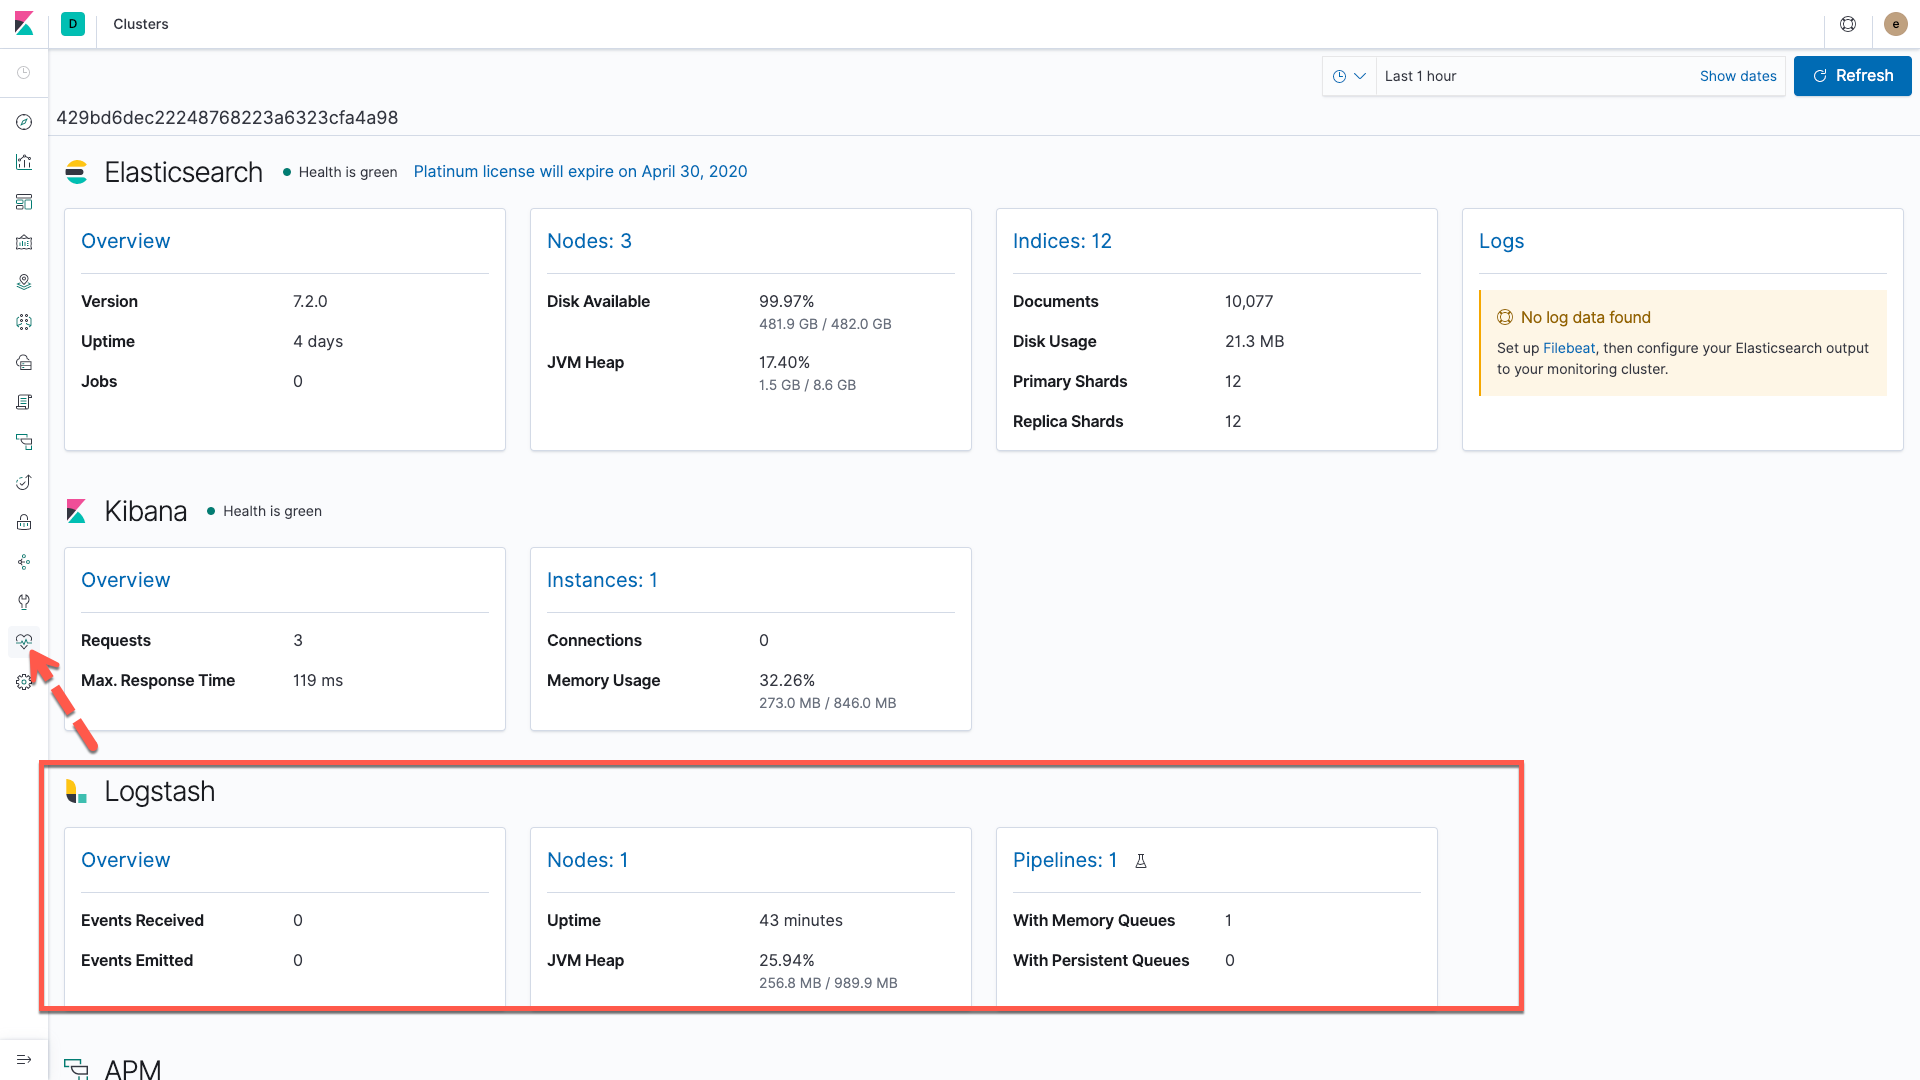
View Monitoring information in Kibana
In Kibana click the Monitoring icon and enable monitoring if it is not already enabled. Monitoring data will be available for the Elastic Stack on this page.
What's next?
- Create some Kibana visualizations and dashboards with your data.
- Evaluate your data with Elastic machine learning recipes
The features below are documented in the JMS input plugin page:
- Configure failover: Modify the broker_url like so to enable failover connections (substituting your hosts and ports). This is an ActiveMQ example; see your vendor docs for failover specifics for your system:
broker_url => 'failover:(tcp://host1:61616,tcp://host2:61616)?initialReconnectDelay=100'
- Configure TLS:
- Modify the broker_url like so (substituting your host and
port):
broker_url => 'ssl://localhost:2014'
- Add JMS provider keystore and truststore details. For
example:
# JMS provider keystore and truststore details
keystore => '/Users/logstash-user/security/keystore.jks'
keystore_password => 'another_secret'
truststore => '/Users/logstash-user/security/truststore.jks'
truststore_password => 'yet_another_secret'
- Modify the broker_url like so (substituting your host and
port):
- Filter the incoming data using the selector option. For
example:
selector => "string_property = 'this' OR int_property < 3"
- Visit us at discuss.elastic.co/c/logstash.