Identifying and monitoring key metrics for your hosts and systems
This post is the first in a three-part series on how to effectively monitor the hosts and systems in your ecosystem, and we're starting with the one you use most: your personal computer. Metrics are a key part of observability, providing insight into the usage of your systems, allowing you to optimize for efficiency and plan for growth.
This series covers using Elastic Observability for :
- Monitoring key metrics from your hosts and systems (this post)
- Consolidating system metrics in the Elastic Stack (step-by-step tutorial)
- Creating and using custom roles for securely ingesting metrics
Let's take a look at the different metrics you should be monitoring.
What are system metrics?
System metrics provide a numeric summary of resources being used or consumed by hosts, virtual machines, cloud instances, or even containers. System metrics tend to be numeric values that are some form of aggregation — count, sum, average, min, or max, just to name a few — of the system resource being measured over time. If you've ever opened Task Manager on a Windows system, Activity Monitor on a Mac, or run top in a terminal or console, you've seen system metrics.
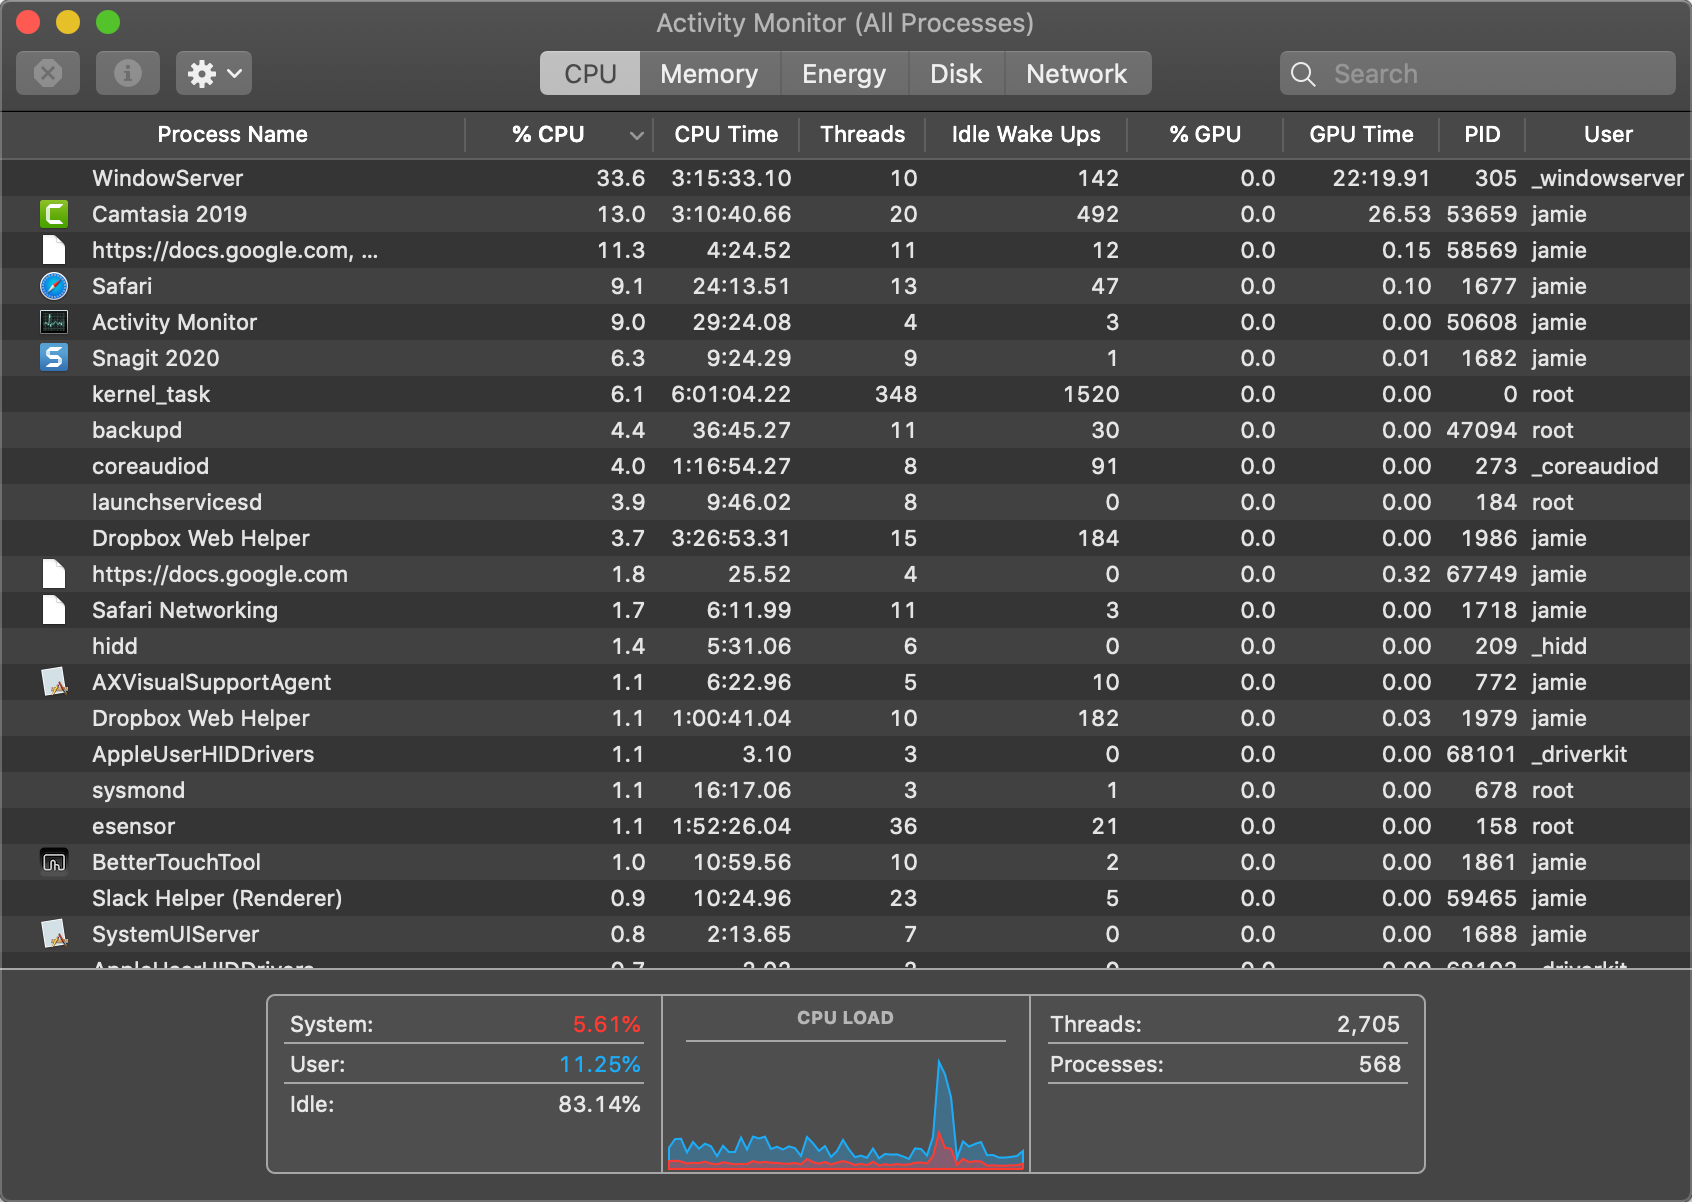
System metrics are time series data — that is, they represent the system state aggregated over fixed intervals. The image above is a screenshot of Activity Monitor on a Mac (dark mode, of course). The rows of data show the aggregated value as of "right now", while the bottom section shows some overall percentages and the CPU Load: a graph of recent history. In this case, it shows the trend and a spike in CPU load but there's no real way to know when that was (keep reading to see how the Elastic Stack provides granular insights into these metrics). At the top of the window there are additional views for memory, energy, disk, and network. The different tabs really act as a different lens to look at the data through, each providing different "summary views" at the bottom.
Key metrics for system monitoring
We've already alluded to some of the key things that you want to be monitoring when gathering system metrics — stats for CPU, memory, disk, and network activity. When I'm in a meeting and the fan on my MacBook sounds like a Harrier getting ready to lift off, a quick peek at the Activity Monitor will likely show that Zoom is at the top of that CPU chart, or when I am working in Photoshop I wouldn't be surprised to see that at the top of my memory usage.
These metrics don't each exist as single numbers, but rather tend to use multiple components to tell the whole story. Taking a closer look at the summary at the bottom of the memory pane from my Activity Monitor we see that these broad buckets (CPU, memory, etc.) are further broken down to a finer granularity:
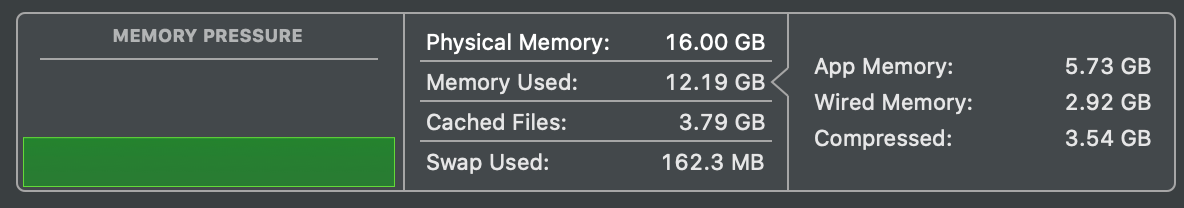
It's not just the amount of memory used, but how it's being used, what's using it, and what's available (which is not much).
The story is not just about gathering these metrics. Earlier I mentioned that metrics are time series data, which would allow us to perform additional analytics on the data. If we gather these metrics we can start to correlate CPU usage against memory utilization, or visualize a historical view of CPU utilization for each host in our infrastructure to figure out which machines might benefit from an upgrade (my laptop's pretty old, hint hint).
So far we have only looked at the data from one host. If you have multiple hosts or VMs — tens, hundreds, even thousands — looking at the individual activity monitor for each one is futile, so we would need to use different tools for that.
Benefits of centralizing infrastructure metrics
We tend to know when something doesn't feel right on a computer — sluggish responses, slow network traffic, or again with that jet-engine fan — but built-in activity monitors and task managers don't have the ability to cross-reference issues. Does high memory utilization impact my CPU? Was that network slowdown actually caused by high CPU usage? What if we want to track per-process CPU usage throughout the day, or see overall CPU utilization beyond whatever time frame shows up in the task manager?
When we start to aggregate information from multiple hosts we can even see trends and leverage automation to notify us when there are problems, while machine learning can detect when things are out of normal ranges (after all, most systems aren't under a constant load 24x7). Next, let's dive in and go beyond these single viewer tools so we can get these benefits, and more.
Collecting system metrics
We've seen the "what" and the "why", now let's look at a couple of options for the "how" on gathering system and infrastructure metrics.
Collect system metrics with built-in tools
The task-manager type tools are good at getting a quick snapshot of a single system's metrics but aren't optimized for gathering that data. For that, we would want to use command line tools geared towards exporting snapshots of the data, preferably over a specified period(s) of time. That's where the *stat tools come into play. Programs like vmstat (vm_stat on a Mac), which shows memory statistics, iostat, which shows I/O stats, or nettop on the Mac, which captures network usage. These tools usually have command line flags to control the frequency of checks and which information to include or exclude. For example, if I run top -n 10 on my Mac it will show me the top ten processes running based on the highlighted sorting column, CPU:
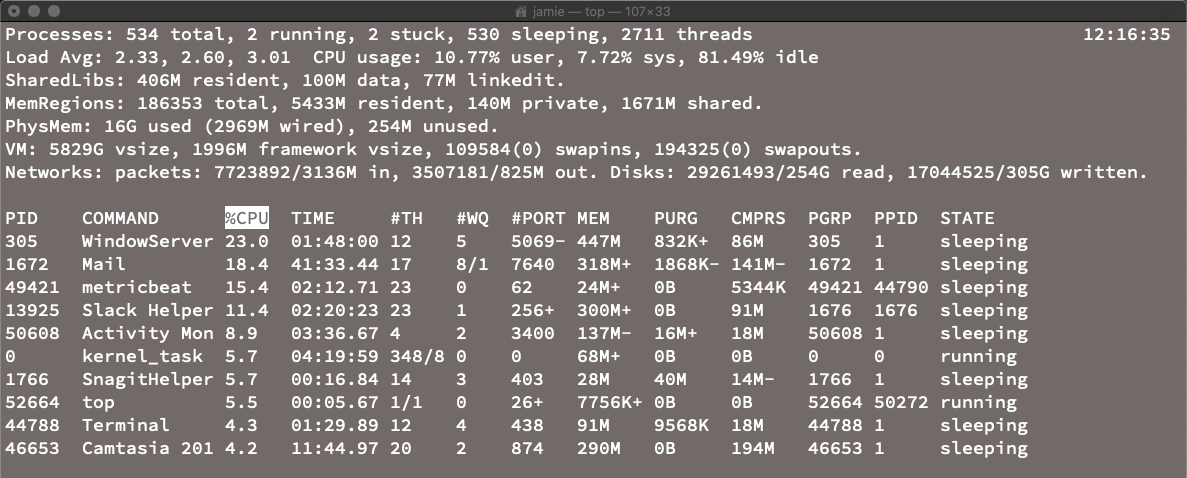
That's pretty readable as a snapshot but not formatted for capturing and storing long term.
The vm_stat mentioned earlier provides a snapshot of memory usage. Setting up vm_stat to grab the memory stats every five seconds is pretty straightforward (vm_stat 5). Unfortunately, it doesn't include a timestamp, and there's this added nuance that it displays the values in 4k chunks (page size of 4096 bytes):
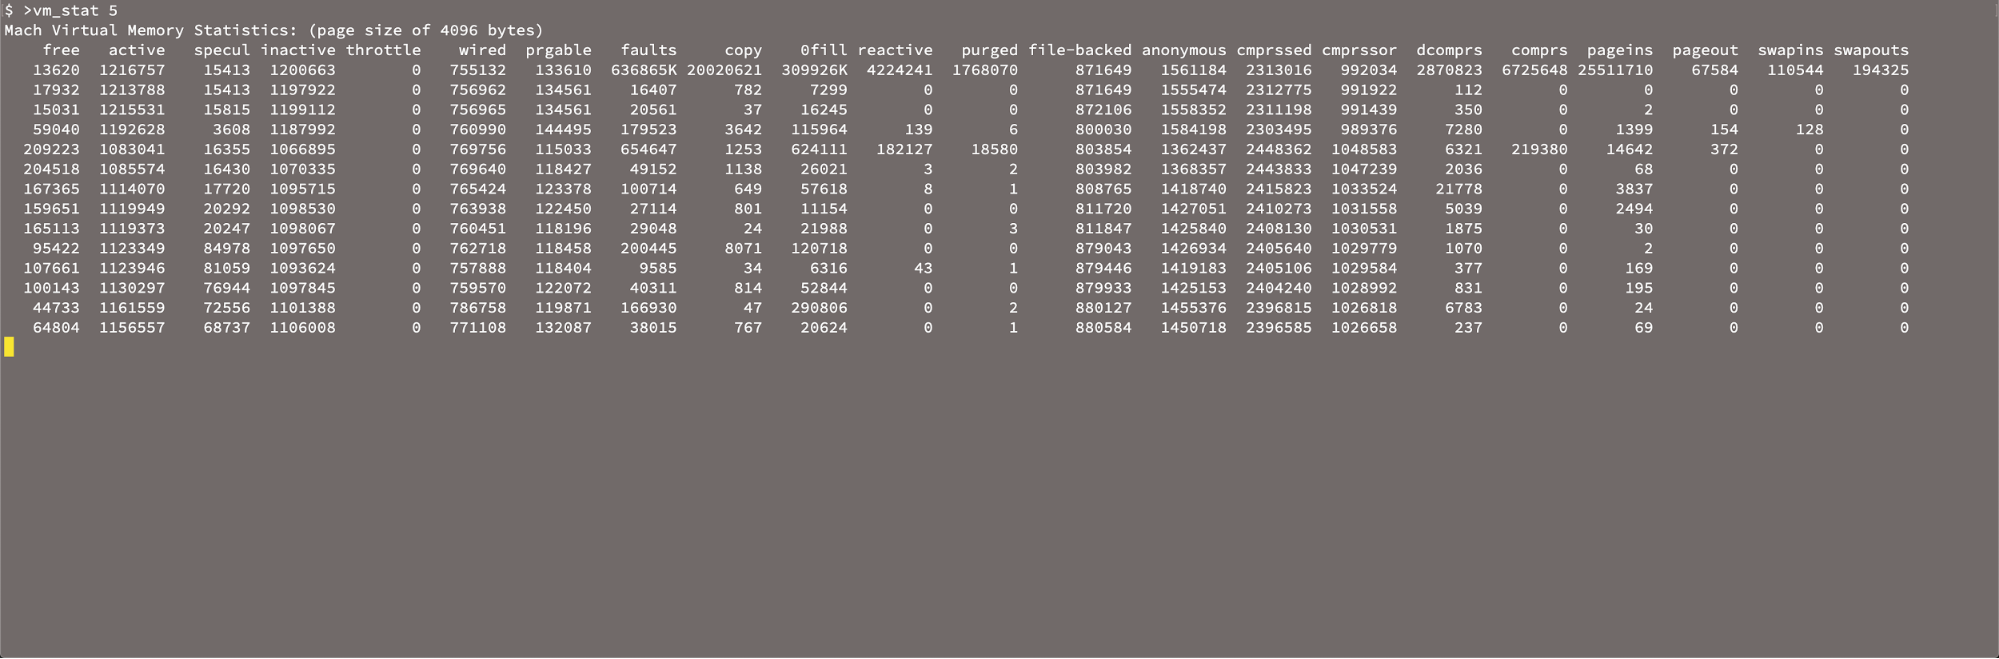
We would need to do some massaging of the data and find a way to capture or generate a timestamp as well.
Most of these tools have slightly different ways to specify frequency and control of fields, so you'll likely spend some time in their respective manual pages to get the data just how you want it when you consolidate for multiple hosts.
Wrapping up
In this post we've walked through some of the fundamentals of system monitoring. We've looked at different tools for doing this, both on the command line and with built-in graphical tools, and touched on some of the issues we will run into when trying to gather this data for the longer term. Try running some of these programs on your machine and see if you can spot any problem applications.
In the next post, we'll address that last problem, and provide some simple steps to help you centralize your infrastructure metrics with the Elastic Stack so you can plan for scale.
Ready to get started? Sign up for a free trial of Elasticsearch Service on Elastic Cloud, or download the Elastic Stack and host it yourself.
Up next: Centralizing infrastructure metrics and planning for scale with the Elastic Stack