Ingesting metrics securely using role-based access control (RBAC)
This is the final post in our series on monitoring system metrics with the Elastic Stack. Here's the full list of posts:
- Monitoring key metrics from your hosts and systems
- Consolidating system metrics in the Elastic Stack with a step-by-step tutorial
- Creating and using custom roles for securely ingesting metrics (this post)
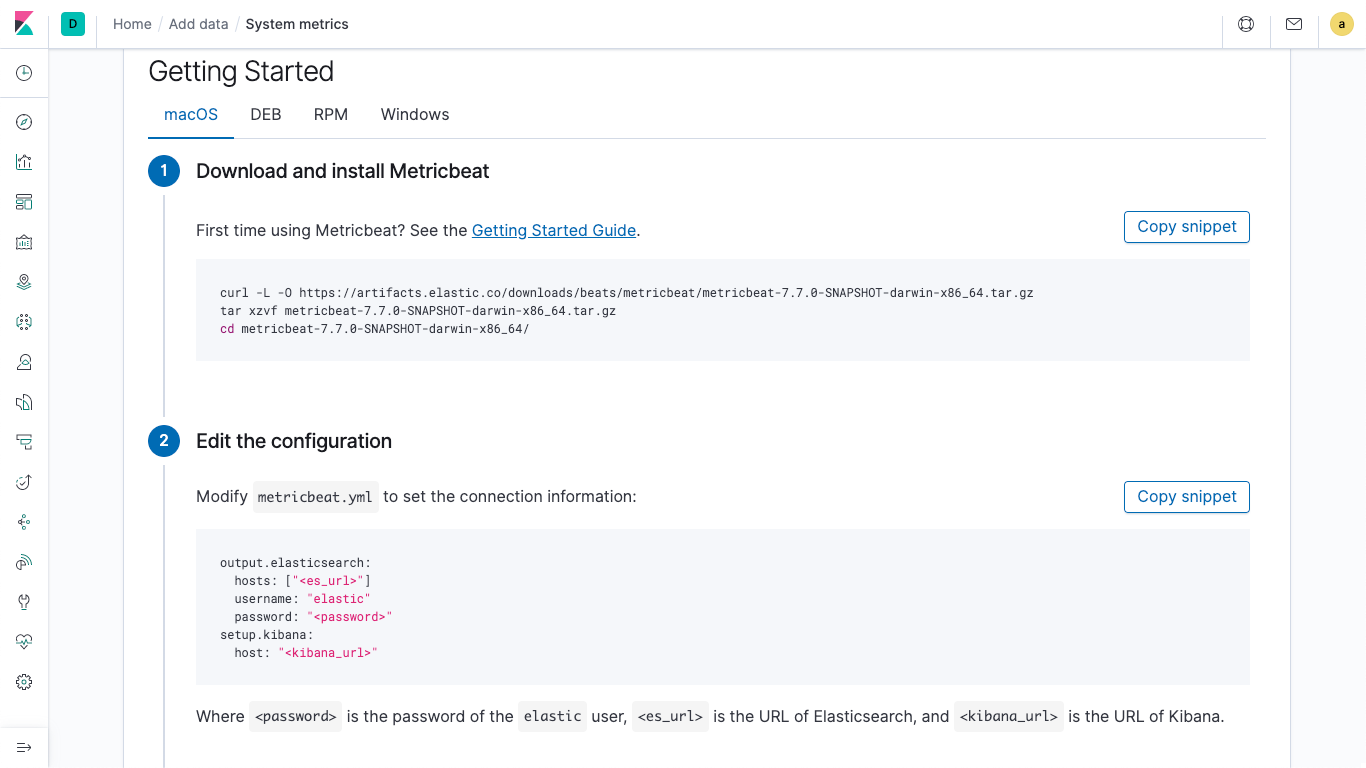
Now that we've identified the metrics we want and consolidated them into the Elastic Stack, we're going to make sure they stay safe in Elasticsearch. The instructions for setting up Metricbeat (in the screenshot below) are spelled out in a nice tutorial in Kibana.
You may notice that they get us set up using a "superuser". In this section, rather than using the superuser, we'll follow best practices to create a role and user with the minimum set of permissions to act as our ingest user.
Setting up users and roles
By creating roles specific to a purpose, we can make sure that the corresponding users don't have more permissions than necessary. In the instructions, we performed two steps: setup and execution. The permissions needed for each step differ, so we will set up two roles (metricbeat_setup and metricbeat_writer) and two users (metricbeat-setup and metricbeat-writer). Of course, this is just an example — you could just as easily combine the roles, or just create one user with both roles. For more detailed information on the exact details, you can check out the Metricbeat documentation.
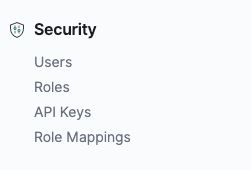
To start, navigate to the management pane in Kibana — that's the little gear icon near the bottom left side. Then scroll down to until you see the "Security" section:
Creating the role and a user for Metricbeat setup
Metricbeat setup role
We'll start with the setup side of things, and create that role and a corresponding user.
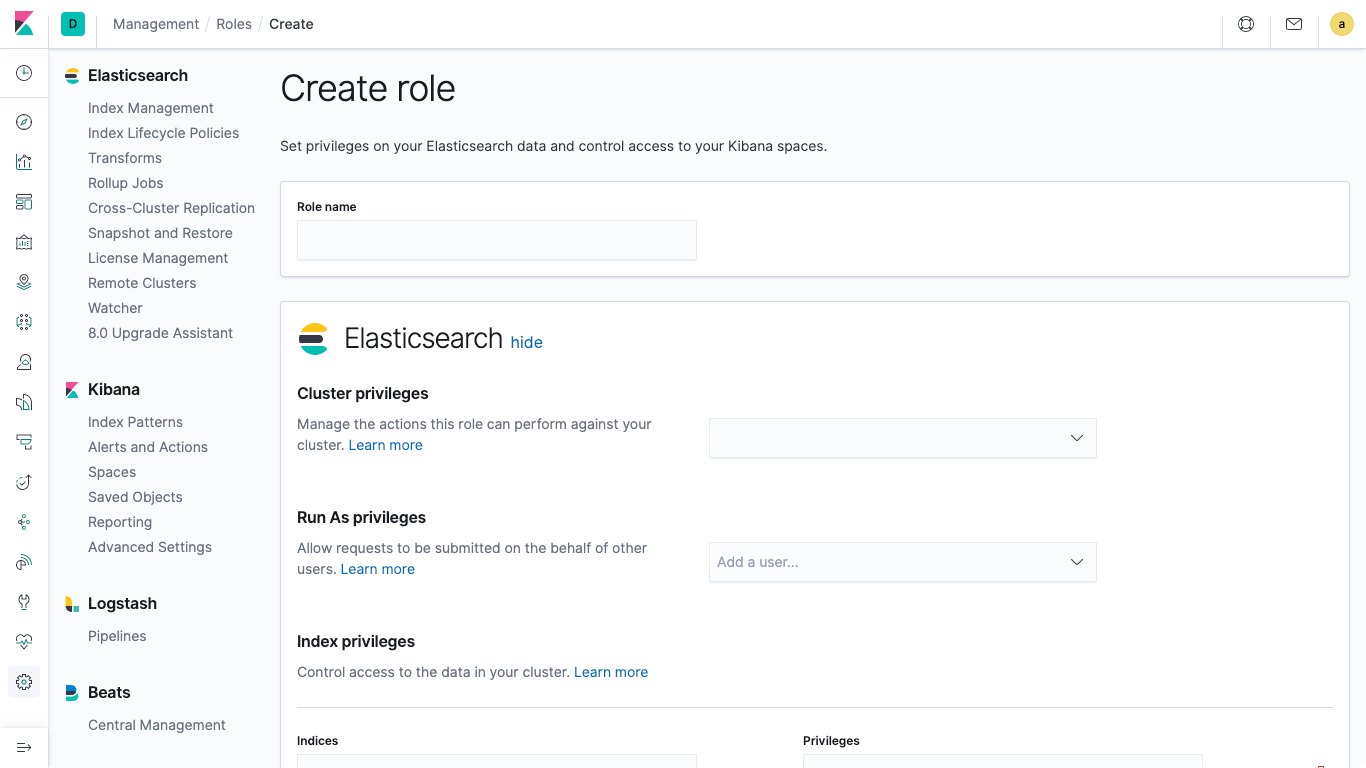
Click on Roles, in the Security section, then select Create Role. You should end up with a blank form that looks like this:
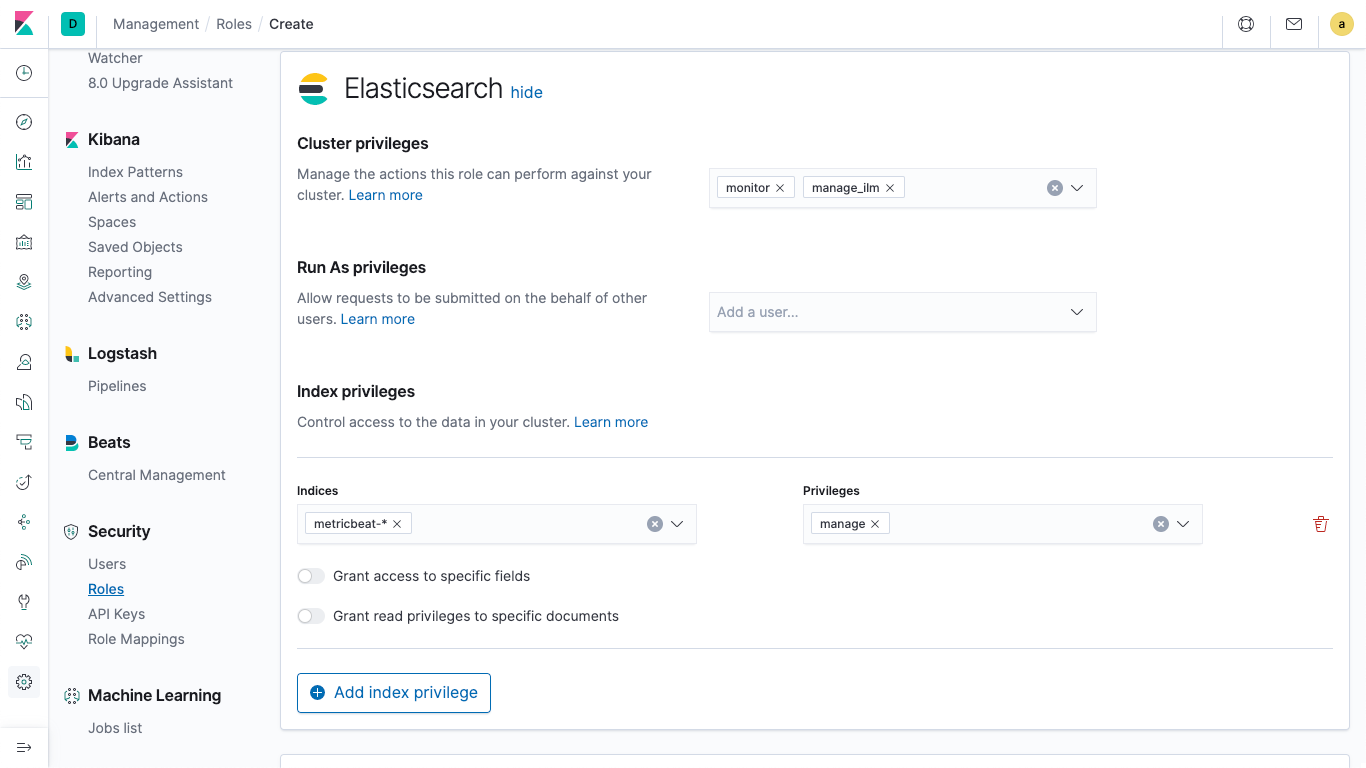
Name the role metricbeat_setup and set the various fields with values according to the Metricbeat setup privileges documentation.
- Name: metricbeat_setup
- Cluster privileges: monitor, manage_ilm
- Index privileges section:
- Indices: metricbeat-* (It's alright if it warns you that doesn't match any options)
- Privileges: manage
(For more information on what these do, check out the Security privileges documentation)
Your form should look like this:
Then scroll down and click on the Create role button and you'll see the new role in the list.
Metricbeat setup User
Next, we're going to create a metricbeat_setup user and assign our new role. Under the same Security section, select Users, then click on Create user. I called mine metricbeat-setup, gave it a supersecret password, and assigned it the metricbeat_setup role that we just created. Additionally, we want to add a few other out-of-the-box roles for this user:
- kibana_admin
- ingest_admin
- beats_admin
When we're ready the form should look like this:
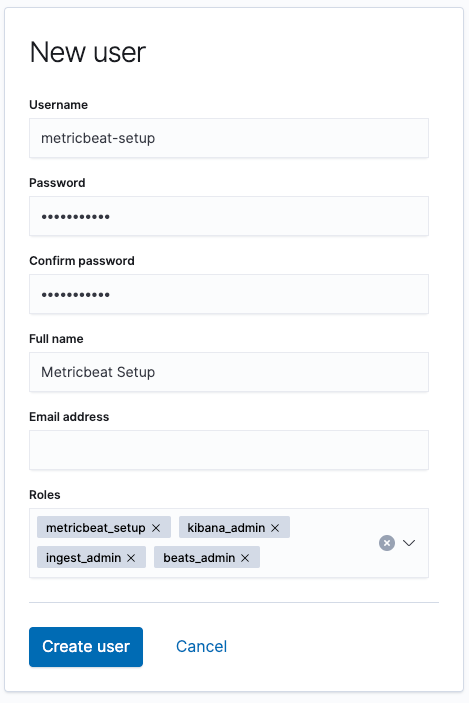
We hit the Create user button and now we can use this instead of our superuser for the setup phase.
We'll show how to use our new metricbeat_setup user a bit later.
Creating the role and a user for Metricbeat writer
Now that we've got the setup side ready, it's time to add the writer. The writer doesn't need as many privileges as the setup user, so we should set up an appropriate role for the writer.
Metricbeat writer role
We repeat similar steps as for the metricbeat_setup role. Jump back to the roles list, then click Create role. Name the role metricbeat_writer and set up the following fields with the following values as per the Metricbeat documentation:
- Name: metricbeat_writer
- Cluster privileges: monitor, read_ilm
- Index privileges section:
- Indices: metricbeat-* (It's alright if it warns you that doesn't match any options)
- Privileges: create_doc, view_index_metadata, create_index
(For more information on what these do, check out the Security privileges documentation)
Your settings should look like this:
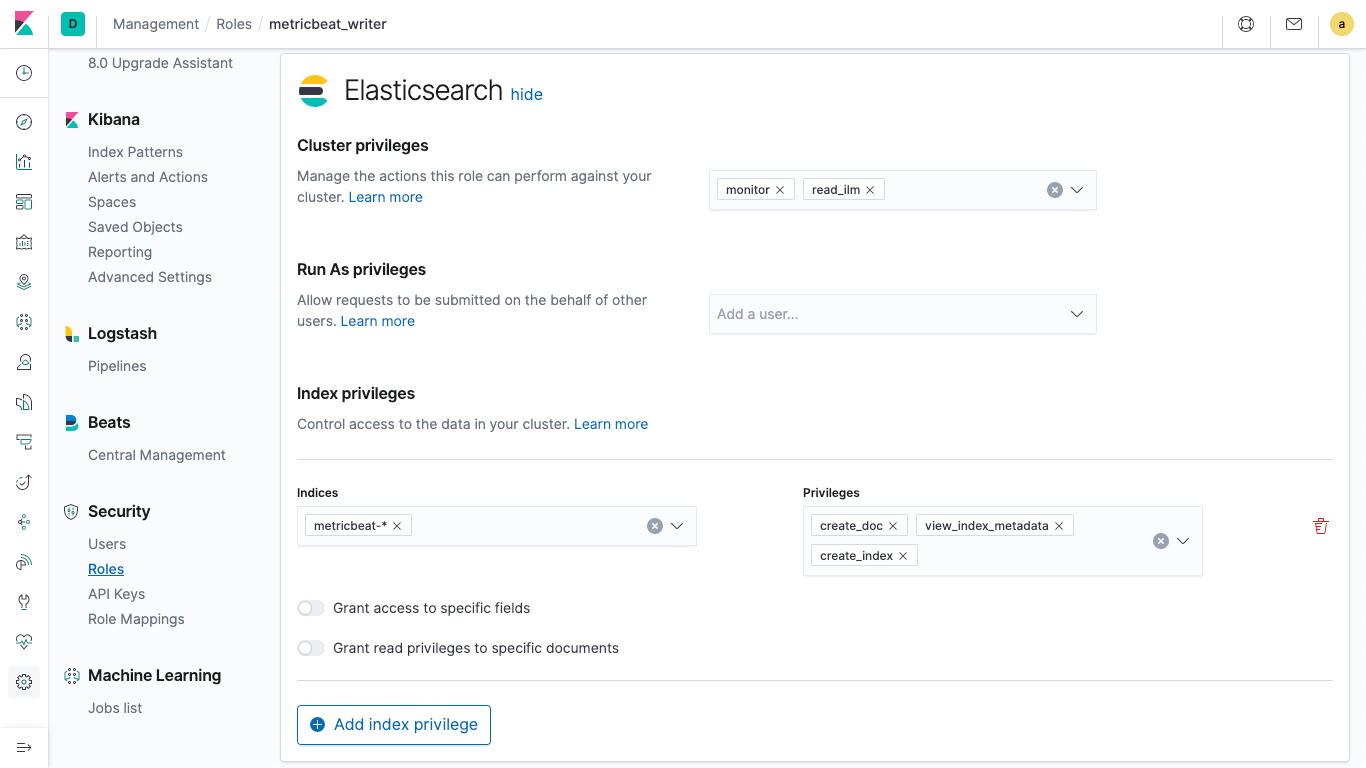
Once you've got that, scroll down and click the Create role button. We now have a role set up with the minimal privileges needed to capture our infrastructure metrics from Metricbeat.
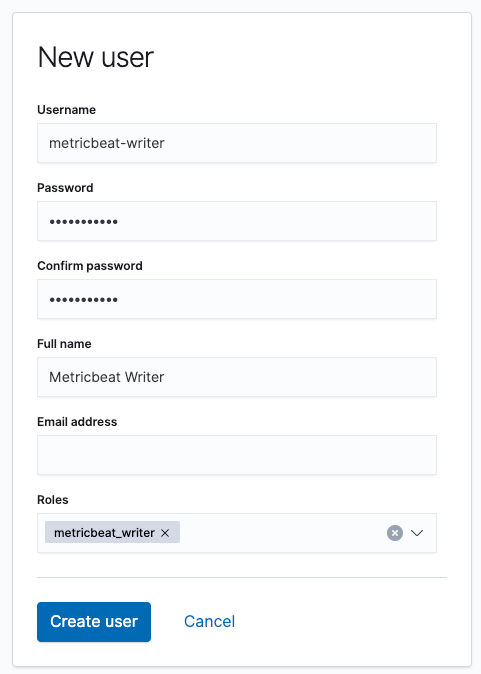
Creating a user for the Metricbeat writer
Repeat the steps from the setup side for and create a writer user. In the sidebar, navigate to Security | Users, then click on Create user. I called mine metricbeat-writer, gave it a differentsecret password, and assigned it the metricbeat_writer role that we just created (unlike the setup side we only need the one role for the writer user). We hit the Create user button and now we can use this instead of our superuser.
Using our new user instead of the superuser
We could go and simply hardcode our new credentials in our configuration from earlier, which would look like this for Elastic Cloud:
cloud.auth:metricbeat-writer:supersecret
Or this for the downloaded version:
output.elasticsearch:
  hosts: ["localhost:9200"]
  username: "metricbeat-writer"
  password: "supersecret"
There is, however, a better way, and that is to leverage the Metricbeat keystore.
Setting up a keystore
Taking a few more (simple) steps and leveraging a keystore will help us avoid saving credentials in clear text.
In that same Metricbeat directory (you'll probably need to ctrl-C to stop Metricbeat if it's still running) we need to bootstrap our keystore by running ./metricbeat keystore create, which will output:
Created metricbeat keystore
Assuming that you didn't already create one.
We are going to add two keys: one for the user, and one for the password. We'll call them METRICBEAT_WRITER_USER and METRICBEAT_WRITER_PASSWORD, respectively, using the create subcommand. The subcommand takes a parameter for the name of the key, then prompts for the value. Running ./metricbeat keystore add METRICBEAT_WRITER_USER prompts me to silently enter a value (which I add as metricbeat-writer), then responds with
Successfully updated the keystore
We repeat this process for METRICBEAT_WRITER_PASSWORD and its value, supersecret. Using these in the configuration looks just like expanding environment variables: ${KEY_NAME},
I can verify that the two keys exist by executing /metricbeat keystore list which prints the keys stored in the keystore, but not the values:
METRICBEAT_WRITER_PASSWORD
METRICBEAT_WRITER_USER
And repeat with the setup user and password. We are ready to use the keystore!
Leveraging the keystore
When using the keystore you can access the values by referencing the respective key name, in the form ${KEY_NAME}. With the keystore set up and ready, our configuration would look like this for cloud:
cloud.auth:${METRICBEAT_WRITER_USER}:${METRICBEAT_WRITER_PASSWORD}
Or this for the downloaded version:
output.elasticsearch:
  hosts: ["localhost:9200"]
  username: "${METRICBEAT_WRITER_USER}"
  password: "${METRICBEAT_WRITER_PASSWORD}"
This is much nicer than having the credentials in plain text. You could even use the keystore for the cloud.id or Elasticsearch host if you choose.
Recall that the permissions for the setup role were different from the writer role. The above configuration wouldn't work to run the setup step (./metricbeat setup). We don't need to change the config for the setup step, instead, we can override the values on the command line. For a cloud deployment, that would look like this (note the single quotes around the ${KEY_NAMES} — that's so the shell doesn't expand the variables):
./metricbeat setup -E cloud.auth='${METRICBEAT_SETUP_USER}:${METRICBEAT_SETUP_PASSWORD}'
Or, in the case of a local deploy, we'd override the username and password for both the Elasticsearch and Kibana credentials (the metricbeat_writer doesn't need Kibana credentials):
./metricbeat setup -E setup.kibana.username=admin -E setup.kibana.password=changeme -E output.elasticsearch.username=admin -E output.elasticsearch.password=changeme
Now we can simply run the same ./metricbeat -e to start up again and the system will use the values in the keystore.
The keystore is a pretty powerful way to hide credentials in your environment. You can use it for usernames, passwords, or even hosts.
Monitor your metrics and keep them secure
Get started monitoring your systems and infrastructure today. Sign up for a free trial of Elasticsearch Service on Elastic Cloud, or download the Elastic Stack and host it yourself. Keep increasing your observability with Elastic Logs, Elastic Uptime, and Elastic APM. If you run into any hurdles or have questions, jump over to our Discuss forums — we're here to help.