How to display data as a percentage in Kibana visualizations
Using percentages when performing data analytics is an essential approach to effective numeric comparison, especially when the data in question demonstrates drastically different sample sizes or totals. Percentages allow for a quick and accurate understanding of how much data sums have changed across a dimensional category like a range of time, geographic regions, product lines, etc.
In this blog post, we’ll be going through a few examples of how to calculate percentages in Kibana with commonly used visualizations including a pie chart, a single number metric, a table, and a time series with TSVB (the time series data visualizer).
For this blog, we’ll use the flights and ecommerce sample data sets that are available with Kibana. Using that data, you will learn to answer these questions:
- What is the percentage of on-time flights?
- What is the ratio of each delay type over time?
- What is the change in total sales week over week?
Before getting started, though, you’ll need to install the flights and ecommerce sample data. You can install the sample data in your own cluster (6.5 or later), or spin up a 14-day free trial of our Elasticsearch Service.
What is the percentage of on-time flights?
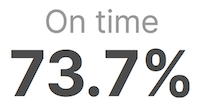
Your airline customer wants to put a big number on a dashboard that shows how they are performing against their on-time goals. Each document in the sample kibana_sample_data_flights index represents a single flight, so to calculate a percentage you need to divide the number of documents representing "on-time flights" over the number of flights.
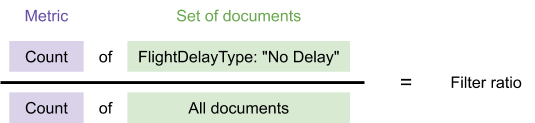
Because of this division, you should use the TSVB metric visualization which has the Filter ratio calculation. Filter ratio divides the same metric on two sets of documents and returns a number. The only requirement for TSVB use is a time field on the index, which is available on the kibana_sample_data_flights index.
To configure this in TSVB in Kibana 7.4 and later, you will first select your visualization type and data set, and then configure the aggregations used to display the percentage above.
To choose the visualization type and data set:
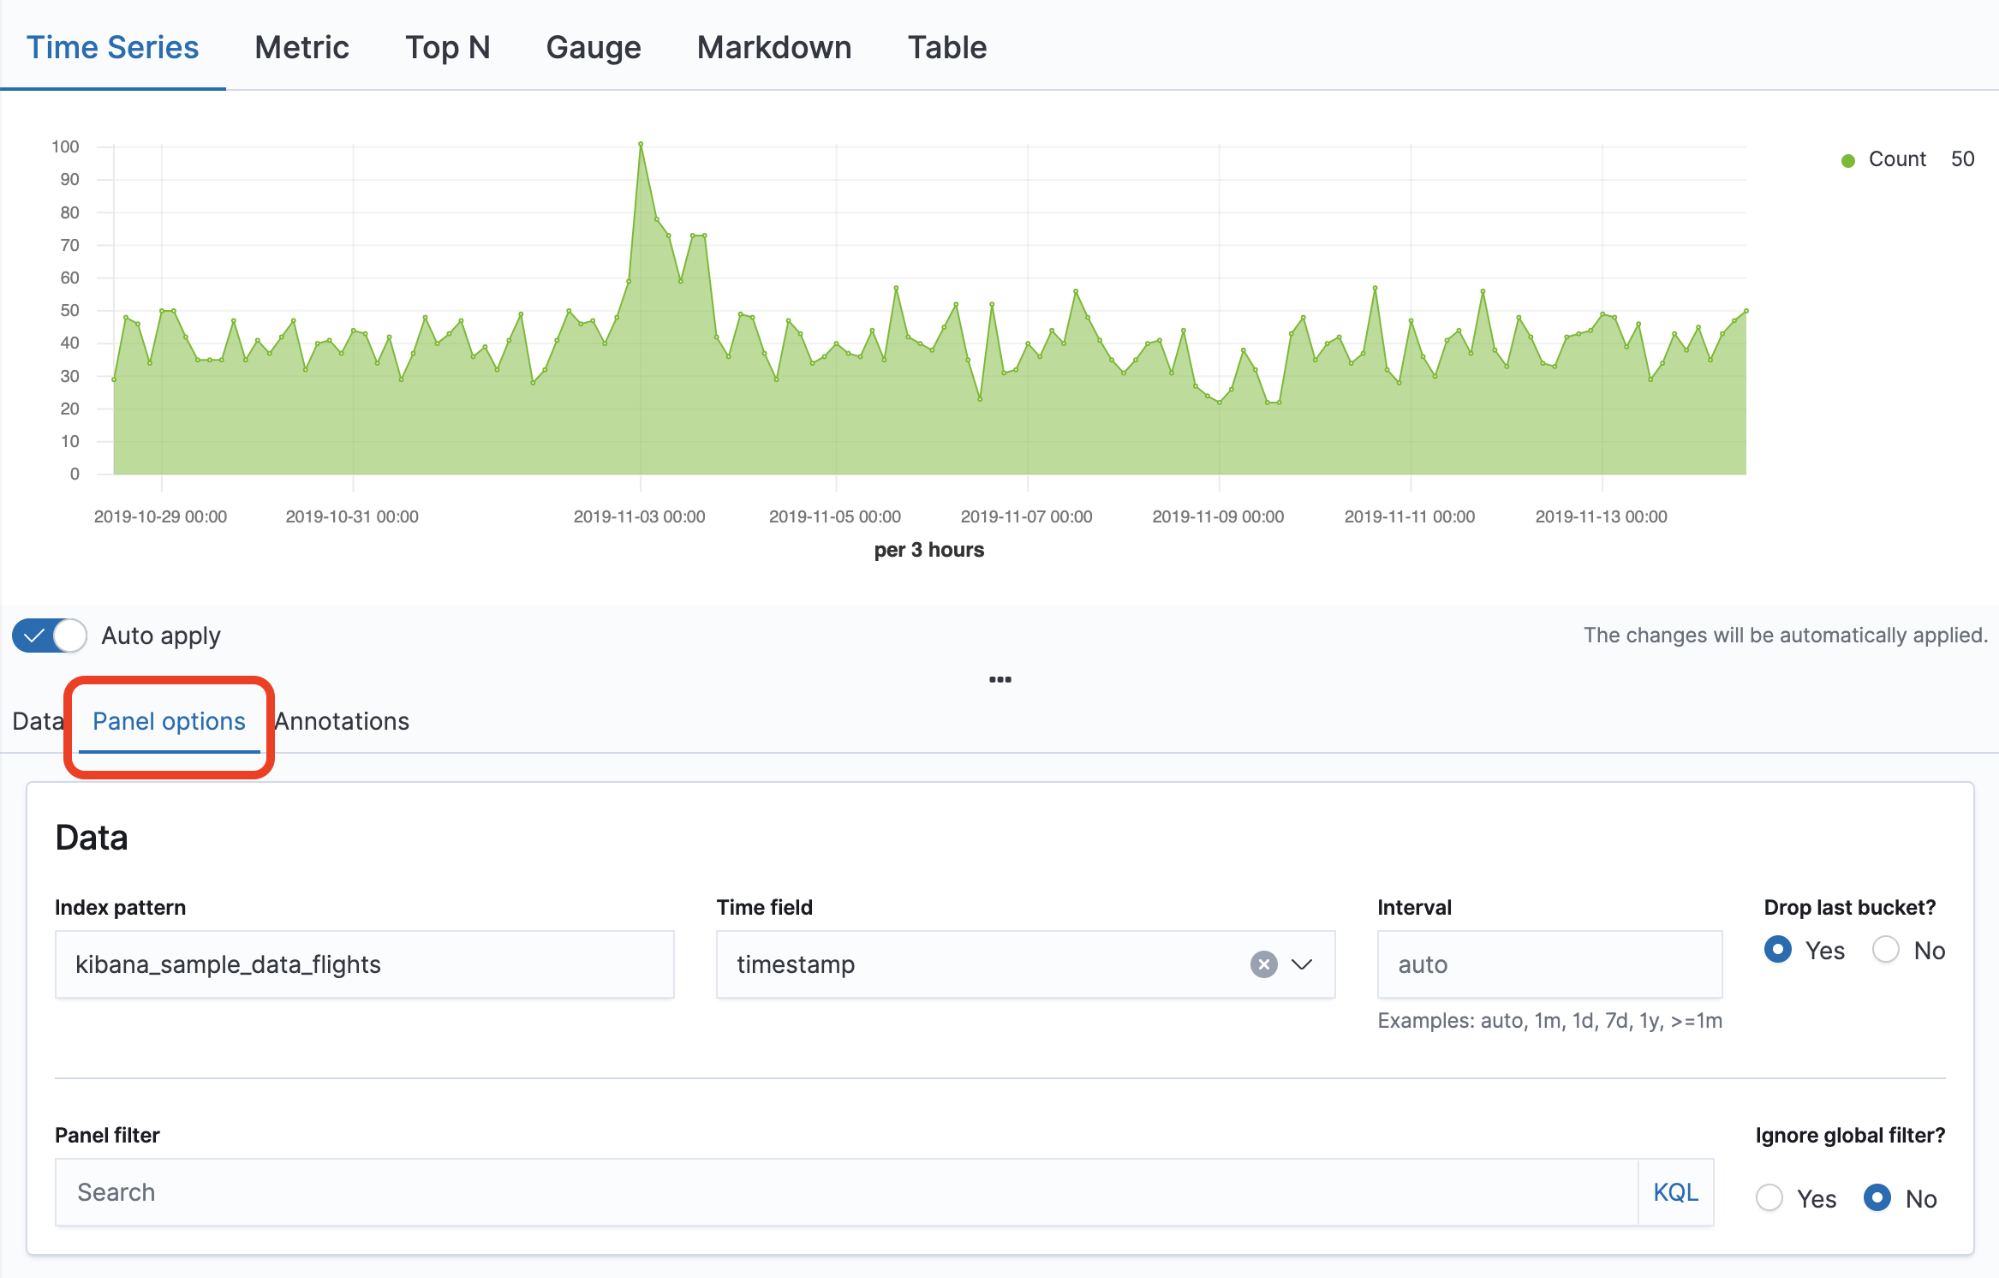
- Go to TSVB, and choose the Metric tab:
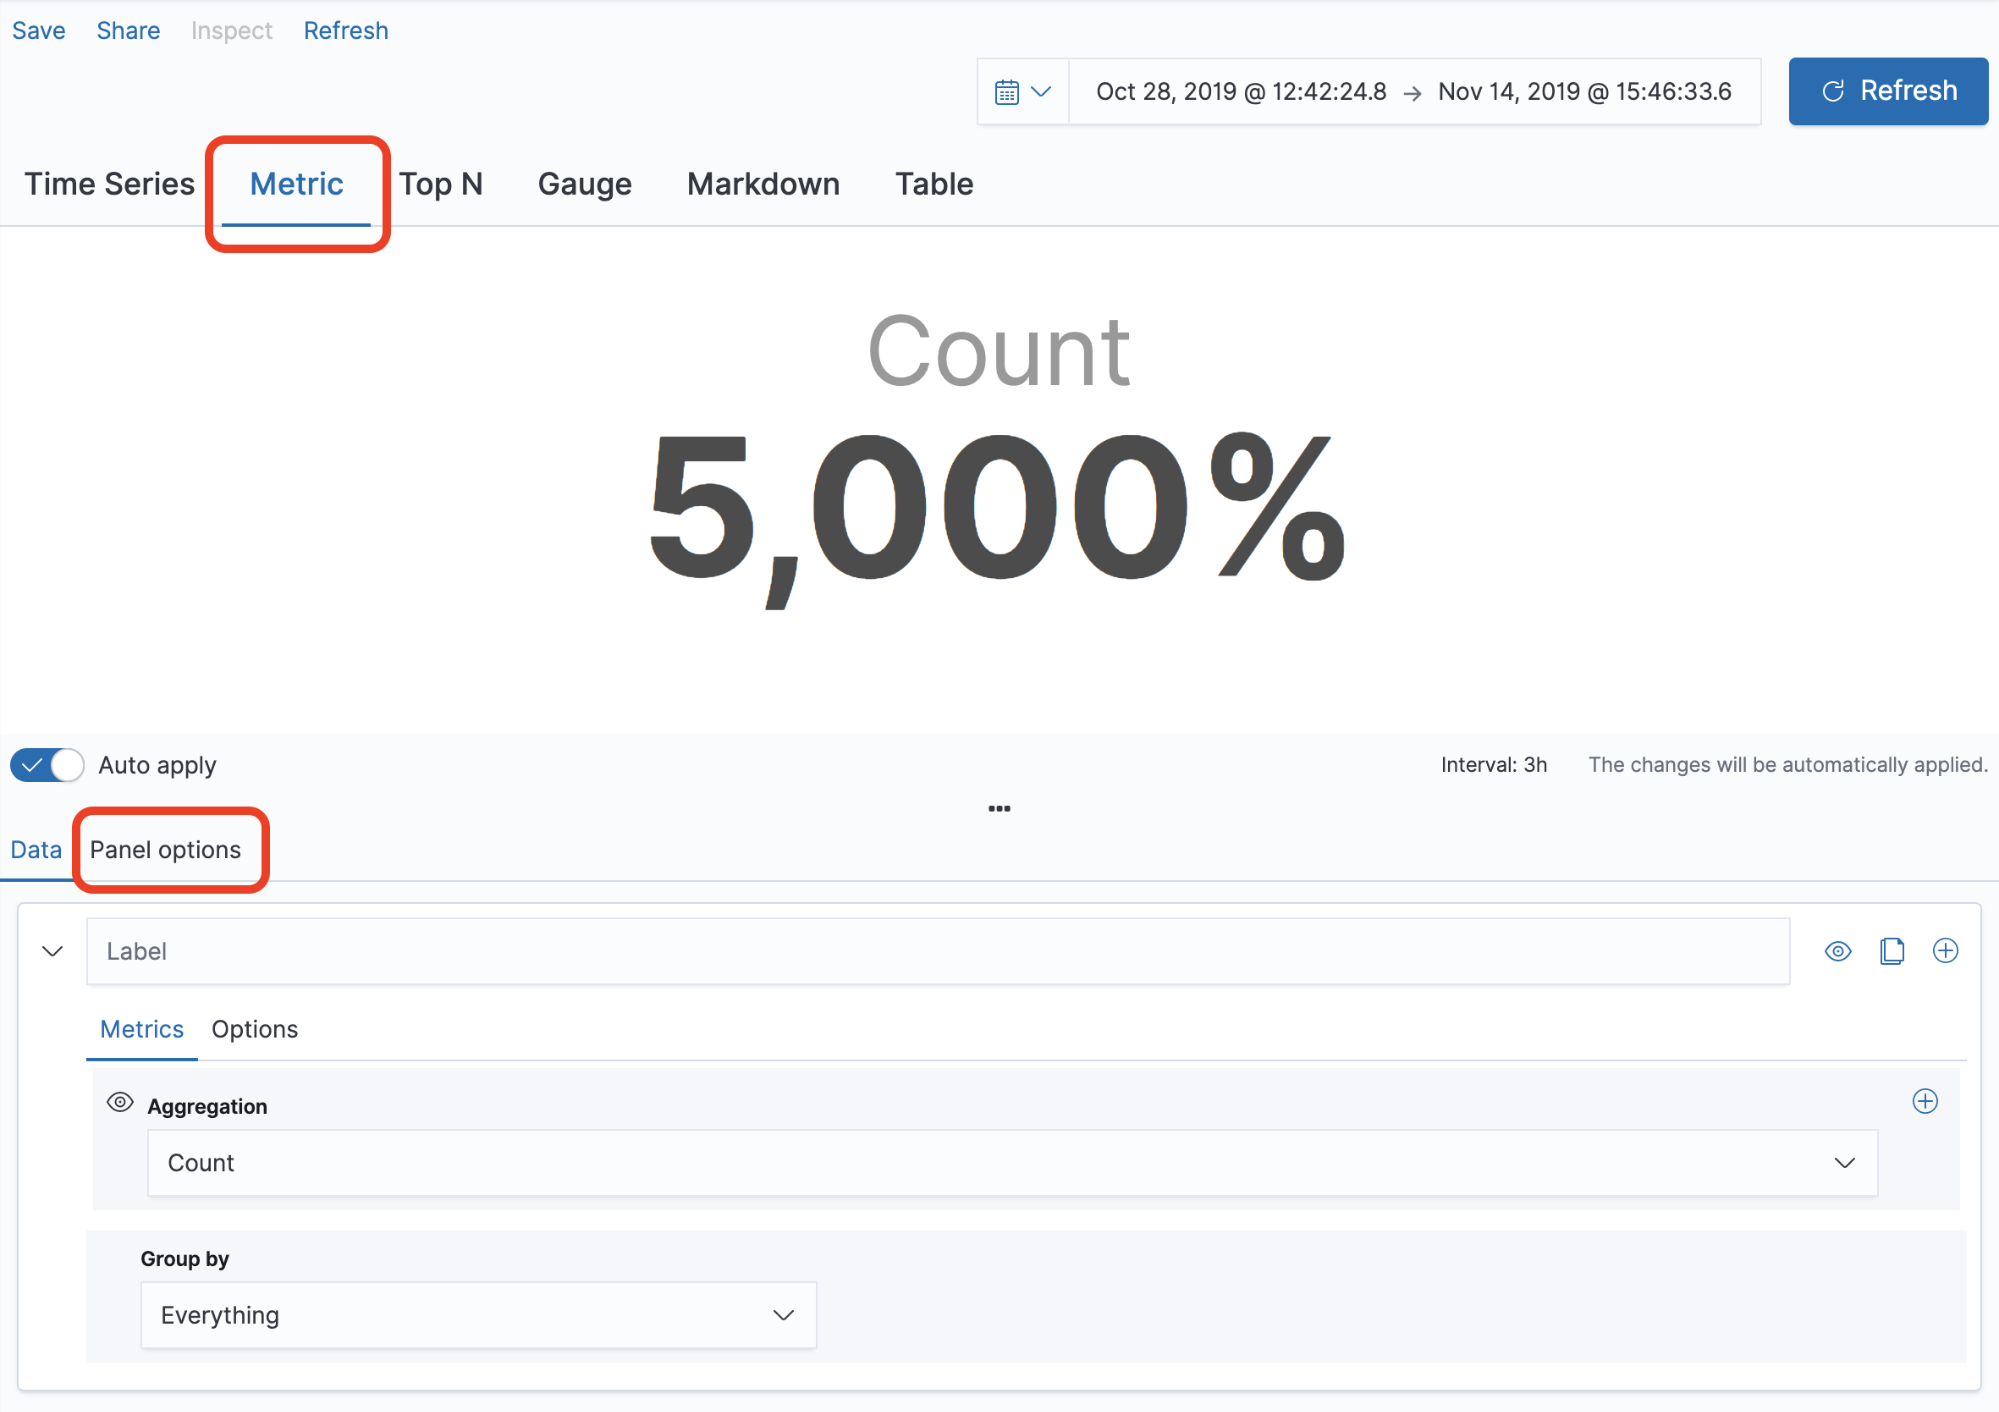
- Select the Panel options tab:
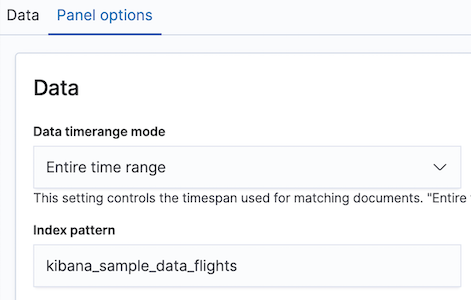
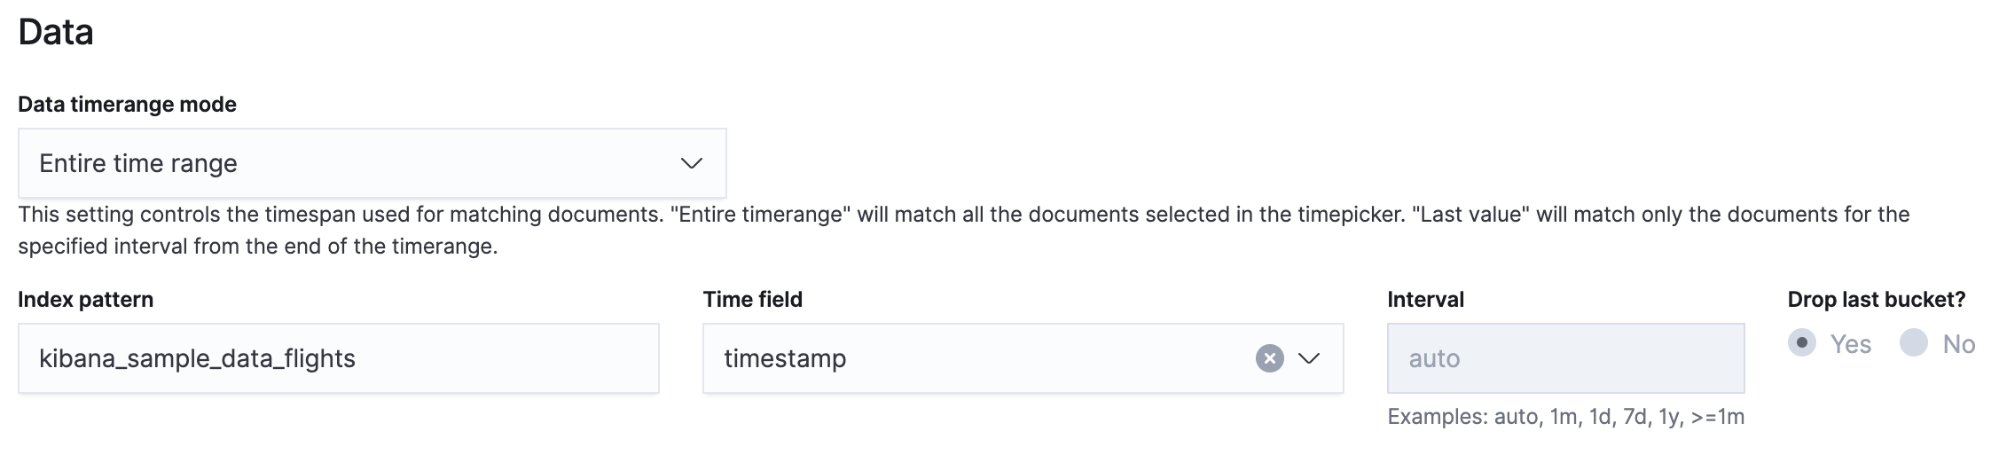
- Set the Data timerange mode to Entire time range instead of using only the last interval. Note: This setting is only available in Kibana 7.4 and later. On older versions, you can set the date interval to a large value instead.
- Type in kibana_sample_data_flights as the index. Set the time field to timestamp.
Now that you've selected the index and time range, you can configure the data being shown.
- Go back to the Data tab and use Filter Ratio to calculate the percentage of a specific value, like FlightDelayType: "No Delay".
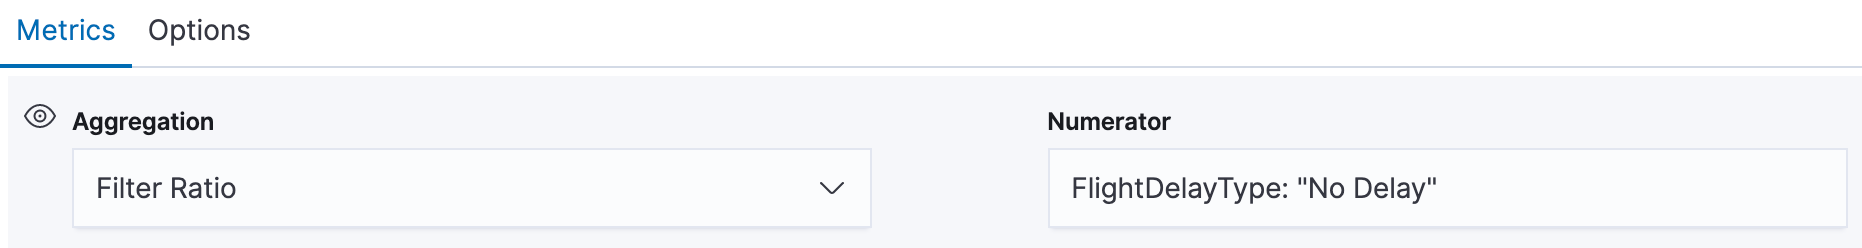
- Filter Ratio selects two sets of documents using query string syntax.
- Go to the Options tab and select the Percent formatter.
- If the default 4 digits of precision is too high for you, use a custom format string to truncate the digits.
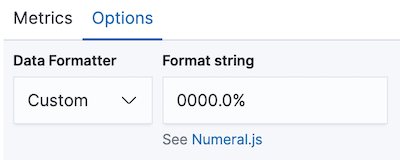
- If the default 4 digits of precision is too high for you, use a custom format string to truncate the digits.
To compare multiple values instead of a single value, there are two more visualizations in Kibana that you can use. If you use a bucket aggregation to select the values for comparison, you can use a pie chart or a table to convert each value to a percentage.
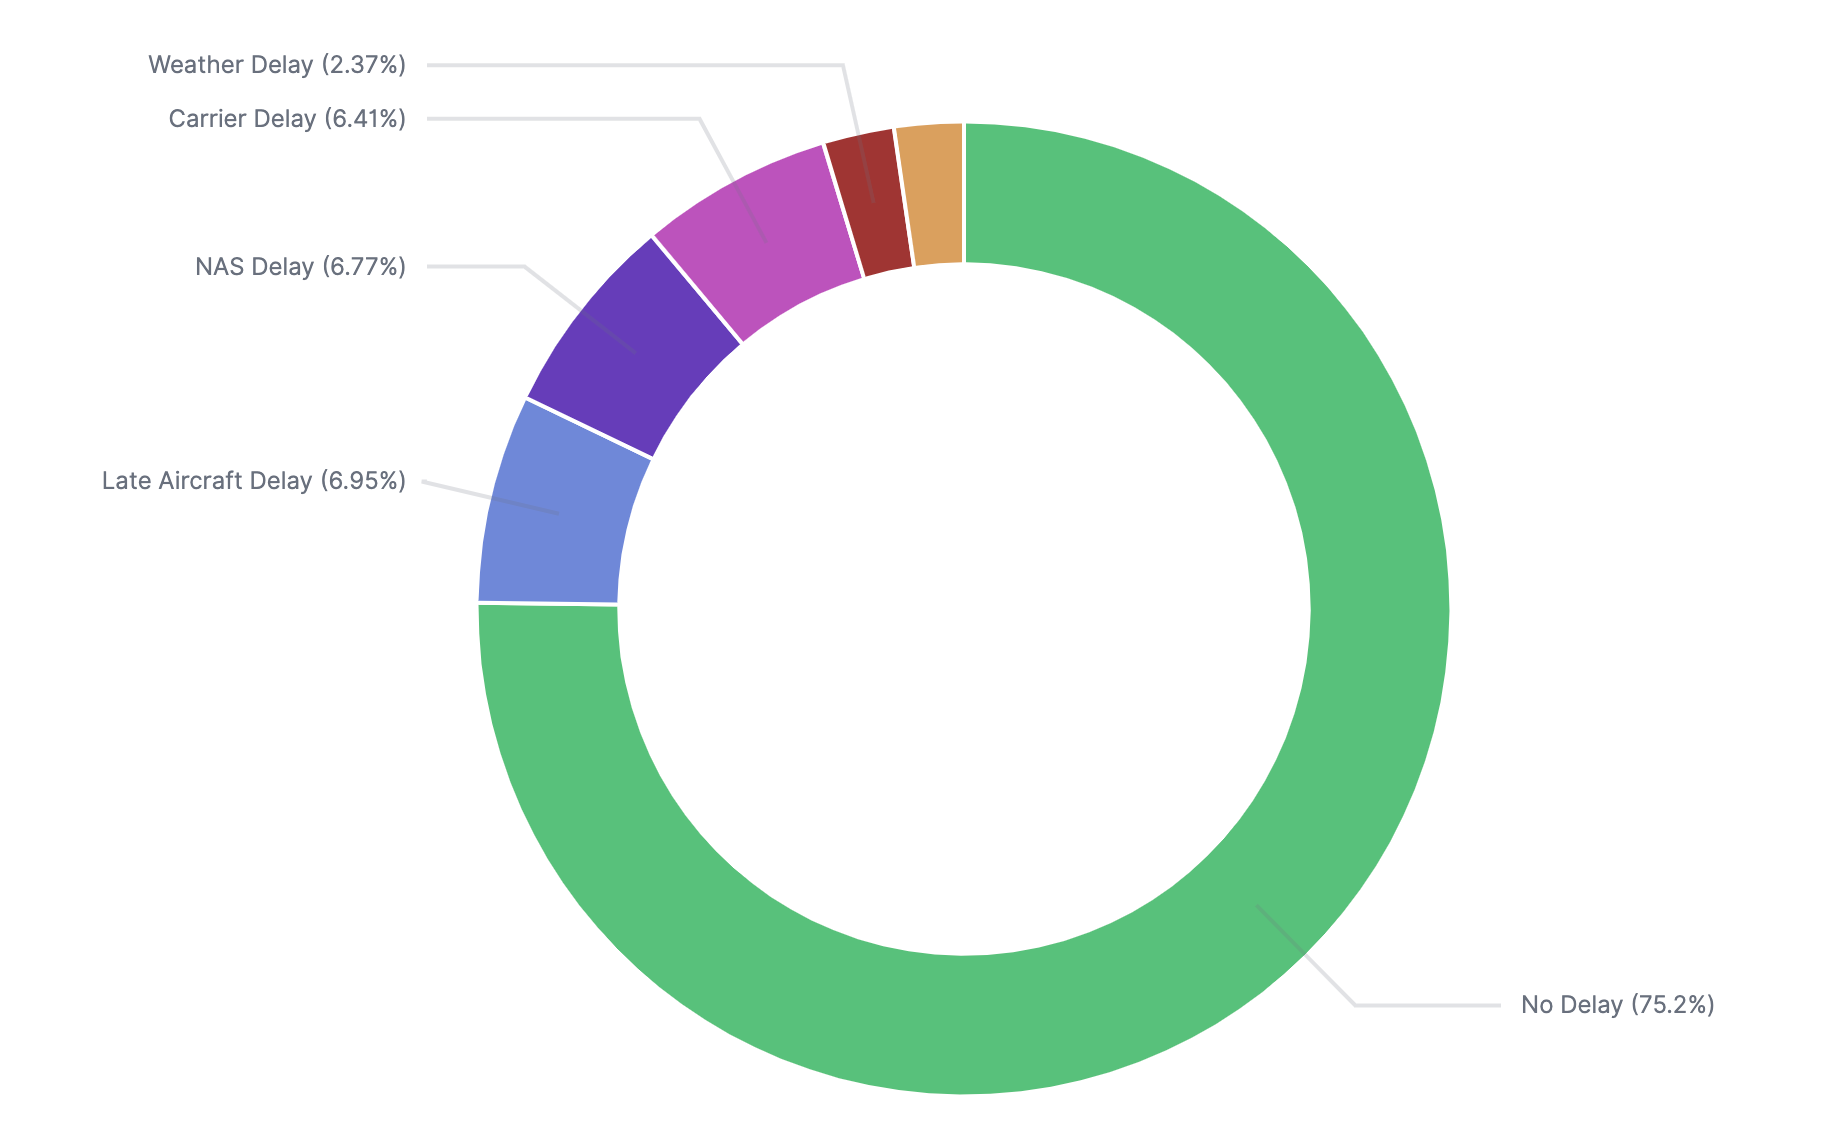
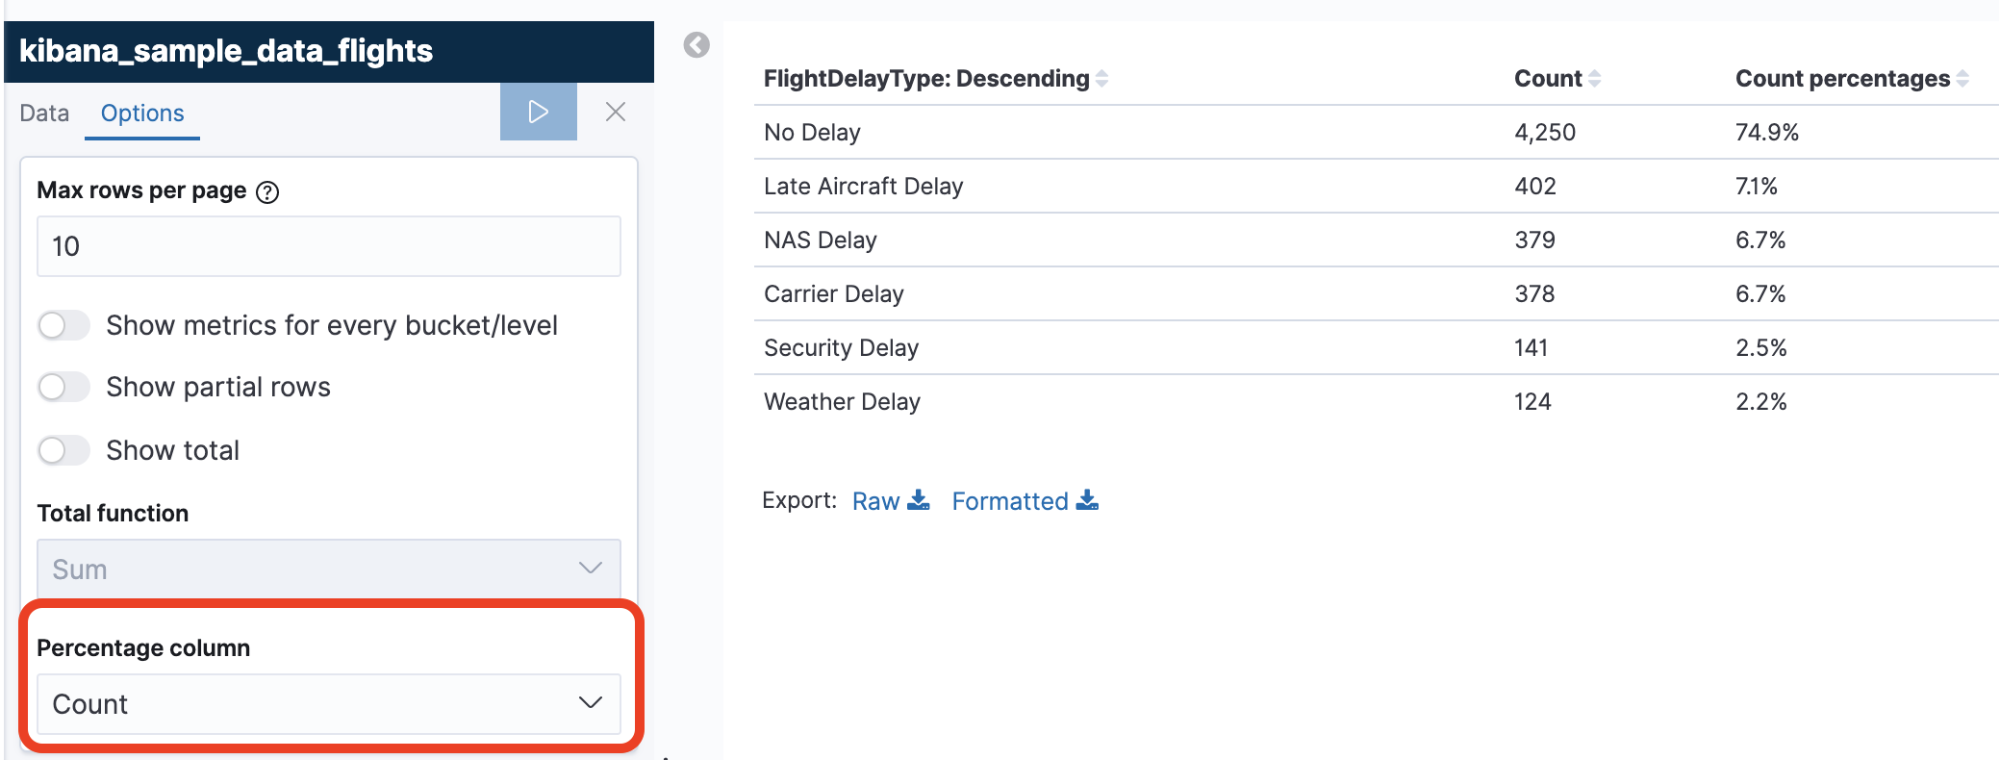
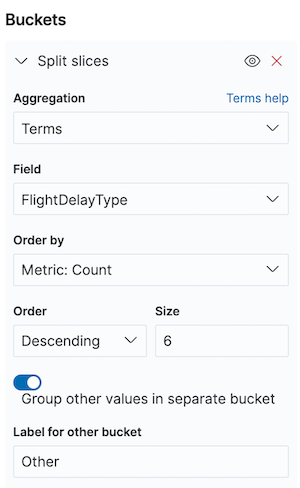
These visualizations use a Terms bucket aggregation on the FlightDelayType field, and show the count per bucket converted to a percentage of the total. In the flights sample data, there are only 6 values for FlightDelayType, so these percentages are accurate when the Terms size is set to 6 or more. If your data has more unique values you will need to enable the "Other" bucket to cover 100% of the data:
What is the ratio of each delay type over time?
The same airline wants two visualizations side by side in a dashboard: the summary from above compared against a time series. This will let them drill into a particular time range and see both the summary and breakdown at the same time.
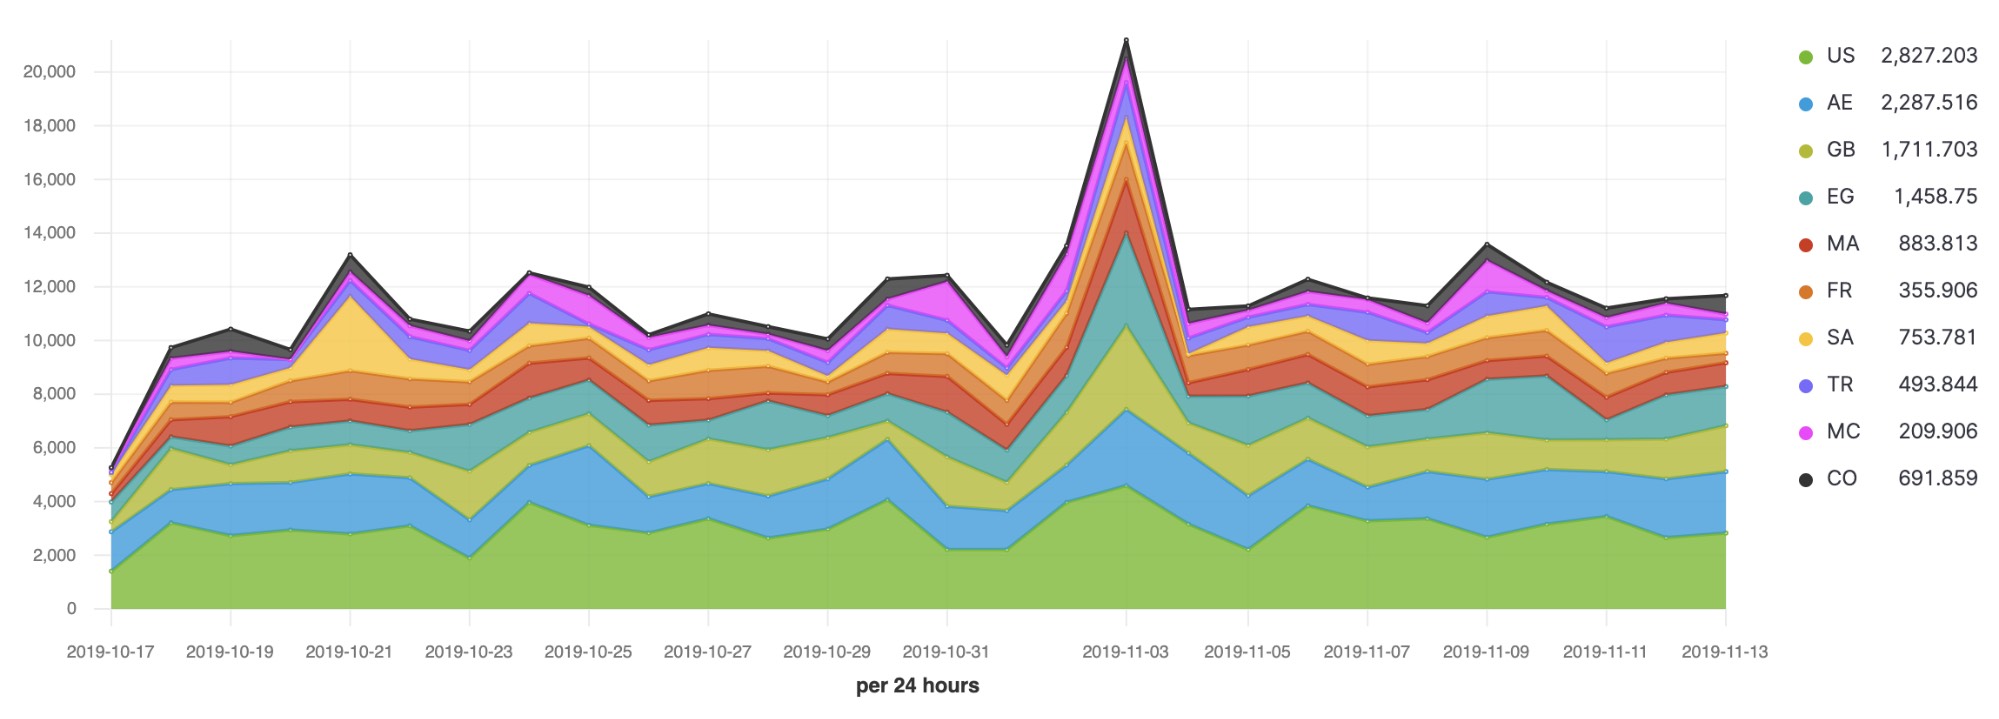
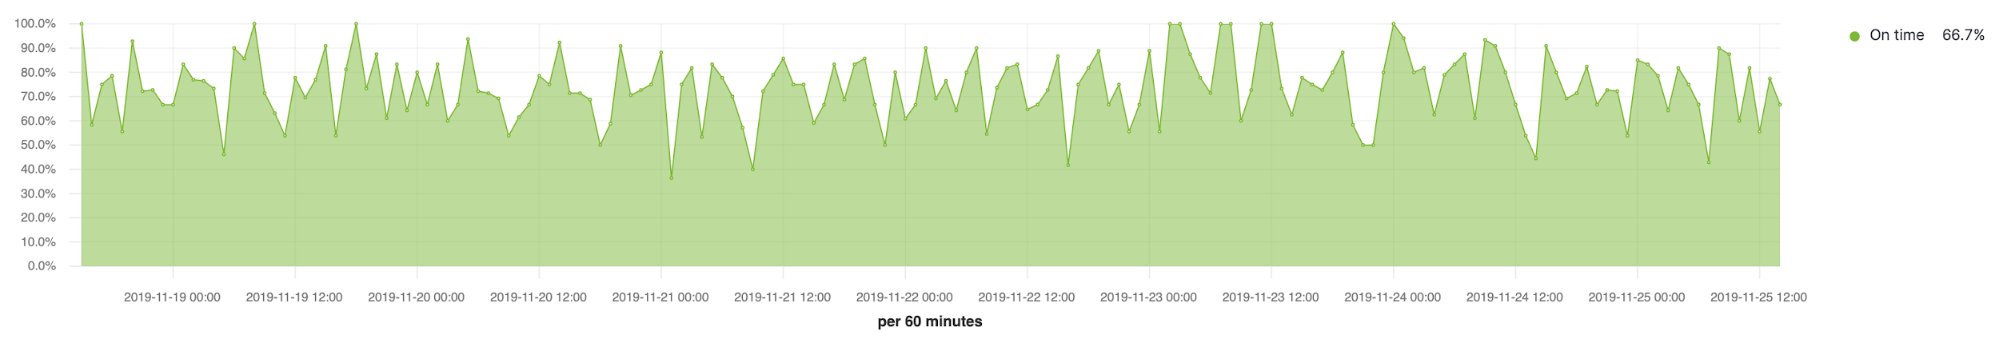
Because the flight documents have a time field, TSVB is the most powerful choice for building the visualization. Using the same setup as above, you can use Filter Ratio to divide "No Delay" flights against the total number of flights per interval:
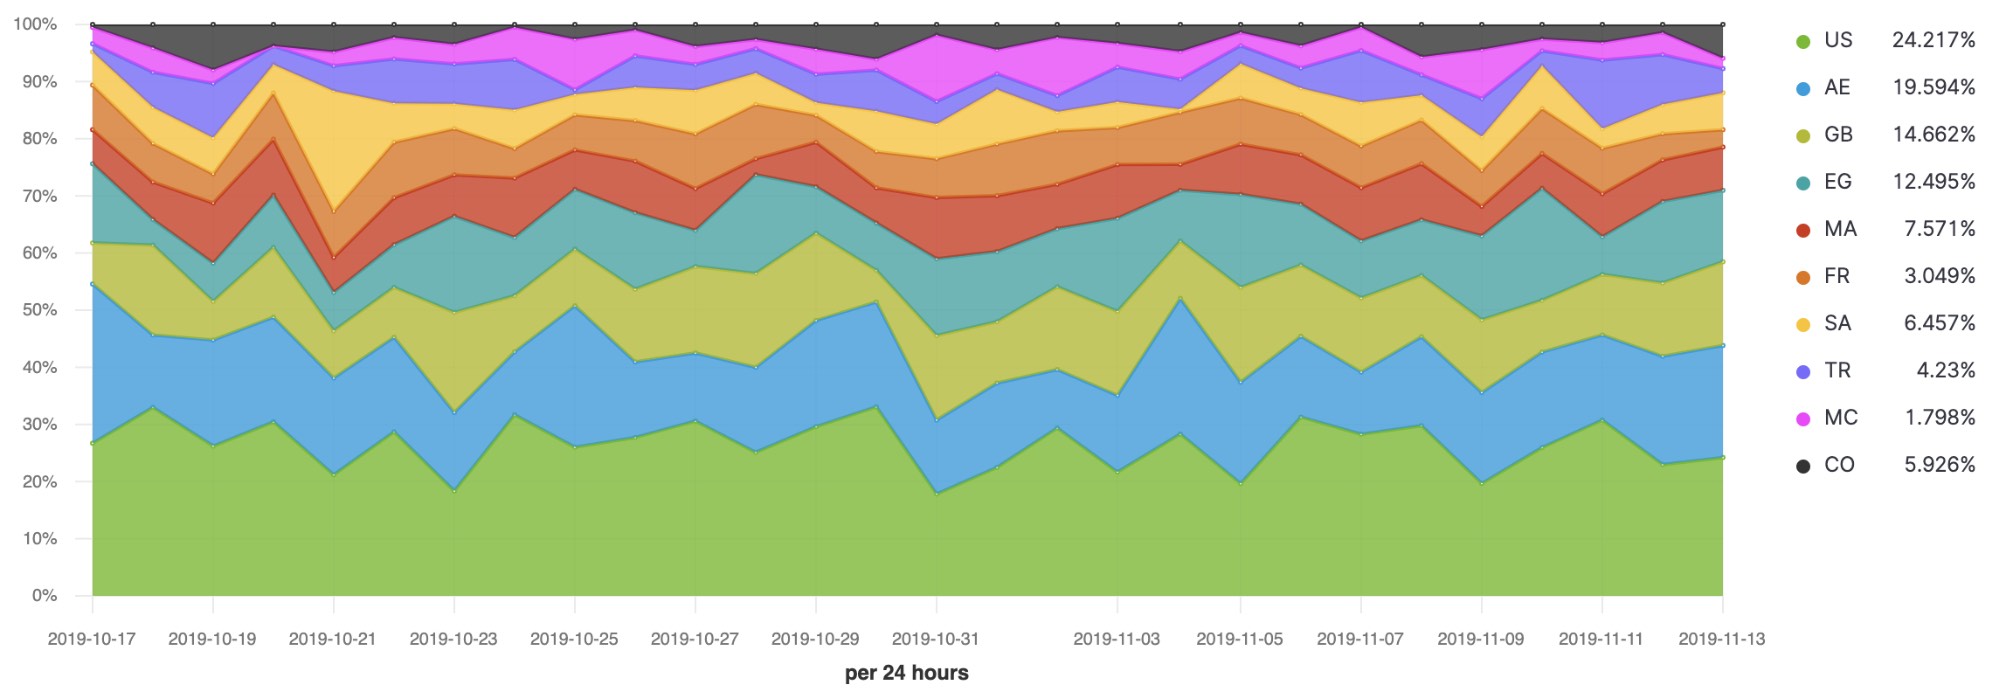
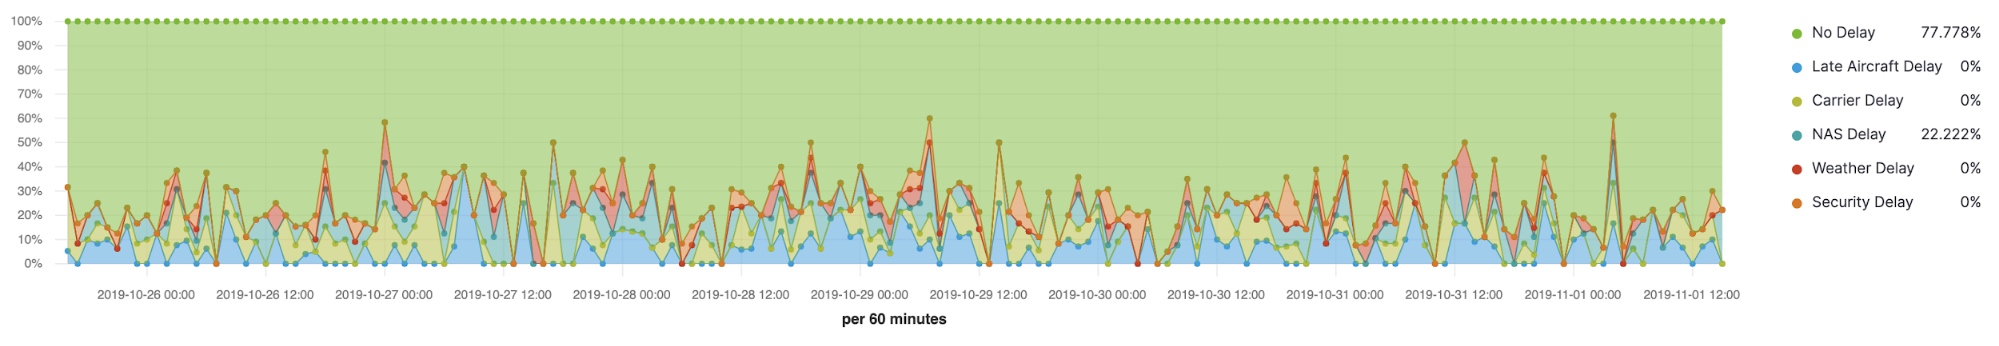
To compare more than one series, you can either build multiple filter ratios or use an aggregation to select the groups. TSVB has a mode for displaying multiple series scaled to 100%.
To configure the stacked percentage visualization in TSVB, you will first select the right data, and then configure your aggregations. To select the right data:
- Go to TSVB and select Panel options, then enter kibana_sample_data_flights as the index.
- Set the Time field to timestamp.
To configure your aggregations:
- Go back to the Data tab.
- Under Group by select Terms of FlightDelayType.
- Go to the Options tab.
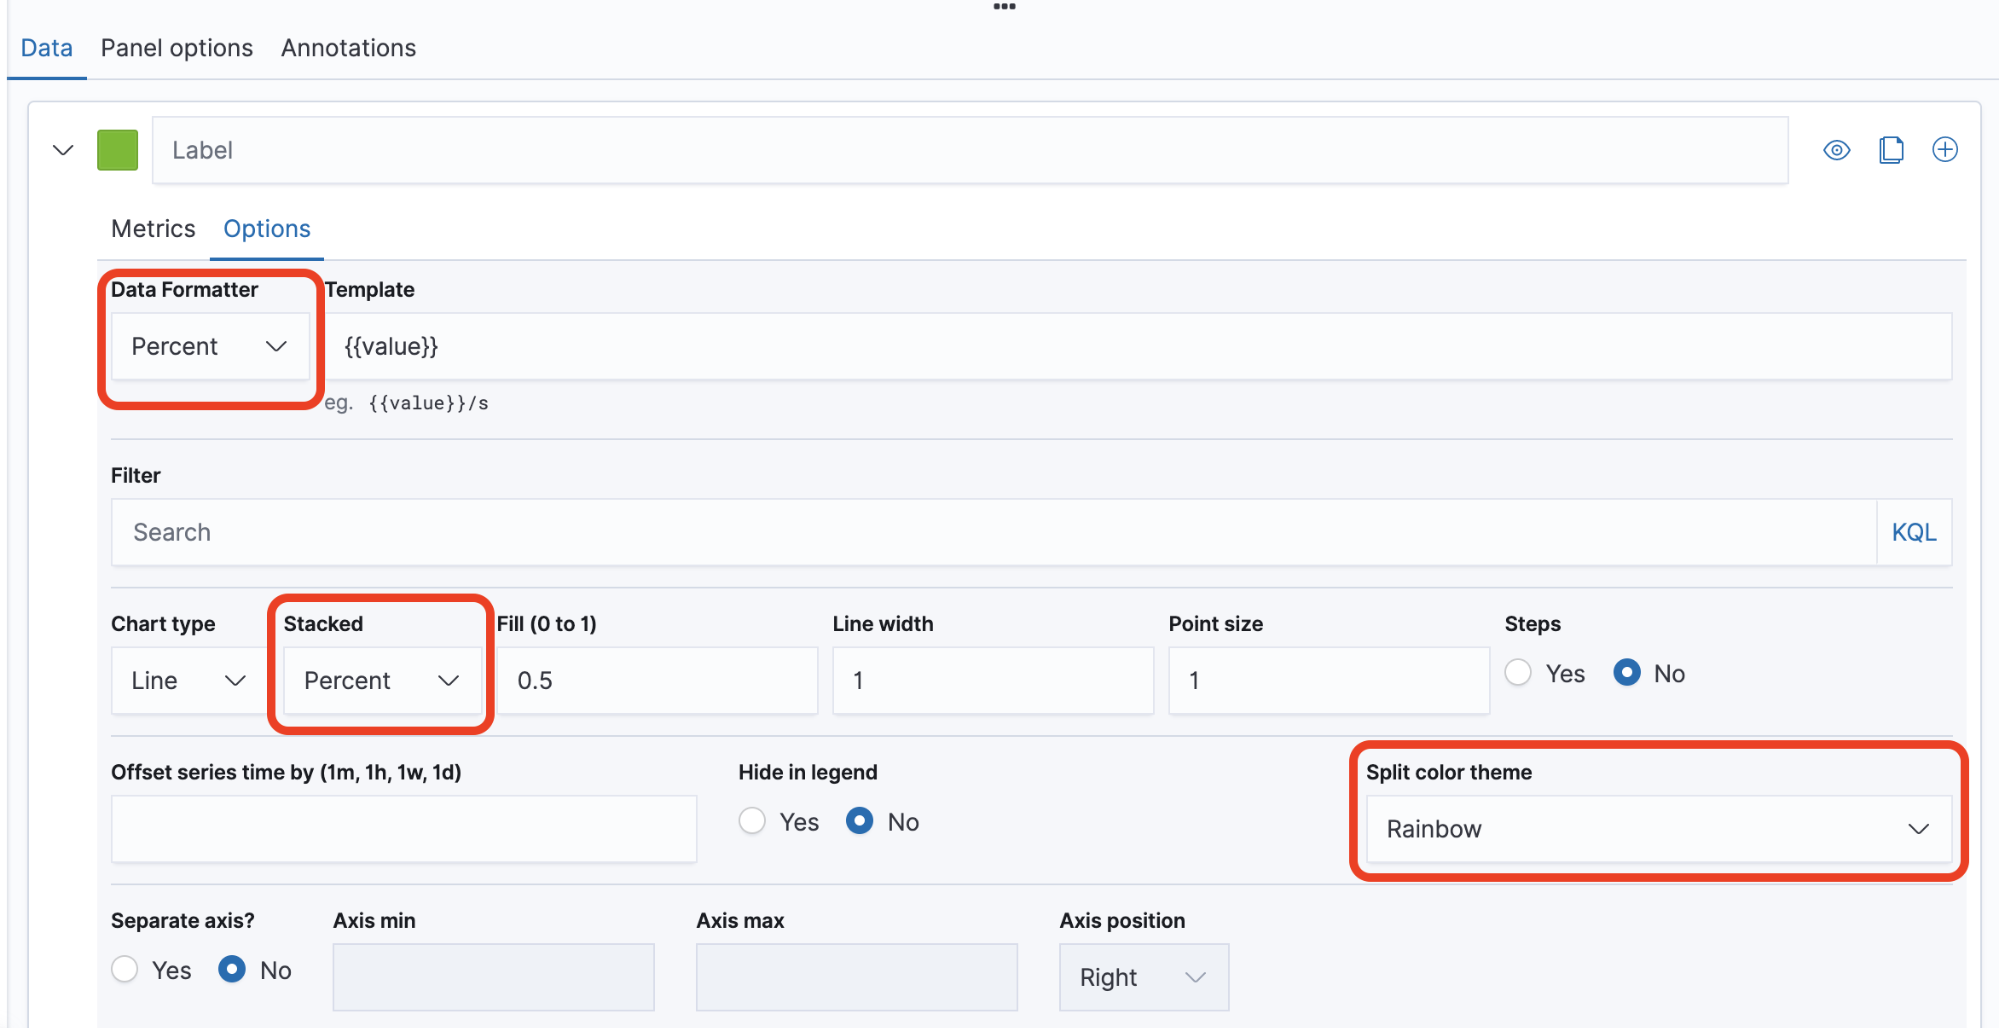
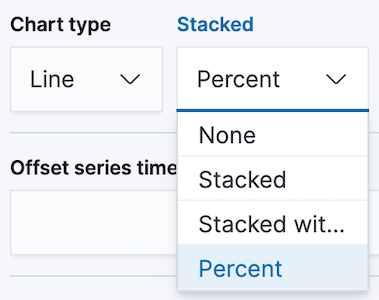
- Select Data Formatter > Percent.
- Select Stacked > Percent.
- Select Split color theme > Rainbow.
What is the change in sales week over week?
You have an ecommerce customer who stores each transaction in the kibana_sample_data_ecommerce index. They want a visualization that displays a percentage change in sales week over week, a number that is critical to their business. Because there is a time component to this question, you will use TSVB to build this visualization. It is also possible to build week over week charts with Timelion, but is not covered here.
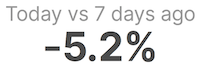
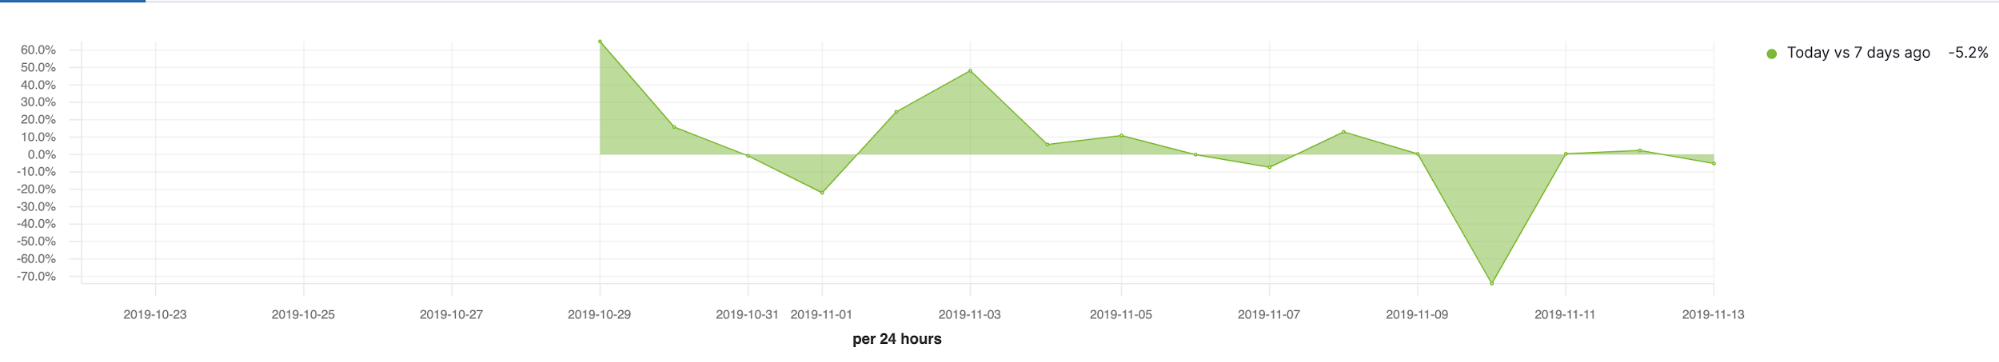
As you have seen above, TSVB can build both a metric visualization and a time series visualization using the same aggregations. Unlike the previous example where you set Data timerange mode to Entire time range, in this visualization you will only show the most recent day of data compared to the same day 1 week prior. As you can see, these two visualizations show that there is a 5.2% decrease in sales on the most recent day of data:
To build this you need to sum the total sales for each day and compare it to the total from 7 days ago. The easiest way to do this comparison is the Serial Difference aggregation, which takes each value and subtracts the value from a specific interval before.
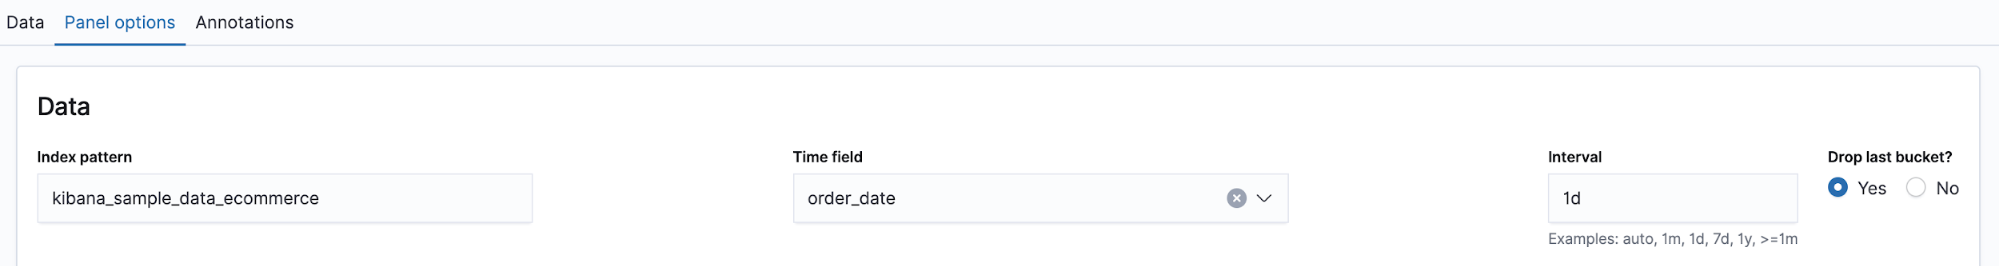
Set up TSVB the same as the previous examples, making sure to select the kibana_sample_data_ecommerce index and set the time field to order_date. Also, set the interval to exactly 1d. The default interval for TSVB will change based on the overall time range, while this calculation expects the interval to always be the same.
Go back to the Data tab and select the Sum aggregation for the field taxful_total_price.
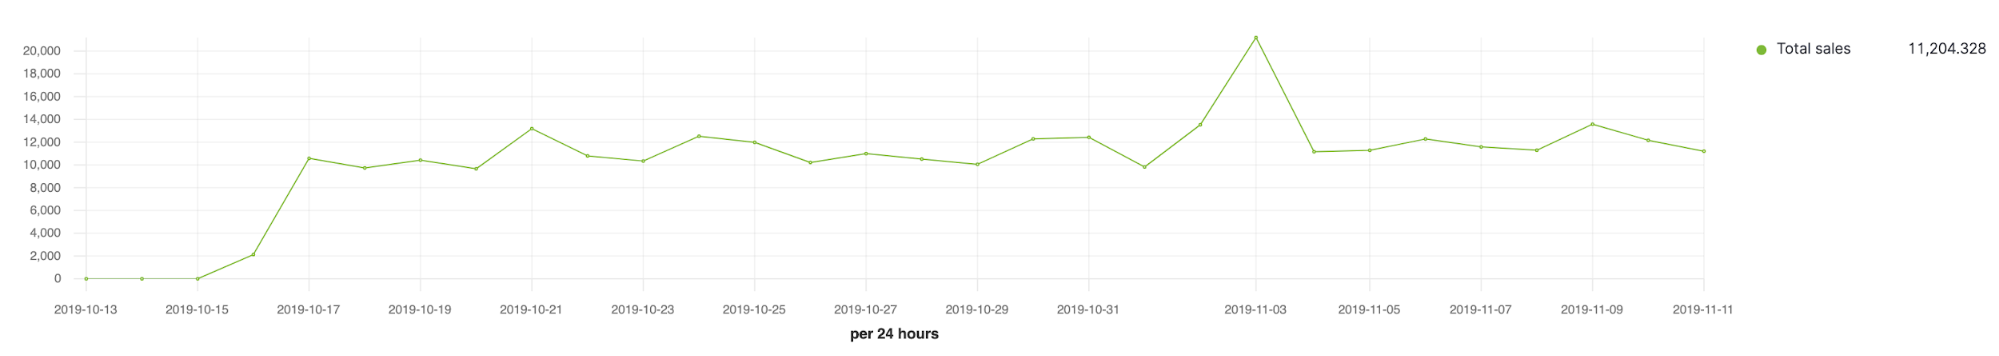
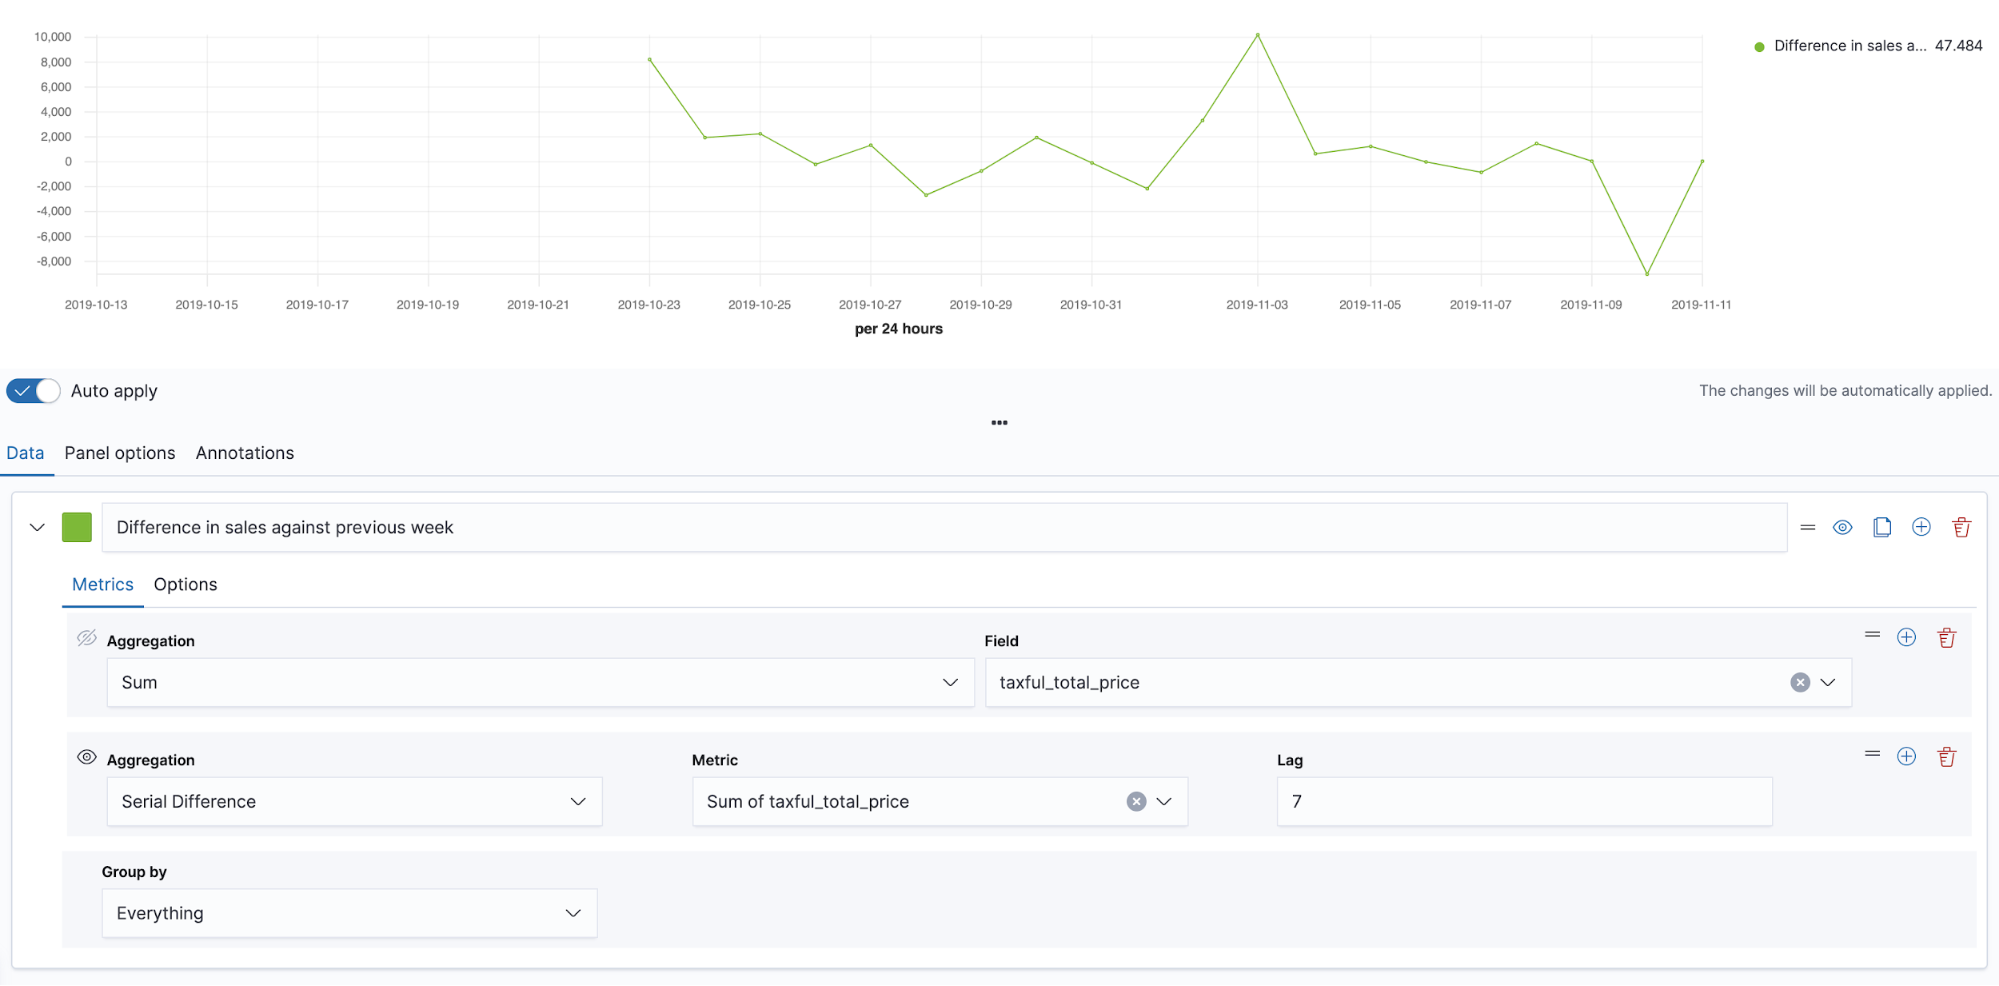
Then, add a Serial Difference aggregation on Sum of taxful_total_price with a lag of 7 buckets, because you already set the time interval to 1 day. The Serial Difference will subtract the value from 7 buckets ago from each day, giving us the total difference in sales week over week. Because of how the serial difference metric is calculated, it will always leave the left 7 days blank, so you should pick a large time range:
Finally, you will convert from the difference week over week to a percentage by doing math. Add together the current sales and the difference, then divide against the current value:
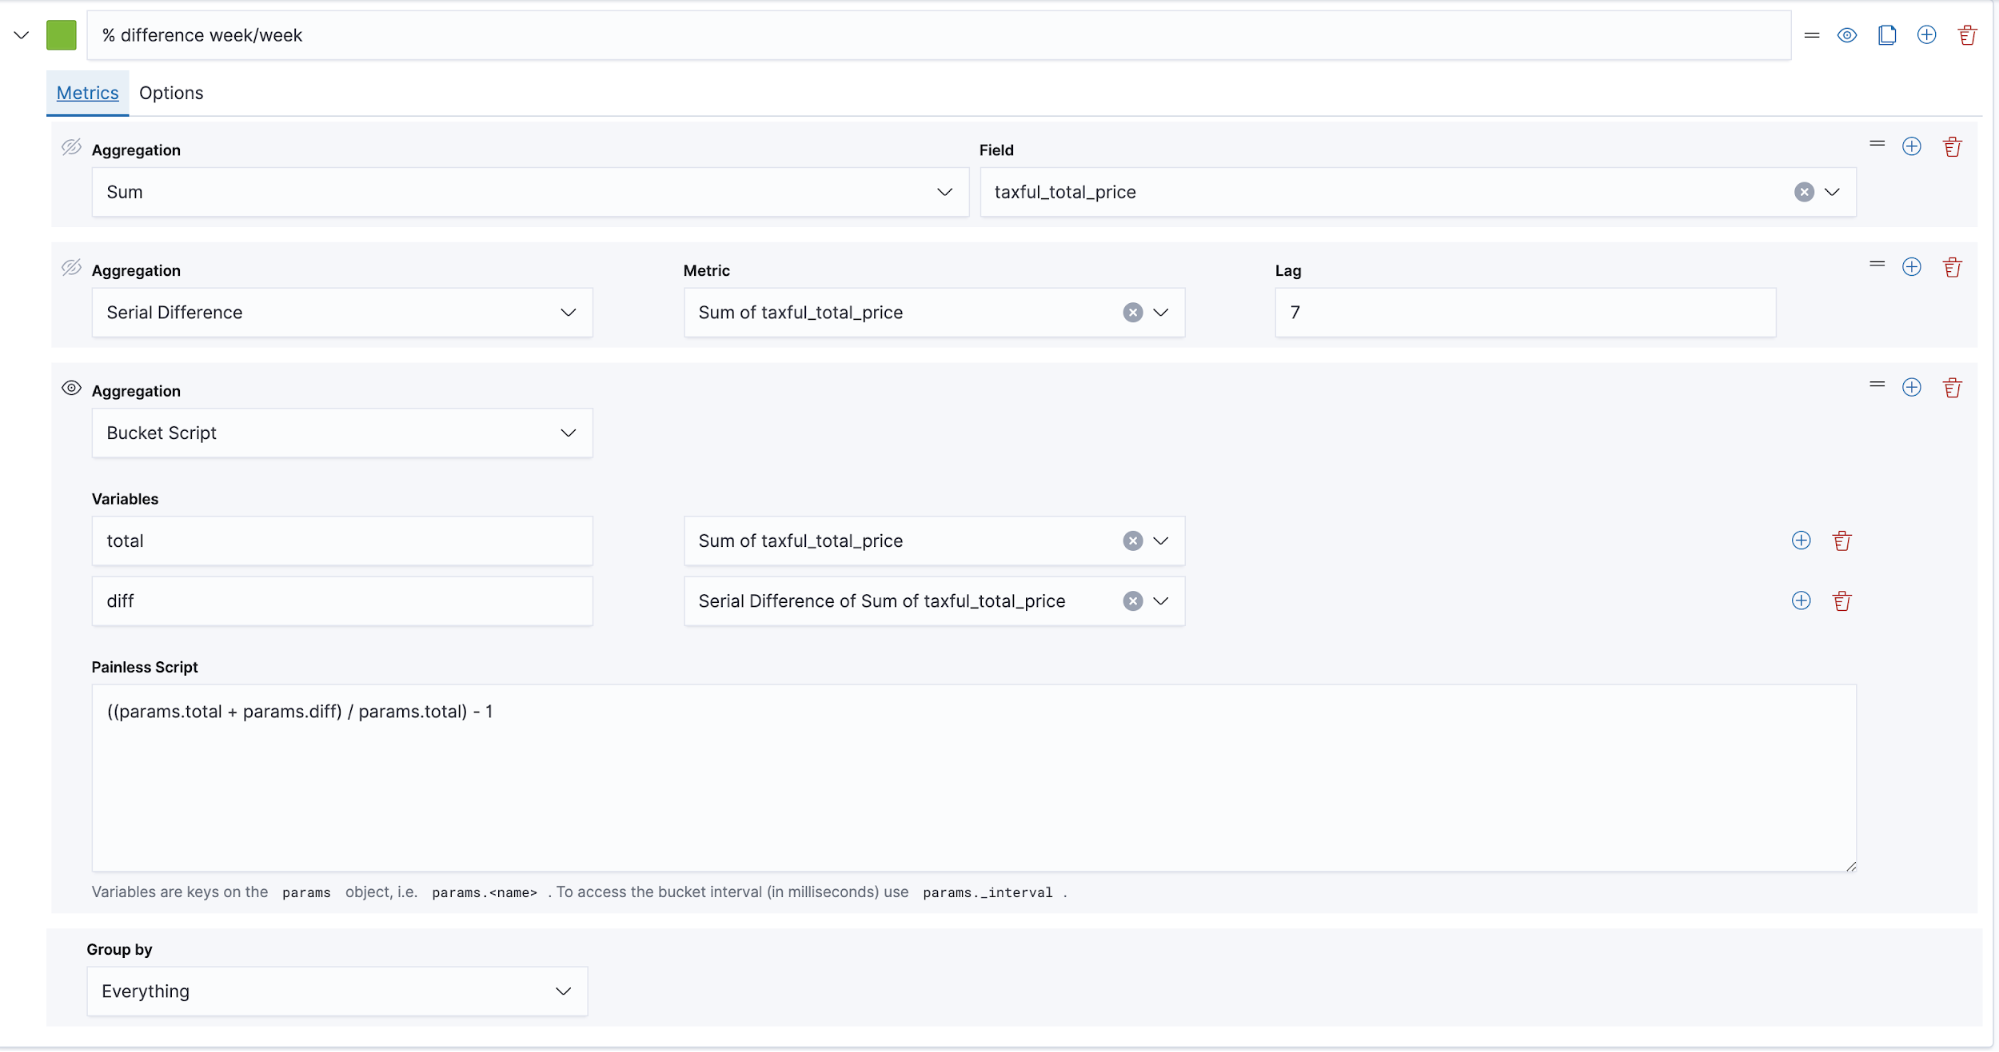
The Painless script used is ((params.total + params.diff) / params.total) - 1
This results in the visualization seen above. For clarity, you could also create a new series using a static value of 0 to highlight the baseline of 0 difference.
You can now switch between the Time Series and Metric tabs to decide which presentation makes sense for your use case.
Conclusion
These are just a couple examples of how to calculate and use percentages effectively inside of Kibana. Going beyond what we’ve outlined in this post, if you’d like to explore more options for calculations when dealing with percentages, try using Canvas inside of Kibana and its ability to control both the querying and display of data. You can also discover how to build actionable dashboards with Kibana.
Additional Resources