Generating and visualizing alpha with Vectorspace AI datasets and Canvas
Abstract
This is the story of how Vectorspace datasets came about using the Elastic Stack, and Canvas in Kibana, in order to visualize information and unlock the power and value of data.
Background
In 2002 at Lawrence Berkeley National Laboratory, Vectorspace created feature vectors based on Natural Language Understanding (NLU), also known today as word embeddings. Feature vectors were used to generate correlation matrix datasets to analyze hidden relationships between genes related to extending lifespan, breast cancer and DNA damage repair resulting from space radiation.
The data sources included results from lab experiments, scientific literature from the National Library of Medicine, ontologies, controlled vocabularies, encyclopedias, dictionaries and other genomic research databases.
Back then, they also implemented AutoClass, a Bayesian classifier used to classify stars, and used it to classify groups of genes based on a dataset containing gene expression values. Losses were minimized and results became more useful when augmenting datasets with word embeddings and topic modeling. At the time, the goal was to mimic conceptual connections a biomedical researcher might make right before a discovery, in silico. Some of this work went into a published paper describing hidden relationships between genes related to extending the lifespan of nematodes. In 2005, the US Navy’s SPAWAR division got involved, which allowed more resources to expand research into areas like the financial markets.
Hot-rodding a dataset
Over time, Vectorspace learned to ‘hot rod’ datasets by augmenting or joining feature vectors represented by word embeddings. This resulted in generating new visualizations, interpretations, hypotheses or discoveries. Augmenting time series datasets for the financial markets with these kinds of feature vectors may produce unique signals or generate alpha. It all starts with data sources that are optimized for a selected context or topic as illustrated below:
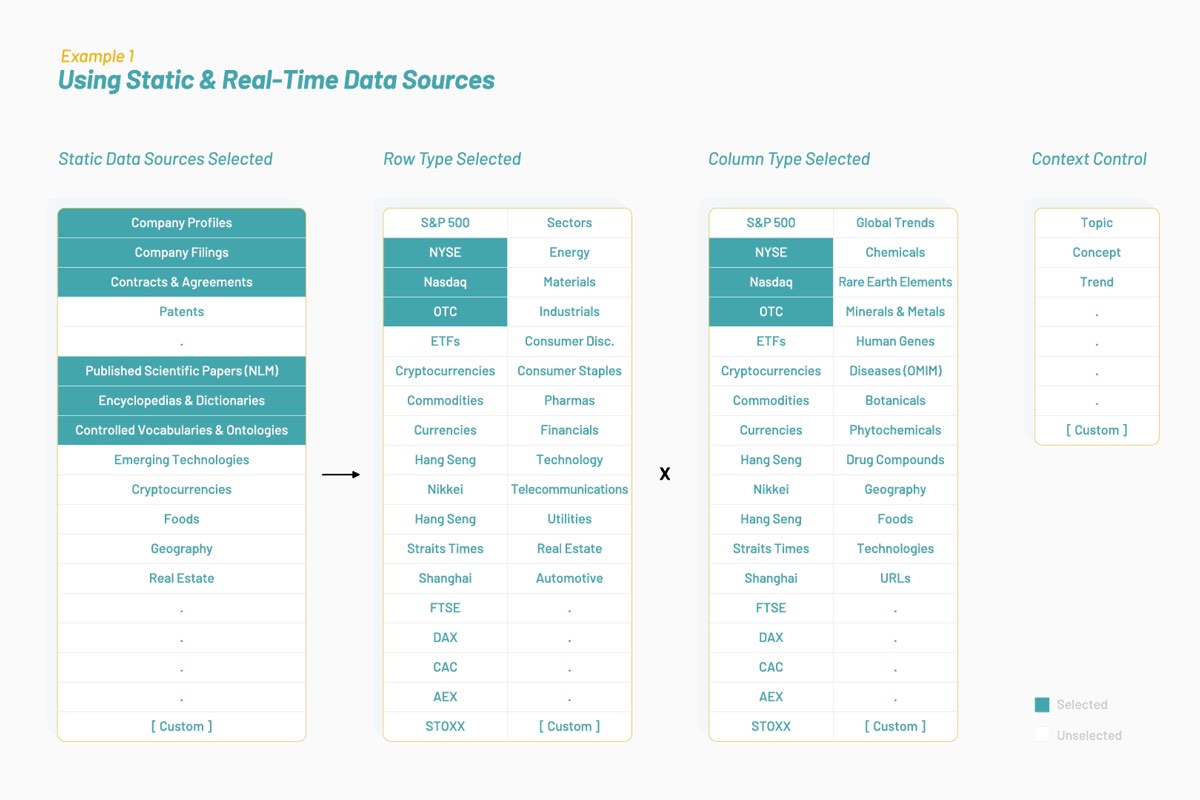
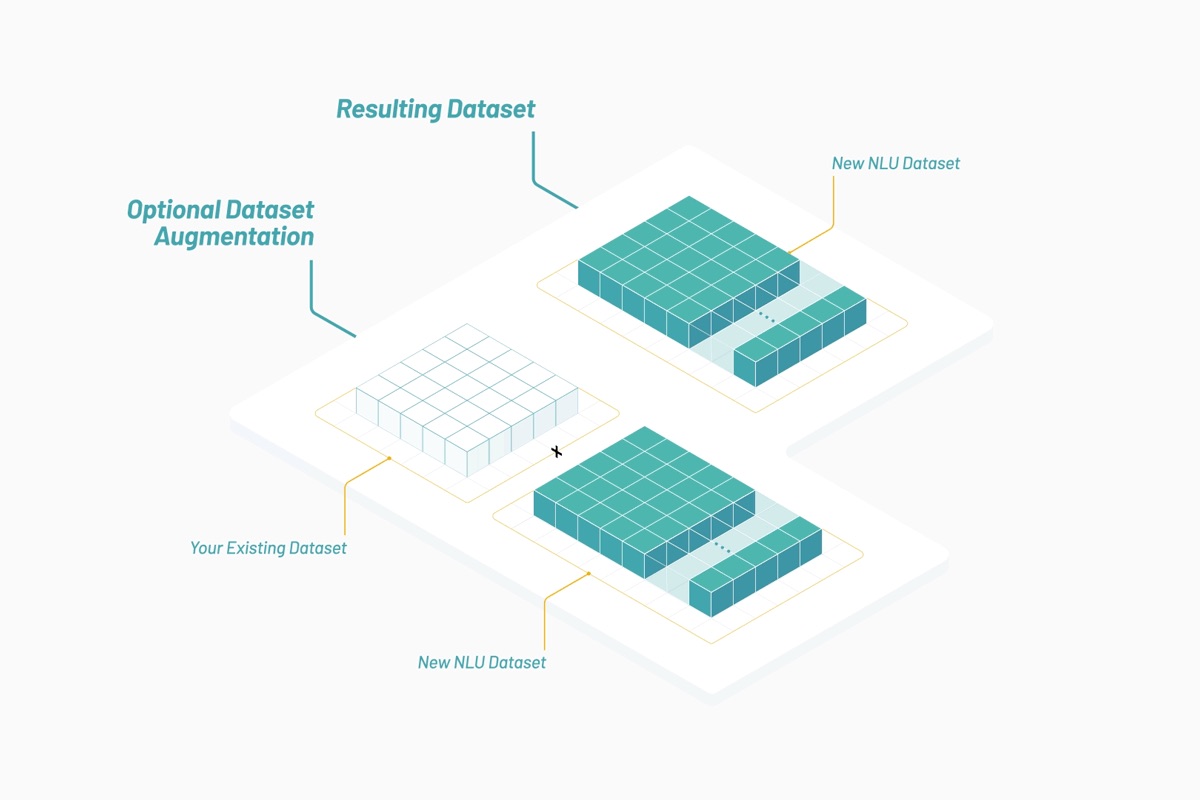
Resulting datasets are composed of feature vectors that are word embeddings based on biomedical literature and human language surrounding public companies on the NYSE and Nasdaq. An interdisciplinary approach to research may determine if genes and stocks share similar attributes and behaviors when interacting in the pathways they share.
Establishing a two-part goal
Part one: Determine where to apply knowledge about observed interactions between genes, proteins, drugs and diseases to stocks.
Part two: Explore how to create a vehicle for funding research related to making long-term human spaceflight safer by using augmented datasets to generate alpha in the financial markets.
Upside event triggers
Were the interactions being observed between genes similar to interactions between stocks? On September 20, 2004, there was an event that gave an answer, in part. Merck (MRK) declined by 21% (likely) based on its drug Vioxx potentially causing heart attacks. It was an event that triggered latent sympathetic movement in the stock price of other public pharmaceutical companies, in particular, Pfizer (PFE). The dataset augmentation Vectorspace produced enabled the prediction of a delayed reaction in the price of PFE based on its associations to the drug Vioxx, which Merck was producing. Details on this will follow.
Further research uncovered an interesting paper in The Journal of Finance, February 2001 issue, titled “Contagious Speculation and a Cure for Cancer: A Non-Event that Made Stock Prices Soar”. The paper described an event with a company called EntreMed (ENMD was the symbol at the time):
“A Sunday New York Times article on a potential development of new cancer-curing drugs caused EntreMed’s stock price to rise from 12.063 at the Friday close, to open at 85 and close near 52 on Monday. It closed above 30 in the three following weeks. The enthusiasm spilled over to other biotechnology stocks. The potential breakthrough in cancer research already had been reported, however, in the journal Nature, and in various popular newspapers including the Times! more than five months earlier. Thus, enthusiastic public attention induced a permanent rise in share prices, even though no genuinely new information had been presented.” Among the many insightful observations made by the researchers, one stood out in the conclusion: “[Price] movements may be concentrated in stocks that have some things in common, but these need not be economic fundamentals.” — (Huberman and Regev 387)
With the teams previous background in areas related to quantitative algorithm development, investment banking, and running public companies, they began to observe similarities between genes and stocks. Like genes, stocks have ‘expression values’, attributes, hidden relationships with one another and with outside events, topics or global trends. These relationships are a form of knowledge that tends to be embedded in human language more so than anything else. Like genes, clusters of stocks can interact and move in sympathy with one another. This data can be used to predict future price correlations between equities based on ‘latent entanglement’. Clusters of stocks can double as ‘baskets’ which share known and hidden relationships among one another and outside events. Clusters or baskets can be controlled with context.
A rising tide does not lift all boats
Vectorspace set out to analyze what was causing the correlations observed as they identified an opportunity to create a funding vehicle based on leveraging an inefficiency in the financial markets based on “minable pockets of information”. They began to observe delayed reactions between stocks, similar to the way a harbor or bay fills with water and lifts boats minutes or hours after an outside ocean tide rises. The rise of water in a harbor can be triggered by an event which then lifts boats in the harbor where, in this case, the boats can be considered clusters of tradable assets like stocks. In the financial markets, some boats rise and some do not. Predicting which assets are correlated to an event along with the strength and context of that correlation can provide a valuable signal. It’s like having a form of asymmetric information that can be used to position ahead of the market or reduce risk on the long or short side when deploying capital. This might also be known as ‘generating alpha’ which can be visualized and interpreted.
To test this probabilistic boat lifting hypothesis, 20 years of data was analyzed to look for patterns of sympathetic movements or latent entanglement between the stock prices of publicly traded companies based on events in the market. Plenty of examples were discovered, including the three events below: EntreMed (ENMD) 1998, Merck (MRK) 2004 and Celgene (CELG) 2019.
Event 1: EntreMed (ENMD) gains 608% (May 4, 1998 )
EntreMed released news that it had a cure for a type of cancer on a Friday after the market closed. Its stock price was trading at $12 on Friday and opened at $85 on Monday. In sympathy, a basket of stocks also began to rise which had correlations to ENMD based on human language surrounding protein science related to cancer therapies.
The paper describing this event contains a few relevant excerpts:
pg. 392 par. 4 “Returns of three of these exceeded 100 percent, returns of two were between 50 percent and 100 percent, and returns of another two firms were between 25 percent and 50 percent. A comparison of these returns with the extreme return distribution reported in Table I shows how unusual the returns of these seven biotechnology stocks were, and, especially, how unprecedented their clustering was.”
pg. 395 par. 1 “That news about a breakthrough in cancer research affects not only the stock of a firm that has direct commercialization rights to the development is not surprising; the market may recognize potential spillover effects and surmise that other firms may benefit from the innovation.”
pg. 396 par. 3 “movements may be concentrated in stocks that have some things in common, but these need not be economic fundamentals”
Event 2: Merck (MRK) drops 25.8% (September 30, 2004 )
Merck pulled Vioxx, a $2.5 billion drug, off the market because it was causing heart attacks and strokes based on COX-2 inhibitors. This correlation had a cause. MRK closed at $45.07 on the previous day and opened at $33.40 on September 30. During experimentation with word embeddings doubling as feature vectors, it was found that Pfizer (PFE) was the company most closely related to Merck based on similar feature vectors as they were working on a similar drug compound based on the COX-2 inhibitor at the time. A few weeks later PFE significantly declined.
“On December 17, 2004, Pfizer and the US National Cancer Institute announced that they have stopped administering Celebrex (celecoxib), a cyclooxygenase-2 (COX-2) inhibitor, in an ongoing clinical trial investigating its use to prevent colon polyps because of an increased risk of cardiovascular events. Merck's rofecoxib (Vioxx), another COX-2 inhibitor, was withdrawn from the market worldwide in September 2004 because of an increased risk of myocardial infarction and stroke.” - CMAJ.
PFE fell 24%, from the close of the previous day of $28.98 to a low of $21.99 that day.
Event 3: Celgene (CELG) gains 31.8% (January 3, 2019 )
On January 3, 2019, Bristol-Myers Squibb (BMY) acquired Celgene (CELG) for $74 billion. CELG rose overnight from $66.64 to $87.86 per share or 31.8% gain. Over a four-day period, a basket of stocks related to CELG produced a 20% profit based on relationships found in human language surrounding these companies. Data sources enabling connections between these entities include repositories of public company profiles and peer-reviewed published scientific literature.
In the Vectorspace analysis of this process, it was found that some NLU correlations can cause latent price-based correlations among equities and between equities and events. The team observed many examples like the ones above that can be used to position ahead of the market or engage in forms of information arbitrage.
Visualizing alpha
Today at Vectorspace AI, datasets are designed for detecting networks of hidden relationships between gene, protein, microbe, drug and disease interactions in life sciences or between equities in the financial markets. Most of the time, our customers use these datasets to augment existing in-house datasets. The datasets are generated using combinations of feature vectors which consist of scored attributes based on the vectorization of words and objects. Datasets are updated in near real time and accessed via API using utility token credits.
By utilizing the Elastic Stack and Canvas, Vectorspace can provide customers with near real-time data visualization and interpretation in white-labelled, completely configurable views. This is important to the overall process, as new interpretations and insights can lead to new hypotheses, signals or discoveries.
It’s common for asset management companies and institutions to request on-premise data engineering pipeline solutions for privacy. Packaging our data engineering pipeline using Elastic Cloud Enterprise enables the delivery of a turn-key solution for signal generation.
Vectorspace customers in the financial markets aim to optimize signal to noise ratios, generation of alpha, minimization of a loss function or maximizing Sharpe or Sortino ratios. They do this while visualizing and interpreting results from backtesting strategies based on near real-time dataset augmentation while limiting backtest overfitting.
Dataset update frequency can range from one minute to one month, depending on the volatility of the underlying data sources. A popular dataset package requested consists of a time series pricing dataset where rows contain publicly traded pharmaceutical companies augmented with feature vectors which are drug compounds that have a NLU-based correlation score. Choosing a context to operate within can be critical. Just as context can change a definition, adding the right contextual constraints can guide a change in the value of a correlation score over time. Context can also control strength of relationships among entities and between entities and events.
Visualizing with Canvas
Let’s dive in and use one of these datasets to generate and visualize the basket of stocks related to Celgene (CELG) along with the event that triggered a delayed rise in price among some of those stocks. This will walk through the typical steps a Vectorspace customer might take using these datasets while interpreting near real-time results and the results of a backtest in Canvas. First, one would look at bottom-line results for an entire group of baskets to confirm the Celgene basket was not cherry picked.
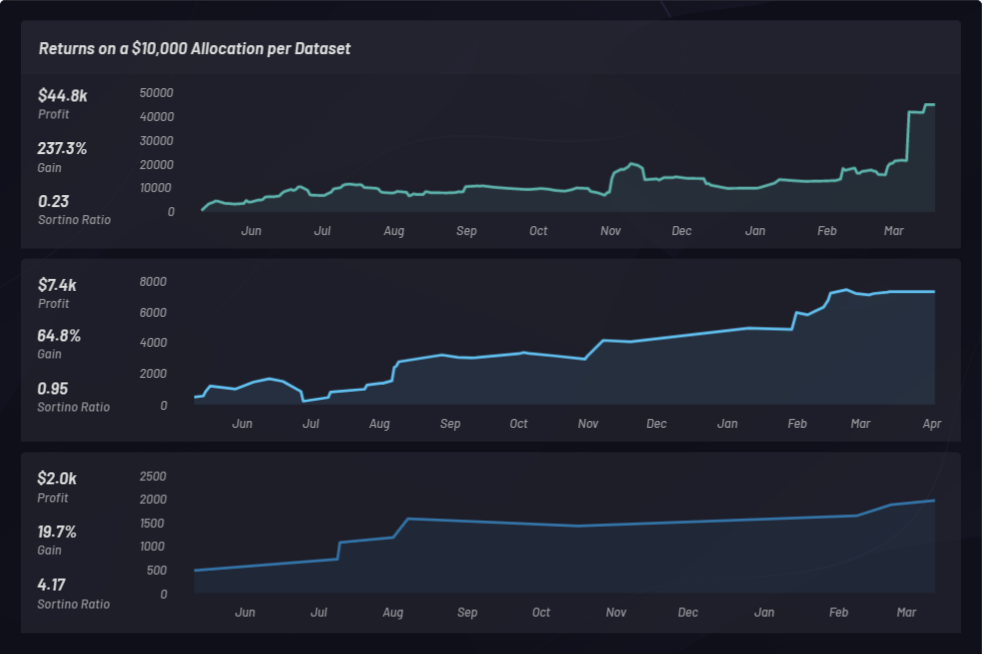
Below are three separate backtests using long-only baskets with different parameter settings. Each has a $10,000 capital allocation and is ranked by its Sortino ratio:
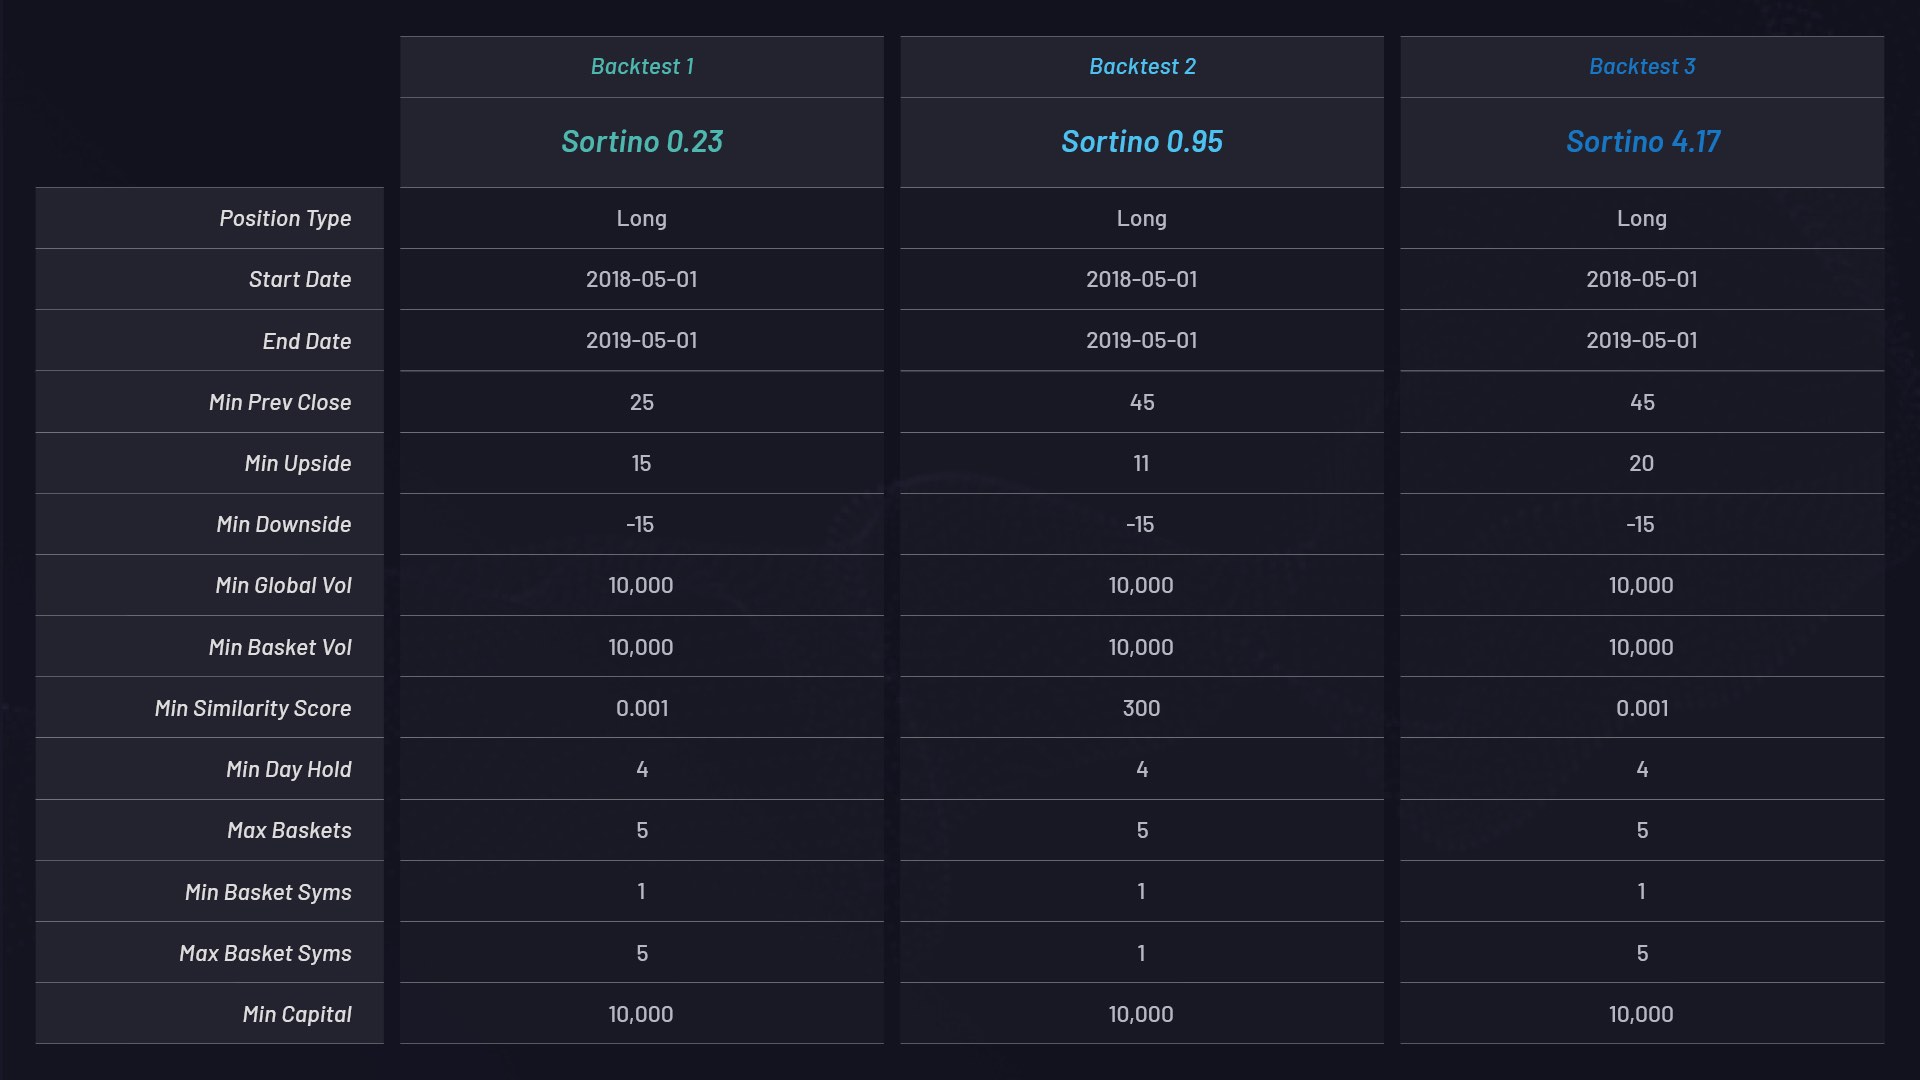
Parameter settings for each basket:
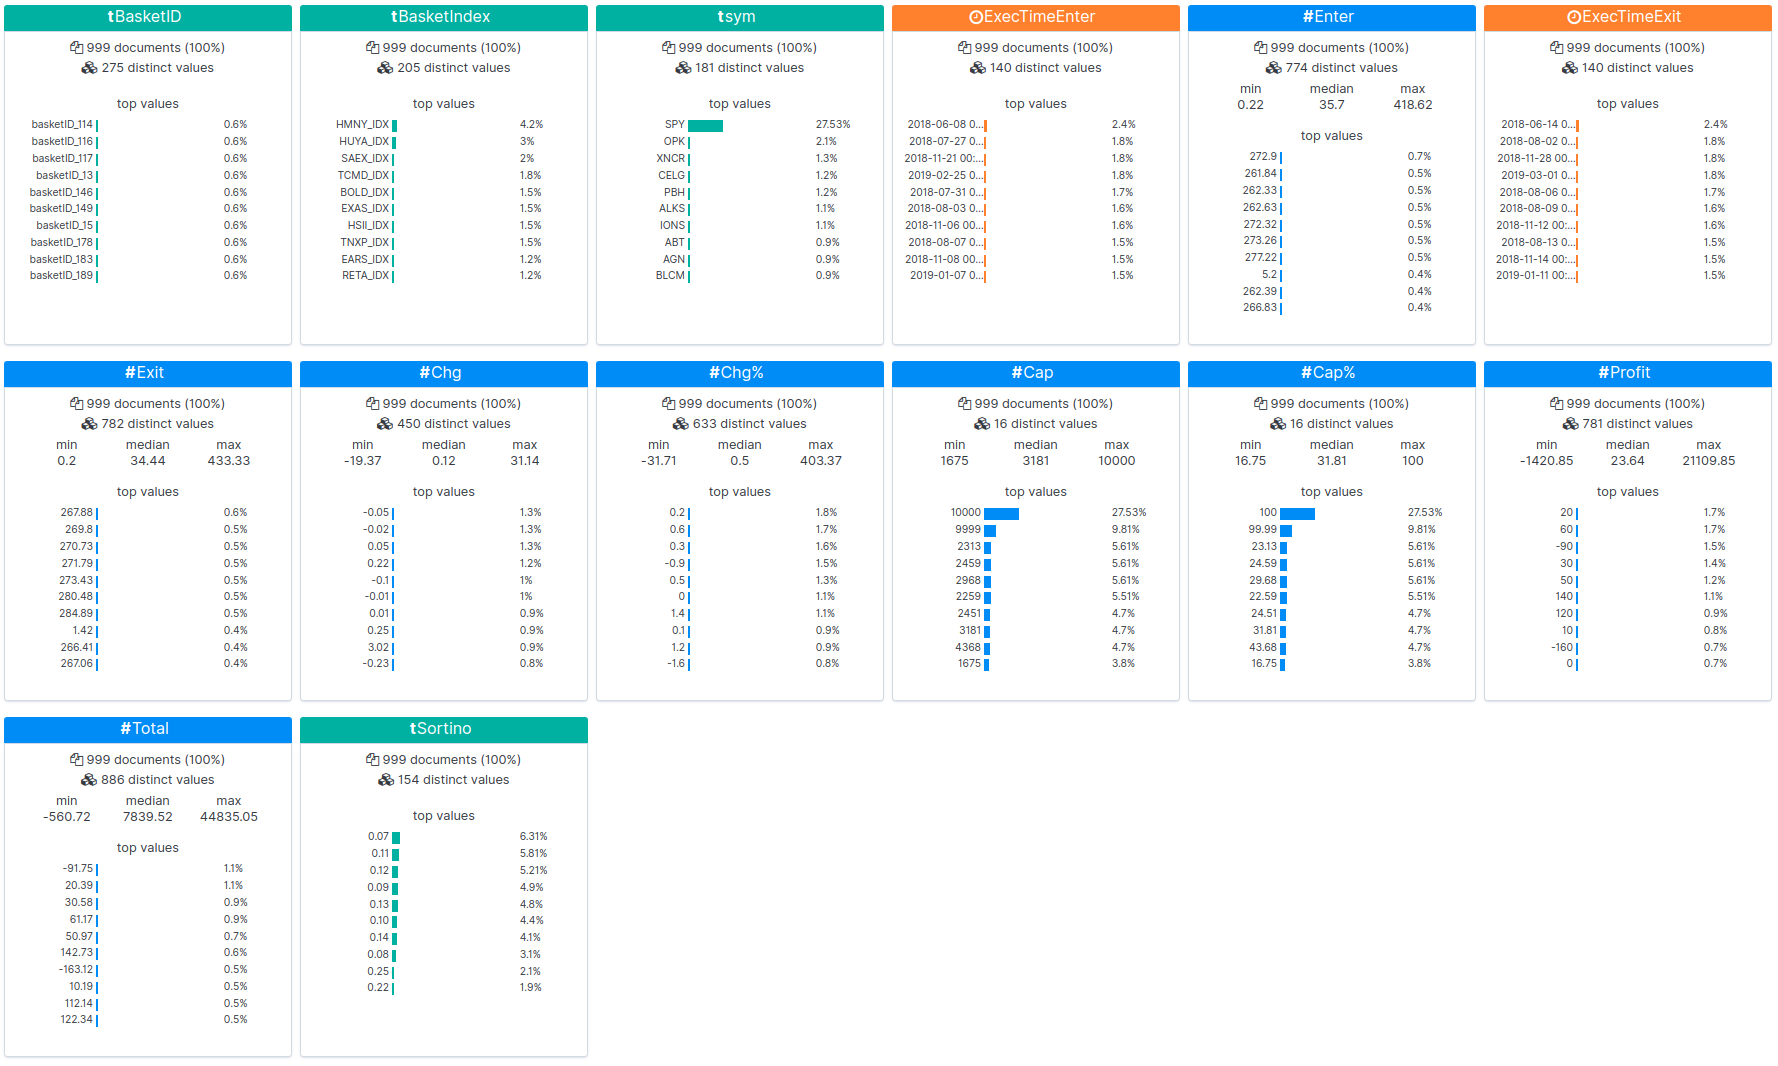
Below, backtest results are loaded into Kibana and statistics are displayed:
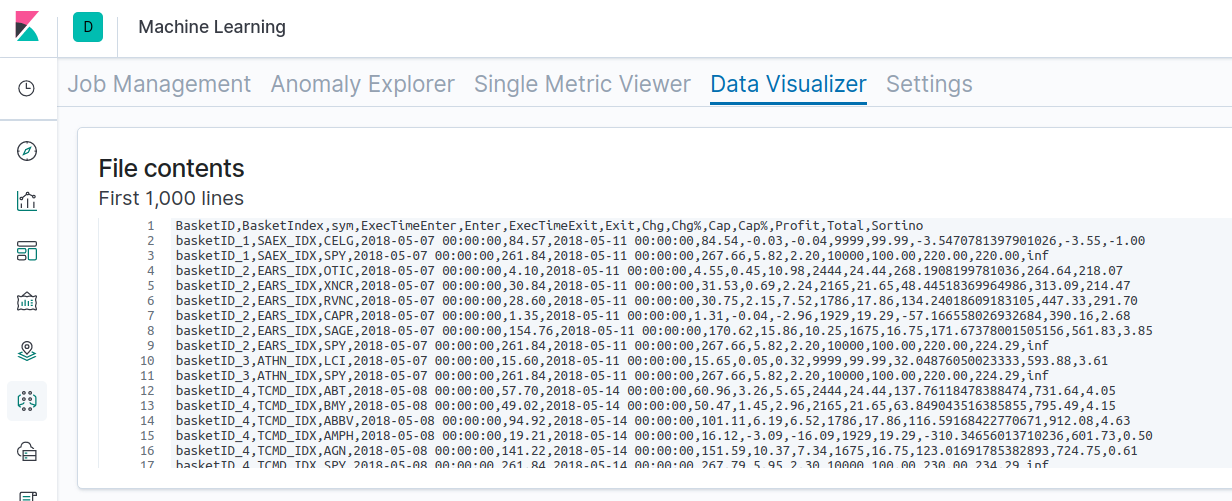
You can view the raw results of one of the backtests here. Backtesting augmented NLU datasets can be performed using the following steps. We’ve used these steps to generate the results above.
- Word embedding doubling as feature vectors are generated for all NYSE and Nasdaq stocks using dataset API.
- A one-year historical period of pricing data from May 1, 2018 to May 1, 2019 for all NYSE and Nasdaq stocks is used to scan for special event triggers defined by a spike in a stock price.
- For any stocks that spike greater than a chosen percentage threshold, e.g., +15%, a cluster or basket of related stocks is generated using the dataset. See the MIN_UPSIDE parameter in the table above.
- Filtering parameters such as volume, market cap, float, etc. are then used to refine the basket.
- Trade entry and exit times are set to four-day holds.
- Returns are calculated for long and short baskets along with the S&P 500 for baseline comparison in addition to Sortino ratios.
- Datasets and returns are monitored, visualized and interpreted via Canvas.
Backtest returns
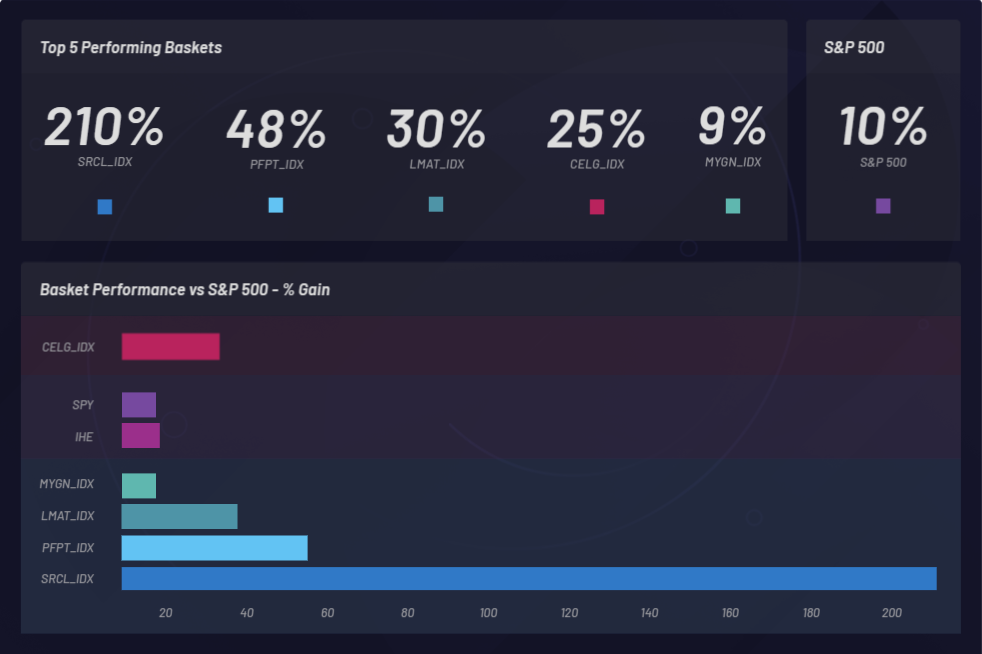
Let’s take a look at the overall results of three one-year backtests with Canvas, from May 1, 2018 to May 1, 2019, based on the performance of all baskets generated during this period.
Backtesting enabled detection of public companies with share prices that increased in value after the Celgene acquisition. An augmented dataset is loaded where correlations can be observed. Baskets (clusters) generated from the dataset can also be viewed based on their performance. A Basket can be compared to the baseline performance of the S&P 500 to make sure you’re at least beating the market. Individual baskets are monitored to determine if they’re outperforming the S&P 500 (SPY):
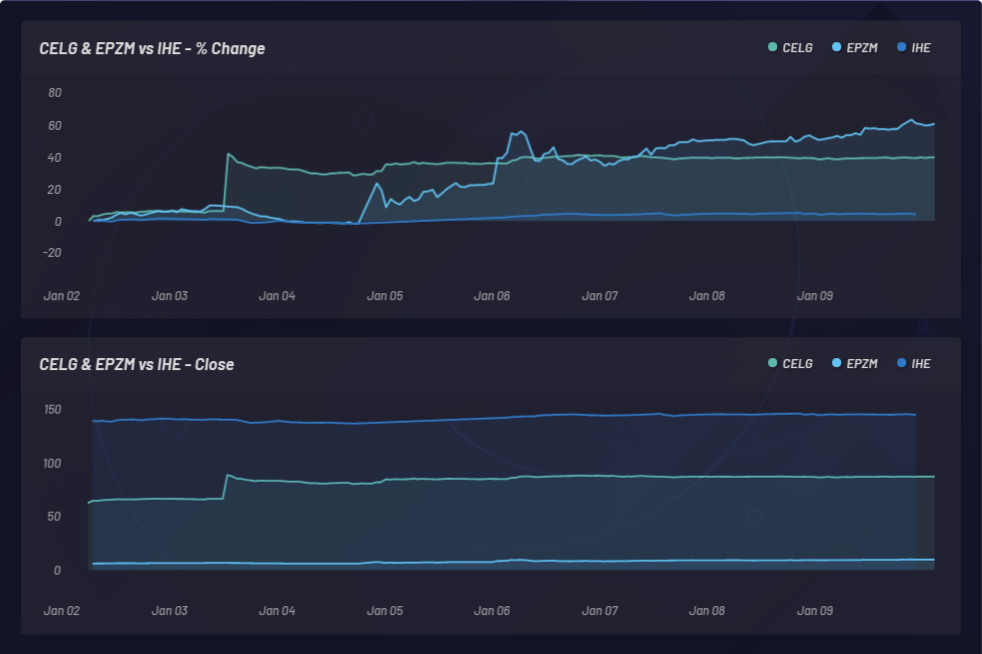
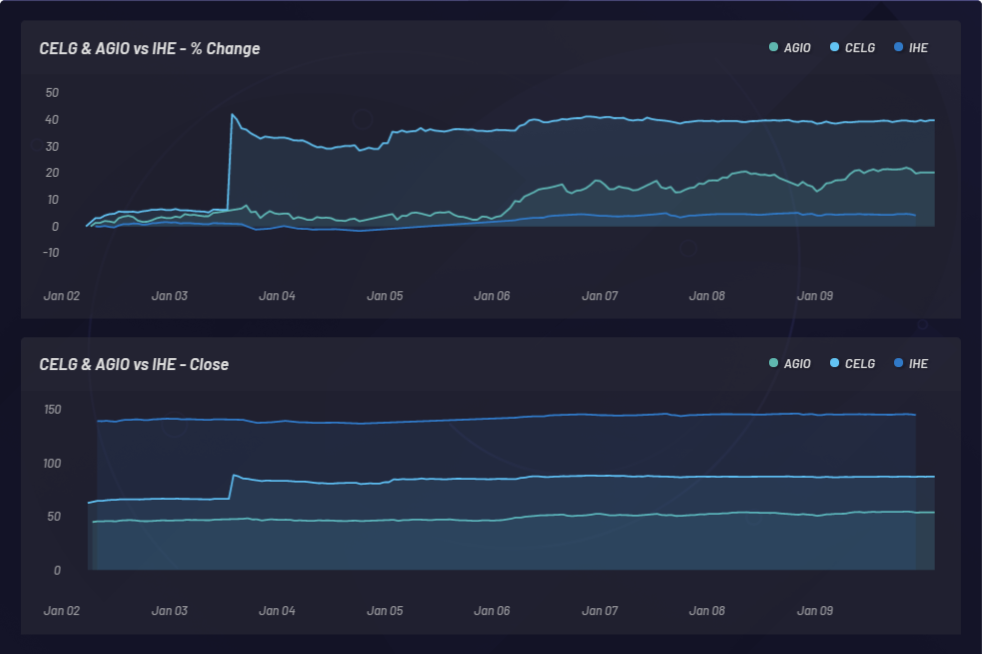
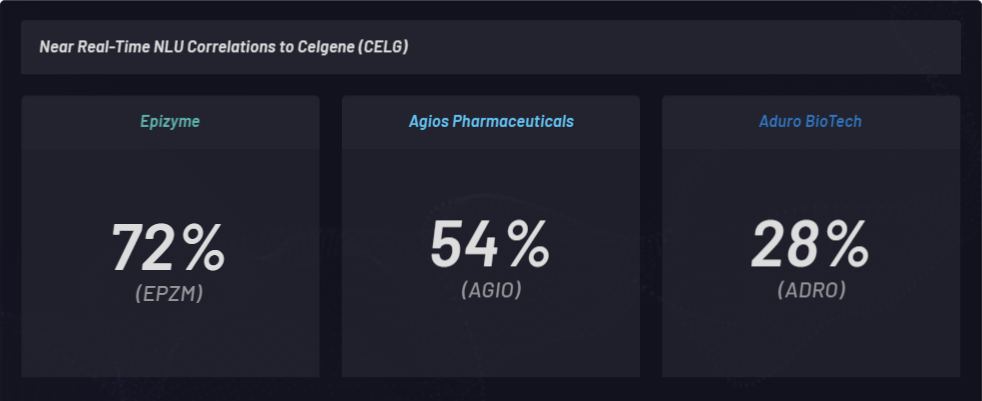
The graphic below shows monitoring of an event and the resulting latent sympathetic movements in other stocks. In this case, CELG (Celgene) was the event and EPZM (Epizyme) was picked as a resulting basket component. NLU-based correlations can predict price-based correlations. Capturing updating NLU-based correlations between equities and events can provide an edge based on asymmetric information arbitrage. Being able to position ahead of the market can only happen if there is a delayed response in price action or price correlation as opposed to any NLU-based correlations between CELG and EPZM, which can be observed here:
CELG (Celgene) vs AGIO (Agios Pharmaceuticals):
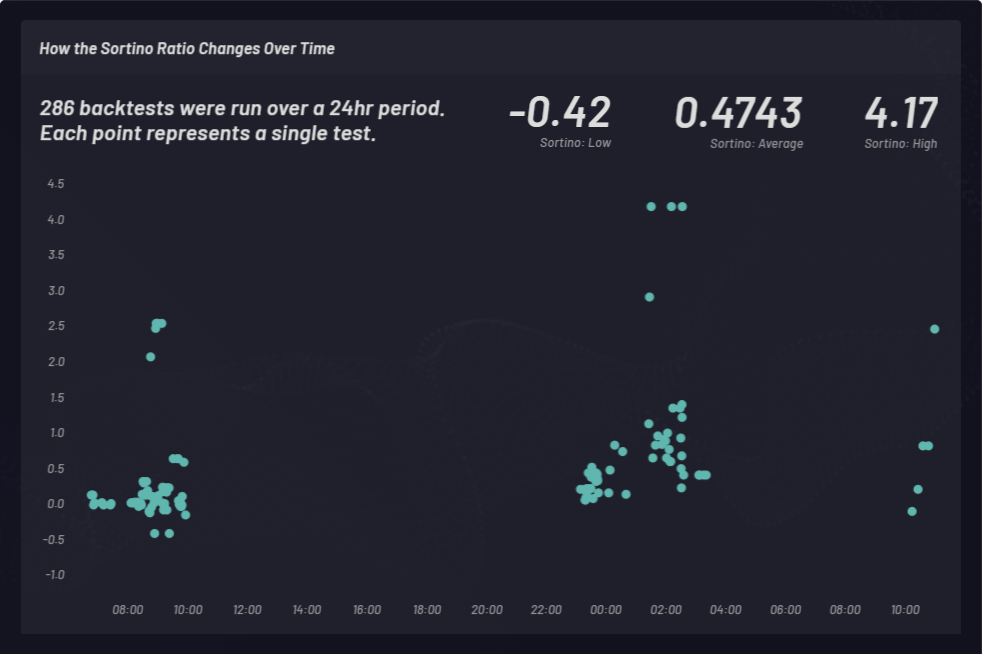
A Sortino ratio is calculated to measure risk-adjusted returns. In the following example, Sortino ratio was chosen over Sharpe ratio to factor upside volatility a bit better. The Sortino ratio changes over time. Backtests were conducted with long baskets at three different times during a 24-hour period as shown below. A total of 286 backtest runs with varying global parameters settings were conducted. Each point in the cluster below represents a single backtest with its corresponding Sortino ratio on the y-axis:
Leveraging changing correlations
The National Library of Medicine publishes around 1,500 peer-reviewed science papers every 24 hours. Vectorspace uses the NLM as one of their data sources.
Correlations between genes, drug compounds, pharmaceutical news and public companies change over time, sometimes within seconds. This can affect signal to noise ratios when discovering compounds that are candidates for drug repurposing and repositioning.
If there are changes in correlation values between a publicly traded pharmaceutical company and a gene, protein, drug compound, microbe or disease, these new relationships will be reflected in the dataset and can be monitored in near real time with Canvas.
Using context control in the creation of NLU-based datasets can result in new kinds of correlation scoring. Controlling the context of NLU relationships can be vital to gaining new insights.
By adding context control, NLU-based datasets can assist researchers in answering questions like “What pharmaceutical stocks are correlated to these drug compounds in the context of DNA damage repair genes based on the latest research?” while offering powerful ways of visualizing and interpreting the answers or results in Canvas.
As approximately 1,500 new peer-reviewed science papers are published every 24 hours along with news and other public filings, changes occur to the correlation scores, which in turn define updated relationships between, for example, public pharmaceutical companies and drug compounds. Combined with in-house data sources, NLU-based datasets can provide unique signals.
Conclusion
Correlations based on Natural Language Processing (NLP) and NLU can enable pathways for generating new insights, hypotheses or discoveries.
There’s a lot more one can do with NLU datasets in life sciences and the financial markets related to contextualized correlations, alternative data sources, feature vectors, visualization and interpretation. Perhaps in the future our teams will discuss some of these topics including augmenting time series datasets for a variety of tradable assets. With individual NLU feature vectors, our teams may explain how to construct graph-based relationship networks or entire networks of clusters rendered with Canvas and other tools in the Elastic Stack. In addition, our teams may describe ways of getting machines to transact feature vectors with one another to minimize selected loss functions based on a utility token API combined with an open market order book.
Vectorspace continues to build related applications for datasets in the analysis of chromosomal damage repair connected to LET radiation (space radiation), epigenetics and lifespan related to human spaceflight. All of this is made more creative and useful with the Elastic Stack, including Canvas and other tools. If you’d like to find out more about dataset augmentations or how to obtain free utility token API credits, contact Vectorspace and we will be happy to provide the necessary data to get you started.
And if you want to try out the Elastic Stack, nab a free 14-day trial of the Elasticsearch Service, or you can download it as part of the default distribution.
Vectorspace invents systems and datasets that mimic human cognition for the purpose of information arbitrage and scientific discovery (high-level AI/NLP/ML) for Genentech, Lawrence Berkeley National Laboratory, the US Department of Energy (DOE), Department of Defense (DOD), NASA's space biosciences division, DARPA, and SPAWAR (Space and Naval Warfare Systems division of the US Navy) among others.
Shaun McGough is a product manager at Elastic, with domain expertise in data visualization and alternative investments.