Configuring SSL, TLS, and HTTPS to secure Elasticsearch, Kibana, Beats, and Logstash
| Running Elastic Stack 6.7.x / 7.0.x or earlier? Then check out the "How to set up TLS..." blog for help securing communications within your versions. The free security features covered in this blog post require Elastic Stack 6.8 / 7.1 or later. |
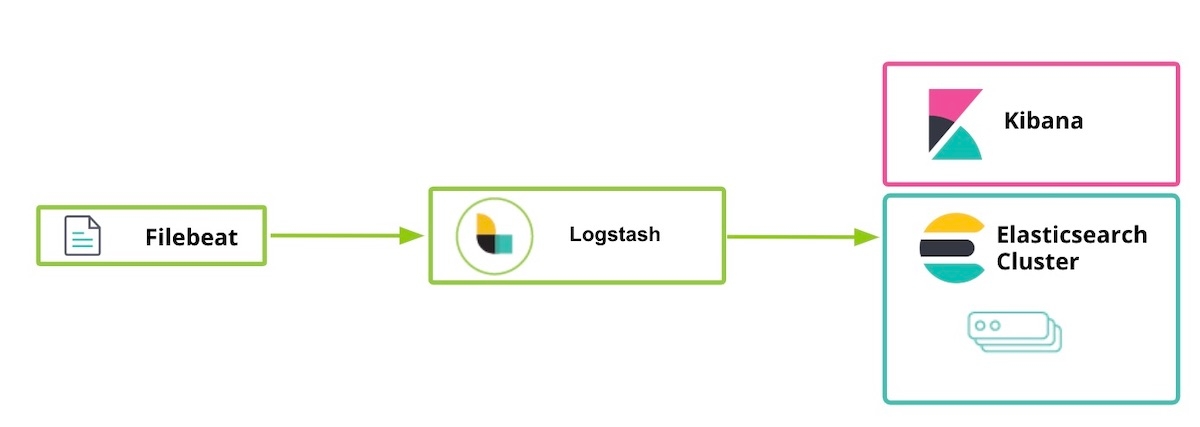
Elastic released some security features for free as part of the default distribution (Basic license) starting in Elastic Stack 6.8 and 7.1. This new feature offering includes the ability to encrypt network traffic using SSL, create and manage users, define roles that protect index and cluster-level access, and fully secure Kibana. Our getting started blog post that came out shortly after the release explains how to use TLS communication between Elasticsearch and Kibana. The following blog expands this guidance to address other components of the Elastic Stack, including Logstash and Beats. It discusses enabling TLS between components as well as encrypting HTTP client communications.
Please note that while enabling TLS on the HTTP layer is not required, it is highly recommended for end-to-end security to protect the data, in particular to protect username/password information from being eavesdropped, leading to a compromised cluster. If you want to know more about TLS encryption, authentication, restricted scripts, or isolation, please check out the blog Tips to secure Elasticsearch clusters for free with encryption, users, and more.
As an additional note, the security features being enabled below come standard with the Elasticsearch Service on Elastic Cloud. If you are operating on the Elasticsearch Service, you can skip straight to step 5.
Steps for securing the Elastic Stack
- Preparations
- Create SSL certificates and enable TLS for Elasticsearch on node1
- Enable TLS for Kibana on node1
- Enable TLS for Elasticsearch on node2
- Prepare Logstash users on node1
- Enable TLS for Logstash on node1
- Run Filebeat and set up TLS on node1
- Use Filebeat to ingest data
Step 1. Preparations
Download the following components of Elastic Stack 7.1 or later:
[1-1] Configure /etc/hosts file
For this example our node1 has a browser installed, so kibana.local will allow access to the Kibana web page.
# /etc/hosts file for [node1] (we need kibana.local and logstash.local)
127.0.0.1 kibana.local logstash.local
192.168.0.2 node1.elastic.test.com node1
192.168.0.3 node2.elastic.test.com node2
# /etc/hosts file for [node2] (we don't need kibana.local and logstash.local here)
192.168.0.2 node1.elastic.test.com node1
192.168.0.3 node2.elastic.test.com node2
Step 2. Create SSL certificates and enable TLS for Elasticsearch on node1
[2-1] Set environment variables (adapt these variables path depending on where and how Elasticsearch was downloaded)
[root@node1 ~]# ES_HOME=/usr/share/elasticsearch
[root@node1 ~]# ES_PATH_CONF=/etc/elasticsearch
[2-2] Create tmp folder
[root@node1 ~]# mkdir tmp
[root@node1 ~]# cd tmp/
[root@node1 tmp]# mkdir cert_blog
[2-3] Create instance yaml file
[root@node1 cert_blog]# vi ~/tmp/cert_blog/instance.yml
# add the instance information to yml file
instances:
  - name: 'node1'
    dns: [ 'node1.elastic.test.com' ]
  - name: "node2"
    dns: [ 'node2.elastic.test.com' ]
  - name: 'my-kibana'
    dns: [ 'kibana.local' ]
  - name: 'logstash'
    dns: [ 'logstash.local' ]
[2-4] Generate CA and server certificates (once Elasticsearch is installed)
[root@node1 tmp]# cd $ES_HOME
[root@node1 elasticsearch]# bin/elasticsearch-certutil cert --keep-ca-key --pem --in ~/tmp/cert_blog/instance.yml --out ~/tmp/cert_blog/certs.zip
[2-5] Unzip the certificates
[root@node1 elasticsearch]# cd ~/tmp/cert_blog
[root@node1 cert_blog]# unzip certs.zip -d ./certs
[2-6] Elasticsearch TLS setup
[2-6-1] Copy cert file to config folder
[root@node1 ~]# cd $ES_PATH_CONF
[root@node1 elasticsearch]# pwd
/etc/elasticsearch
[root@node1 elasticsearch]# mkdir certs
[root@node1 elasticsearch]# cp ~/tmp/cert_blog/certs/ca/ca* ~/tmp/cert_blog/certs/node1/* certs
[root@node1 elasticsearch]# ll certs
total 12
-rw-r--r--. 1 root elasticsearch 1834 Apr 12 08:47 ca.crt
-rw-r--r--. 1 root elasticsearch 1834 Apr 12 08:47 ca.key
-rw-r--r--. 1 root elasticsearch 1509 Apr 12 08:47 node1.crt
-rw-r--r--. 1 root elasticsearch 1679 Apr 12 08:47 node1.key
[root@node1 elasticsearch]#
[2-6-2] Configure elasticsearch.yml
[root@node1 elasticsearch]# vi elasticsearch.yml
## add the following contents
node.name: node1
network.host: node1.elastic.test.com
xpack.security.enabled: true
xpack.security.http.ssl.enabled: true
xpack.security.transport.ssl.enabled: true
xpack.security.http.ssl.key: certs/node1.key
xpack.security.http.ssl.certificate: certs/node1.crt
xpack.security.http.ssl.certificate_authorities: certs/ca.crt
xpack.security.transport.ssl.key: certs/node1.key
xpack.security.transport.ssl.certificate: certs/node1.crt
xpack.security.transport.ssl.certificate_authorities: certs/ca.crt
discovery.seed_hosts: [ "node1.elastic.test.com" ]
cluster.initial_master_nodes: [ "node1" ]
[2-6-3] Start and check cluster log
[root@node1 elasticsearch]# grep '\[node1\] started' /var/log/elasticsearch/elasticsearch.log
[o.e.n.Node               ] [node1] started
[2-6-4] Set built-in user password
[root@node1 elasticsearch]# cd $ES_HOME
[root@node1 elasticsearch]# bin/elasticsearch-setup-passwords auto -u "https://node1.elastic.test.com:9200"
Initiating the setup of passwords for reserved users elastic,apm_system,kibana,logstash_system,beats_system,remote_monitoring_user.
The passwords will be randomly generated and printed to the console.
Please confirm that you would like to continue [y/N] y
Changed password for user apm_system
PASSWORD apm_system = <apm_system_password>
Changed password for user kibana
PASSWORD kibana = <kibana_password>
Changed password for user logstash_system
PASSWORD logstash_system = <logstash_system_password>
Changed password for user beats_system
PASSWORD beats_system = <beats_system_password>
Changed password for user remote_monitoring_user
PASSWORD remote_monitoring_user = <remote_monitoring_user_password>
Changed password for user elastic
PASSWORD elastic = <elastic_password>
[2-6-5] Access _cat/nodes API via HTTPS
[root@node1 elasticsearch]# curl --cacert ~/tmp/cert_blog/certs/ca/ca.crt -u elastic 'https://node1.elastic.test.com:9200/_cat/nodes?v'
Enter host password for user 'elastic':
ip          heap.percent ram.percent cpu load_1m load_5m load_15m node.role master name
192.168.0.2           16          95  10    0.76    0.59     0.38 mdi       *      node1
| When we generated our SSL certificates in step 2-4, we provided the --keep-ca-key option which means the certs.zip file contains a ca/ca.key file alongside the ca/ca.crt file. If you ever decide to add more nodes to your Elasticsearch cluster, you'll want to generate additional node certificates, and for that you will need both of those "ca" files as well as the password you used to generate them. Please keep a copy of these ca files and the password used to generate them in a safe place. |
Step 3. Enable TLS for Kibana on node1
[3-1] Set environment variables
Adapt these variable paths depending on where and how Kibana was downloaded:
[root@node1 ~]# KIBANA_HOME=/usr/share/kibana
[root@node1 ~]# KIBANA_PATH_CONFIG=/etc/kibana
[3-2] Create config and config/certs folder and copy certs (once Kibana is installed)
Copy the certification files created previously in step 2-4 and paste on kibana/config/certs.
[root@node1 kibana]# ls config/certs
total 12
ca.crt
my-kibana.crt
my-kibana.key
[3-3] Configure kibana.yml
Remember to use the password generated for the built-in user above. You need to replace <kibana_password> with the password that was defined in step 2-6-4.
[root@node1 kibana]# vi kibana.yml
server.name: "my-kibana"
server.host: "kibana.local"
server.ssl.enabled: true
server.ssl.certificate: /etc/kibana/config/certs/my-kibana.crt
server.ssl.key: /etc/kibana/config/certs/my-kibana.key
elasticsearch.hosts: ["https://node1.elastic.test.com:9200"]
elasticsearch.username: "kibana"
elasticsearch.password: "<kibana_password>"
elasticsearch.ssl.certificateAuthorities: [ "/etc/kibana/config/certs/ca.crt" ]
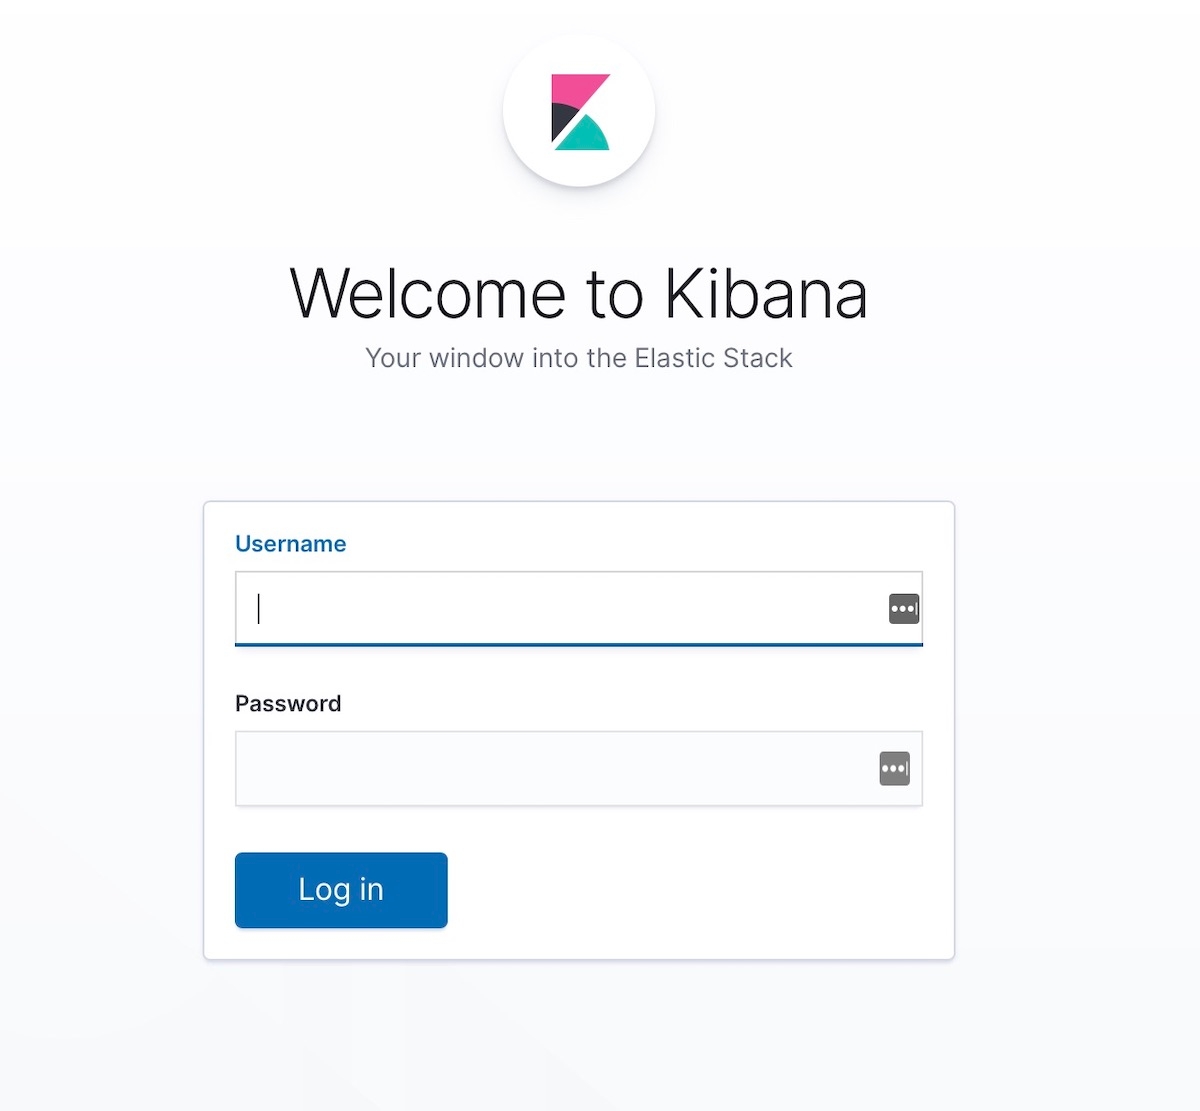
[3-4] Start Kibana and test Kibana login
Access https://kibana.local:5601/ from a browser. Log in using the elastic user and the password that was defined in step 2-6-4. For this example our node1 has a browser installed, so the kibana.local will allow access to Kibana.
Publicly trusted authorities have very strict standards and auditing practices to ensure that a certificate is not created without validating proper identity ownership. For the purpose of this blog post, we will create a self-signed certificate for Kibana (meaning the generated certificate was signed by using its own private key). Due to clients not trusting self-signed Kibana certificates, you will see a message similar to the following in your Kibana logs, until proper trust is established by using certificates generated by an enterprise or public CA (here's the link to the issue in the Kibana repo). This issue does not affect your ability to work in Kibana:
[18:22:31.675] [error][client][connection] Error: 4443837888:error:14094416:SSL routines:ssl3_read_bytes:sslv3 alert certificate unknown:../deps/openssl/openssl/ssl/s3_pkt.c:1498:SSL alert number 46
Step 4. Enable TLS for Elasticsearch on node2
[4-1] Set environment variables
[root@node2 ~]# ES_HOME=/usr/share/elasticsearch
[root@node2 ~]# ES_PATH_CONF=/etc/elasticsearch
[4-2] Set up TLS on node2
You can use the scp command to copy certificates from node1 to node2. Both nodes require the certificate and key in order to secure the connection. In a Production environment, it is recommended to use a properly signed key for each node. For demonstration purposes, we are using an automatically generated CA certificate and multi-DNS hostname certificate signed by our generated CA.
[root@node2 ~]# cd $ES_PATH_CONF
[root@node2 elasticsearch]# pwd
/etc/elasticsearch
[root@node2 elasticsearch]# mkdir certs
[root@node2 elasticsearch]# cp ~/tmp/cert_blog/certs/ca/ca.crt ~/tmp/cert_blog/certs/node2/* certs
[root@node2 elasticsearch]#
[root@node2 elasticsearch]# ll certs
total 12
-rw-r--r--. 1 root elasticsearch 1834 Apr 12 10:55 ca.crt
-rw-r--r--. 1 root elasticsearch 1509 Apr 12 10:55 node2.crt
-rw-r--r--. 1 root elasticsearch 1675 Apr 12 10:55 node2.key
[4-3] Configure elasticsearch.yml
[root@node2 elasticsearch]# vi elasticsearch.yml
node.name: node2
network.host: node2.elastic.test.com
xpack.security.enabled: true
xpack.security.http.ssl.enabled: true
xpack.security.transport.ssl.enabled: true
xpack.security.http.ssl.key: certs/node2.key
xpack.security.http.ssl.certificate: certs/node2.crt
xpack.security.http.ssl.certificate_authorities: certs/ca.crt
xpack.security.transport.ssl.key: certs/node2.key
xpack.security.transport.ssl.certificate: certs/node2.crt
xpack.security.transport.ssl.certificate_authorities: certs/ca.crt
discovery.seed_hosts: [ "node1.elastic.test.com" ]
[4-4] Start and check cluster log
[root@node2 elasticsearch]# grep '\[node2\] started' /var/log/elasticsearch/elasticsearch.log
[o.e.n.Node               ] [node2] started
[4-5] Access _cat/nodes API via HTTPS
[root@node2 elasticsearch]# curl --cacert ~/tmp/cert_blog/certs/ca/ca.crt -u elastic:<password set previously> 'https://node2.elastic.test.com:9200/_cat/nodes?v'
ip          heap.percent ram.percent cpu load_1m load_5m load_15m node.role master name
192.168.0.2           25          80   5    0.18    0.14     0.30 mdi       *      node1
192.168.0.3           14          96  44    0.57    0.47     0.25 mdi       -      node2
Step 5. Prepare Logstash users on node1
[5-1] Create logstash_write_role
You can create the role multiple ways.
You can create it by using the Kibana Roles UI:
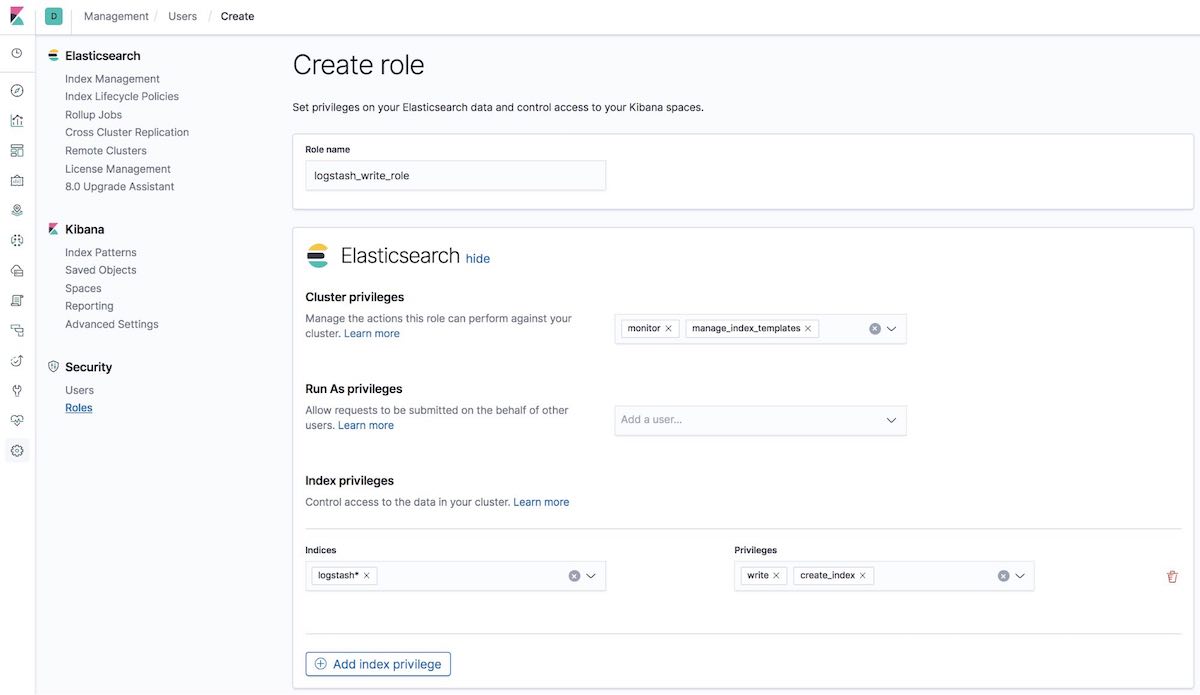
Or create it by using the API in the Kibana Dev Tools tab:
POST /_security/role/logstash_write_role
{
    "cluster": [
      "monitor",
      "manage_index_templates"
    ],
    "indices": [
      {
        "names": [
          "logstash*"
        ],
        "privileges": [
          "write",
          "create_index"
        ],
        "field_security": {
          "grant": [
            "*"
          ]
        }
      }
    ],
    "run_as": [],
    "metadata": {},
    "transient_metadata": {
      "enabled": true
    }
}
And you'll get the response:
{"role":{"created":true}}
The users who have this role assigned will not be able to delete any document. This role restricts the users to create indices only if they start with logstash or index documents on those indices.
Note for ILM users: For the logstash_writer_role to work with index lifecycle management (ILM) — enabled by default in 7.3+ — the following privileges must be included:"privileges": ["write","create","delete","create_index","manage","manage_ilm"] |
[5-2] Create logstash_writer user (please change the password for the user logstash_writer)
You can create the user multiple ways.
You can create it by using the Kibana Users UI:
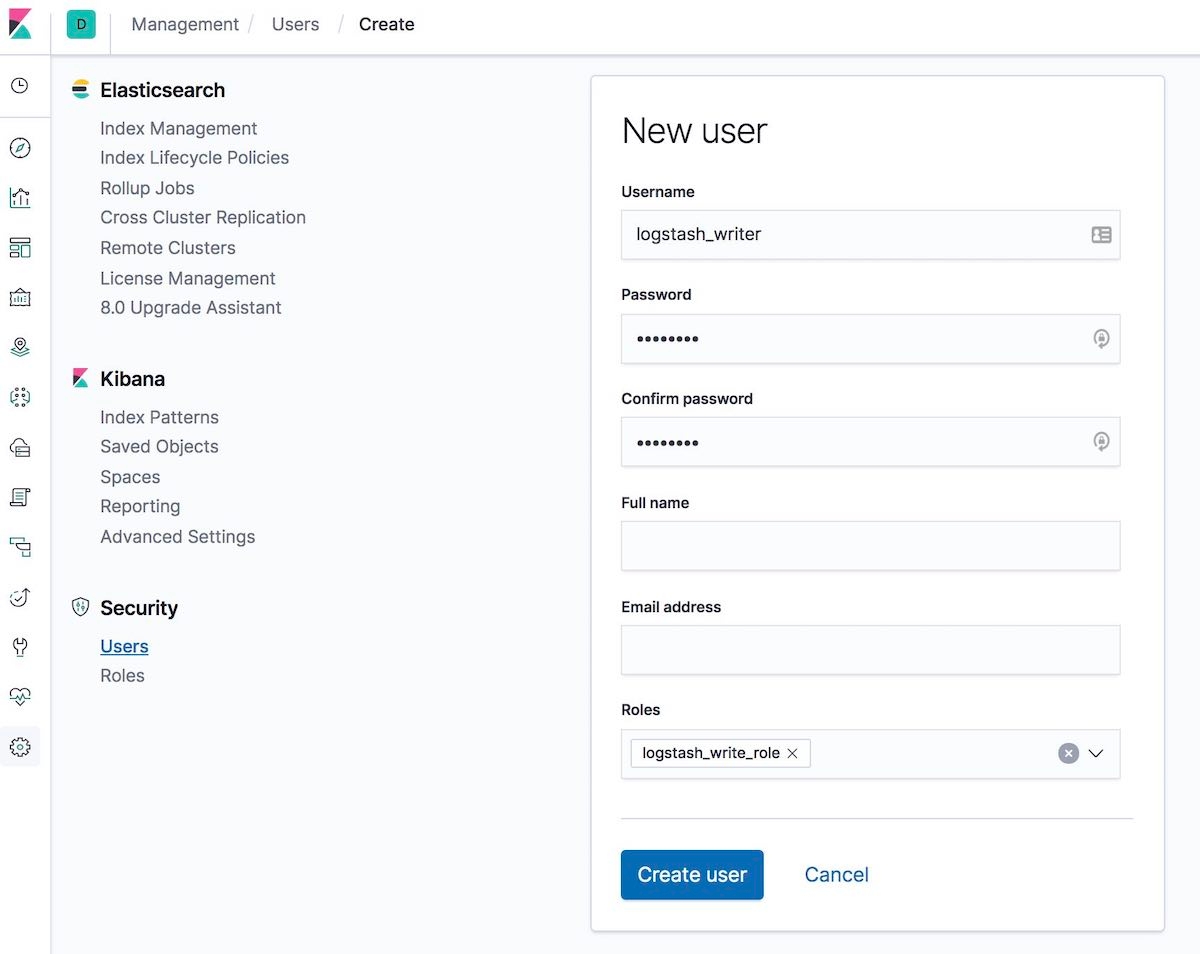
Or create it by using the API in the Kibana Dev Tools tab:
POST /_security/user/logstash_writer
{
  "username": "logstash_writer",
  "roles": [
    "logstash_write_role"
  ],
  "full_name": null,
  "email": null,
  "password": "<logstash_system_password>",
  "enabled": true
}
And you'll get the response:
{"user":{"created":true}}
Step 6. Enable TLS for Logstash on node1
[6-1] Create folder and copy certificates
[root@node1 logstash]# ls -l
total 24
ca.crt
logstash.crt
logstash.key
[6-2] Convert logstash.key to PKCS#8 format for Beats input plugin
[root@node1 logstash]# openssl pkcs8 -in config/certs/logstash.key -topk8 -nocrypt -out config/certs/logstash.pkcs8.key
[6-3] Configure logstash.yml
Remember to use the auto-generated password for logstash_system user. Use the password defined in step 2-6-4.
[root@node1 logstash]# vi logstash.yml
Then edit:
node.name: logstash.local
path.config: /etc/logstash/conf.d/*.conf
xpack.monitoring.enabled: true
xpack.monitoring.elasticsearch.username: logstash_system
xpack.monitoring.elasticsearch.password: '<logstash_system_password>'
xpack.monitoring.elasticsearch.hosts: [ 'https://node1.elastic.test.com:9200' ]
xpack.monitoring.elasticsearch.ssl.certificate_authority: /etc/logstash/config/certs/ca.crt
[6-4] Create and configure conf.d/example.conf
On the Elasticsearch output use the password defined in step 5-2.
[root@node1 logstash]# vi conf.d/example.conf
input {
  beats {
    port => 5044
    ssl => true
    ssl_key => '/etc/logstash/config/certs/logstash.pkcs8.key'
    ssl_certificate => '/etc/logstash/config/certs/logstash.crt'
  }
}
output {
  elasticsearch {
    hosts => ["https://node1.elastic.test.com:9200","https://node2.elastic.test.com:9200"]
    cacert => '/etc/logstash/config/certs/ca.crt'
    user => 'logstash_writer'
    password => <logstash_writer_password>
  }
}
[6-5] Start Logstash with the example configuration and check the Logstash log
We should see the following log messages:
[INFO ][logstash.pipeline ] Pipeline started successfully {:pipeline_id=>".monitoring-logstash", :thread=>"#<Thread:0x640c14d2@/usr/share/logstash/logstash-core/lib/logstash/pipeline.rb:246 run
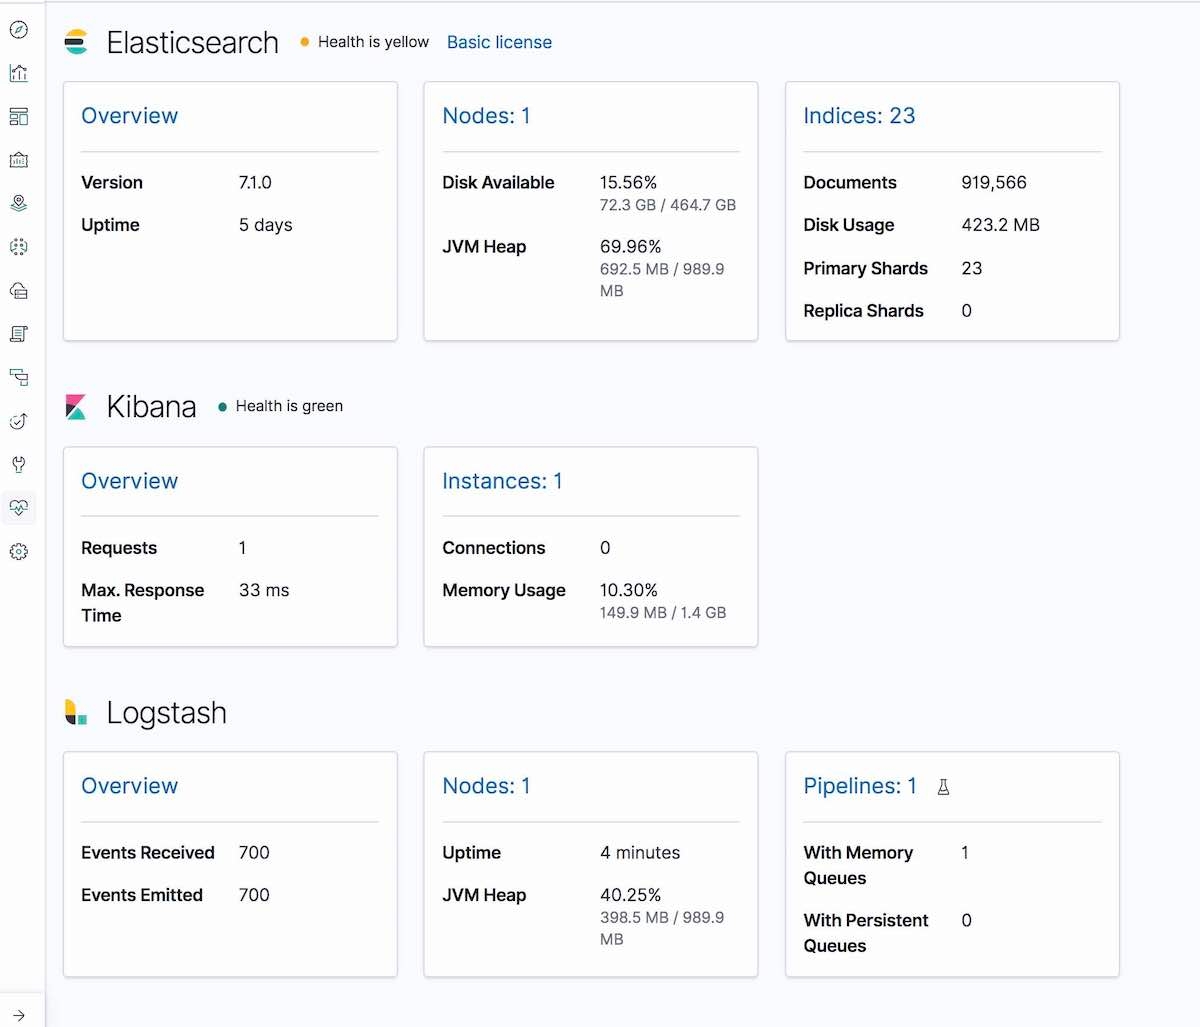
And in the Kibana Monitoring tab, Logstash will be displayed (node info, pipeline settings, OS info, JVM info, process stats, and pipeline runtime stats):
Step 7. Run Filebeat and set up TLS on node1
[7-1] Create a config folder and copy certificates
[root@node1 filebeat]# mkdir config
[root@node1 filebeat]# mkdir config/certs
[root@node1 filebeat]# cp ~/tmp/cert_blog/certs/ca/ca.crt config/certs
[root@node1 filebeat]# ll config/certs/
total 4
-rw-r--r--. 1 root root 1834 Apr 20 00:18 ca.crt
[7-2] Create a new filebeat.yml
[root@node1 filebeat]# pwd
/etc/filebeat
[root@node1 filebeat]# mv filebeat.yml filebeat.yml.old
[7-3] Edit your new configuration file filebeat.yml
filebeat.inputs:
- type: log
  paths:
    - /etc/filebeat/logstash-tutorial-dataset
output.logstash:
  hosts: ["logstash.local:5044"]
  ssl.certificate_authorities:
    - /etc/filebeat/config/certs/ca.crt
Step 8. Use Filebeat to ingest data
[8-1] Prepare input log data (logstash-tutorial.log) for Filebeat
First, download the input log data.
[root@node1 filebeat]# pwd
/etc/filebeat
[root@node1 filebeat]# mkdir logstash-tutorial-dataset
[root@node1 filebeat]# cp /root/logstash-tutorial.log logstash-tutorial-dataset/.
[root@node1 filebeat]# ll logstash-tutorial-dataset/
total 24
-rwxr-x---. 1 root root 24464 Apr 20 00:29 logstash-tutorial.log
[8-2] Start Filebeat
[root@node1 filebeat]# systemctl start filebeat
[root@node1 filebeat]# systemctl enable filebeat
Created symlink from /etc/systemd/system/multi-user.target.wants/filebeat.service to /usr/lib/systemd/system/filebeat.service.
[8-3] Check the log
We should see the following log messages:
INFO log/harvester.go:216 Harvester started for file: /etc/filebeat/logstash-tutorial-dataset/logstash-tutorial.log
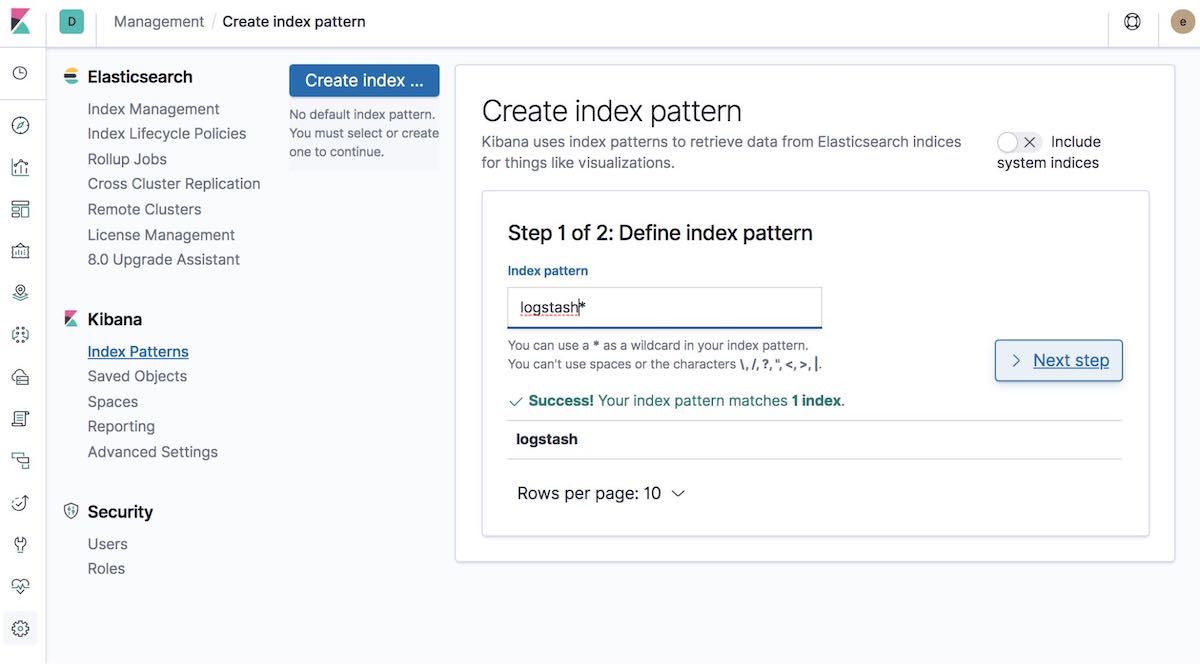
[8-4] Create index pattern
Next, create an index pattern that matches the data that is being ingested. This will allow visualizing the data in Kibana, such as with Graph or Discover.
Then select the Time Filter field name. In our example, this is @timestamp:
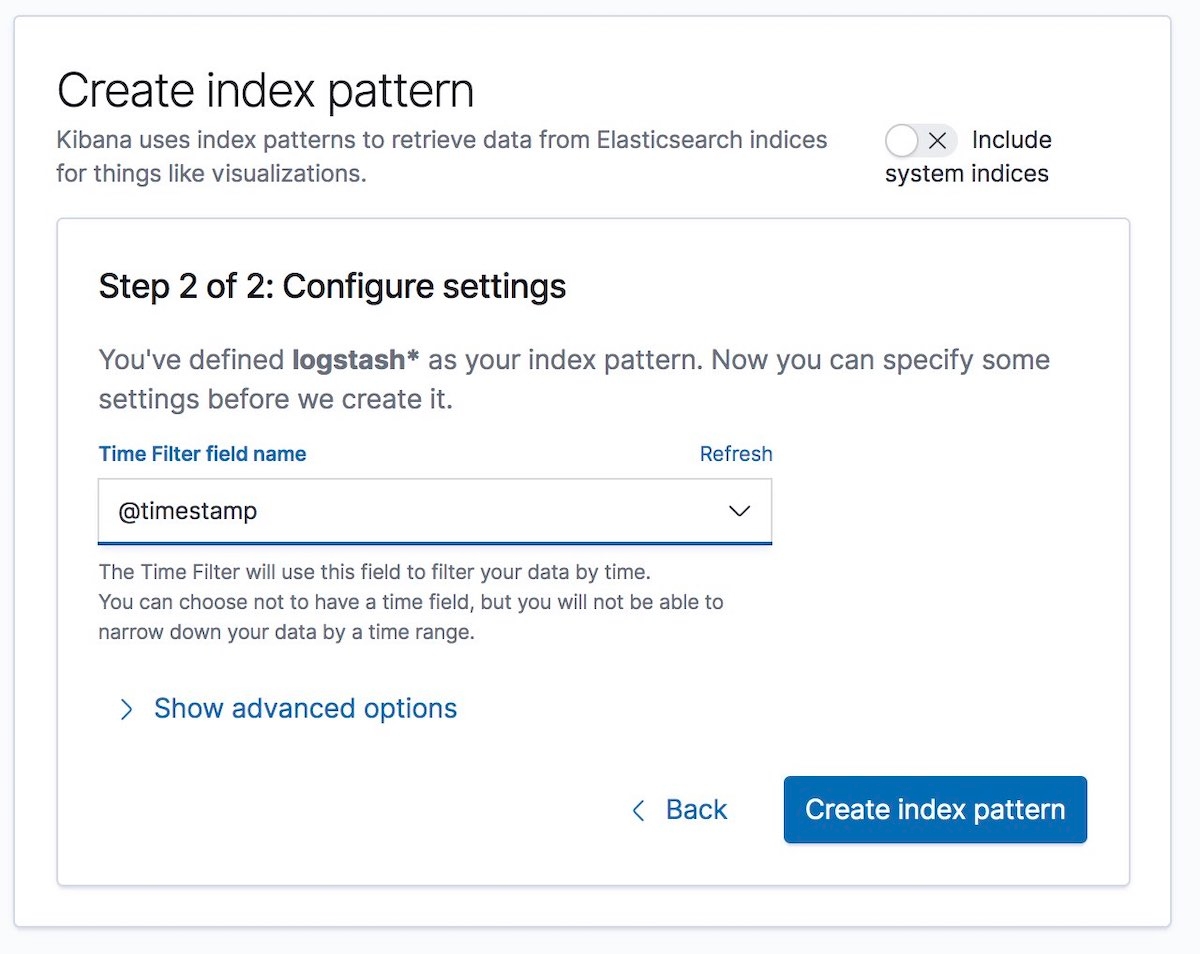
And that’s it! You have encrypted the communication between the different parts of the Elastic Stack, and now you’re safely and securely ingesting log data.
A few last things...
If you run into any issues while configuring security, the first place we’d recommend turning is the security troubleshooting guide in our documentation. It can help with many common issues. If you still have questions after that, you should check out our Elastic forums for additional help. Or if you want to talk to the Elastic Support team directly, start an Elastic subscription today and have direct access to a team of experts. Be safe out there!