Getting started with Elasticsearch security
| UPDATE: This blog references outdated steps for configuring Elasticsearch security. For the the most current information, refer to our technical documentation for configuring security for the Elastic Stack. |
Starting with Elastic Stack 6.8 and 7.1, security features like TLS encrypted communication, role-based access control (RBAC), and more are available for free within the default distribution. In this blog post, we’re going to cover how to get started with using these features to secure your Elasticsearch clusters.
As a practical example of securing an Elastic Stack implementation, we’re going to create and secure a 2-node Elasticsearch cluster on a local machine. To do so, we’ll first configure TLS communication between the two nodes. Then we'll enable security for the Kibana instance being used to analyze and visualize the data in the cluster. After that, we’ll configure role-based access control within Kibana to make sure that users can only see data they’re authorized to see.
While there’s a lot more to how security works, for now, we’re just going to cover what you need to get started. After reading this blog, we’d recommend checking out our documentation on securing the Elastic Stack, which includes helpful practical examples. As a quick note, we’ll be doing this all on a local cluster because, while these features became available by default in 6.8 and 7.1, they have always come standard with our Elasticsearch Service.
Install Elasticsearch and Kibana
For this example, I’ll be installing on a laptop running Linux. Adjust the steps listed below to your specific environment.
Step 1: Download Elasticsearch and Kibana
The first thing you have to do is download the default distribution of Elasticsearch and Kibana version 6.8+ or 7.1+. Security was added to the default distribution in 7.1 and 6.8, so if you’re on an older version, you’ll need to upgrade.
Step 2: Extract Elasticsearch and Kibana
For this example, I’ve downloaded elasticsearch-7.1.0-linux-x86_64.tar.gz and kibana-7.1.0-linux-x86_64.tar.gz. Once downloaded, their contents need to be extracted.
Step 3: Create two Elasticsearch nodes
To create a 2-node cluster, make two copies of the Elasticsearch directory, one named master one named node. After completing this step, you’ll have the following files and folders:
elasticsearch-7.1.0                      elasticsearch-7.1.0-node
elasticsearch-7.1.0-linux-x86_64.tar.gz  kibana-7.1.0-linux-x86_64
elasticsearch-7.1.0-master               kibana-7.1.0-linux-x86_64.tar.gz
Configure TLS and authentication
The first thing we have to do is generate some certificates that allow the nodes to communicate securely. You can do this with an enterprise CA, but for this demo, we have a command called elasticsearch-certutil you can run to do this without any of the usual certificate confusion.
Step 1: TLS on Elasticsearch master
You can cd into the master directory and then run this command:
bin/elasticsearch-certutil cert -out config/elastic-certificates.p12 -pass ""
Next, open up the file config/elasticsearch.yaml in your favorite text editor. Paste the lines below at the end of the file.
xpack.security.enabled: true
xpack.security.transport.ssl.enabled: true
xpack.security.transport.ssl.verification_mode: certificate
xpack.security.transport.ssl.keystore.path: elastic-certificates.p12
xpack.security.transport.ssl.truststore.path: elastic-certificates.p12
Save the file, and we’re ready to start the master node. Run the command bin/elasticsearch. This executable has to keep running, put this terminal aside for now.
Step 2: Elasticsearch cluster passwords
Once the master node is running, it’s time to set the passwords for the cluster. In a new terminal we have to cd into our master node directory. Then we run the command bin/elasticsearch-setup-passwords auto. This will generate random passwords for the various internal stack users. You can alternatively skip the auto parameter to manually define your passwords using the interactive parameter. Keep track of these passwords, we’ll need them again soon.
Step 3: TLS on Elasticsearch node
Now let’s open another new terminal and cd into our node directory. In my case, this was named elasticsearch-7.1.0-node.
The easiest thing we can do is to just copy everything from the master’s config directory into the node’s config directory.
cp ../elasticsearch-7.1.0-master/config/* config/
You should also add the configuration option node.master: false to the config/elasticsearch.yml file. I won’t get into the details here, you can find additional details in our cluster documentation. Alternative to just copying the config files wholesale, you can simply copy the certificate files and then set the xpack.security.* keys the same as with the master node.
Then we start the node by running bin/elasticsearch. We’ll see it join the cluster. And if we look at the master node’s terminal window we can see a message there that a node joined the cluster. Now we have a 2-node cluster running.
Step 4: Security in Kibana
The last thing we need to do is configure Kibana. Once again open another terminal window (this is the last one, I promise). We’ll need to add the password for the Kibana user. We can grab that from the previous output of the setup-passwords command.
Let’s cd into the Kibana directory and open up the config/kibana.yml file with your text editor. Find the lines that look like this
#elasticsearch.username: "user"
#elasticsearch.password: "pass"
Uncomment the username and password fields by removing the # character at the beginning of the line. Change "user" to "kibana" and then change "pass" to whatever the setup-passwords command tells us the Kibana password is. Save the file then we can start Kibana by running bin/kibana.
Configure role-based access control (RBAC) within Kibana
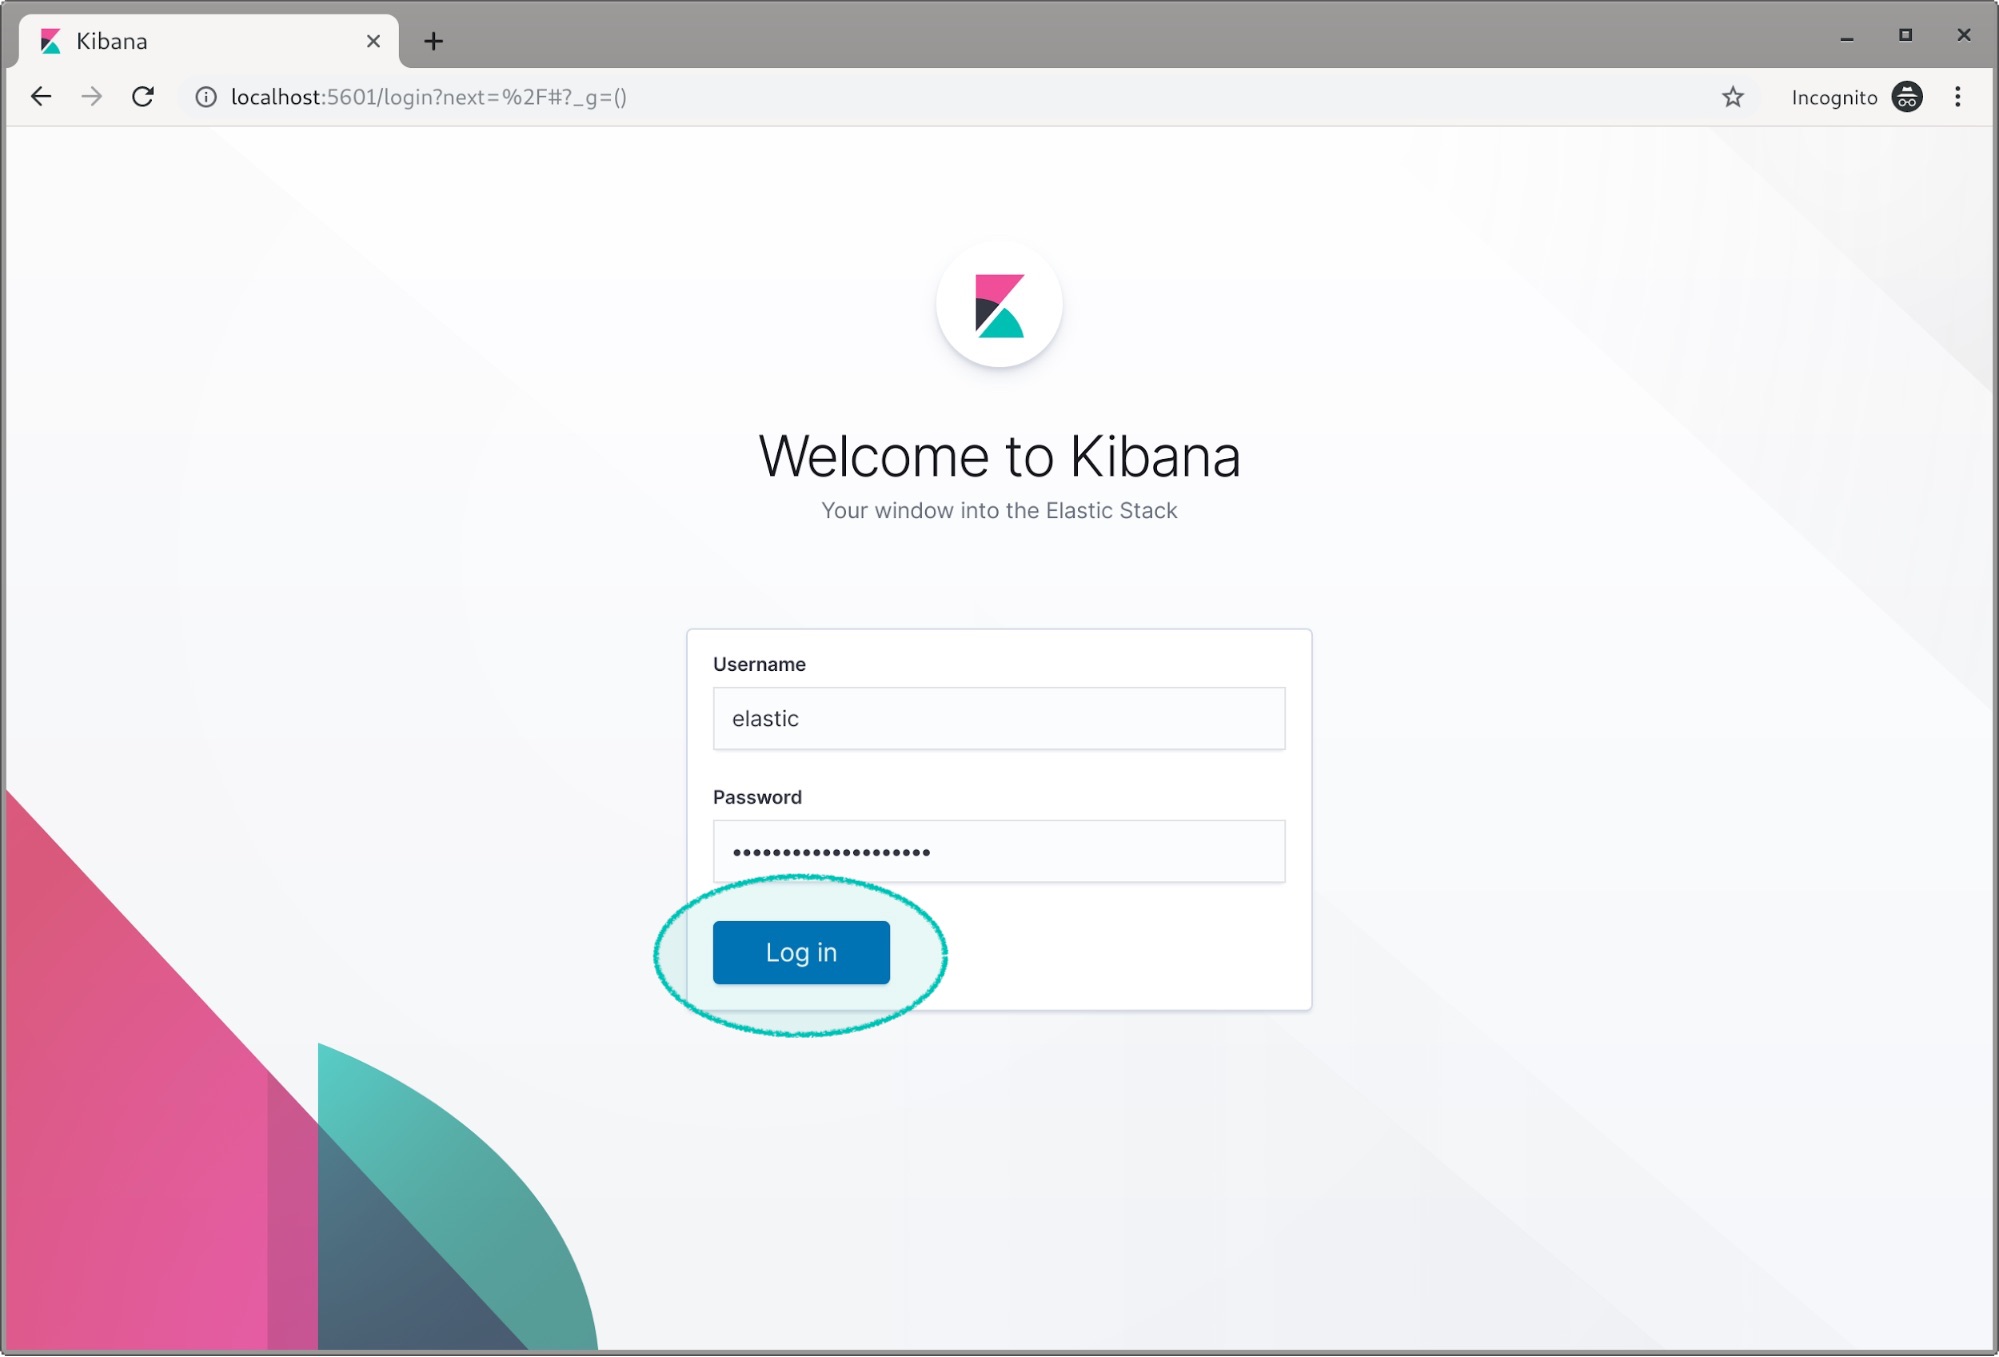
Once Kibana is running we can switch over to our web browser and open http://localhost:5601. It’s going to ask us for a login, we’ll use the elastic superuser with the password from setup-passwords.
Kibana will ask us if we want to load some sample data when it’s a new install such as this.
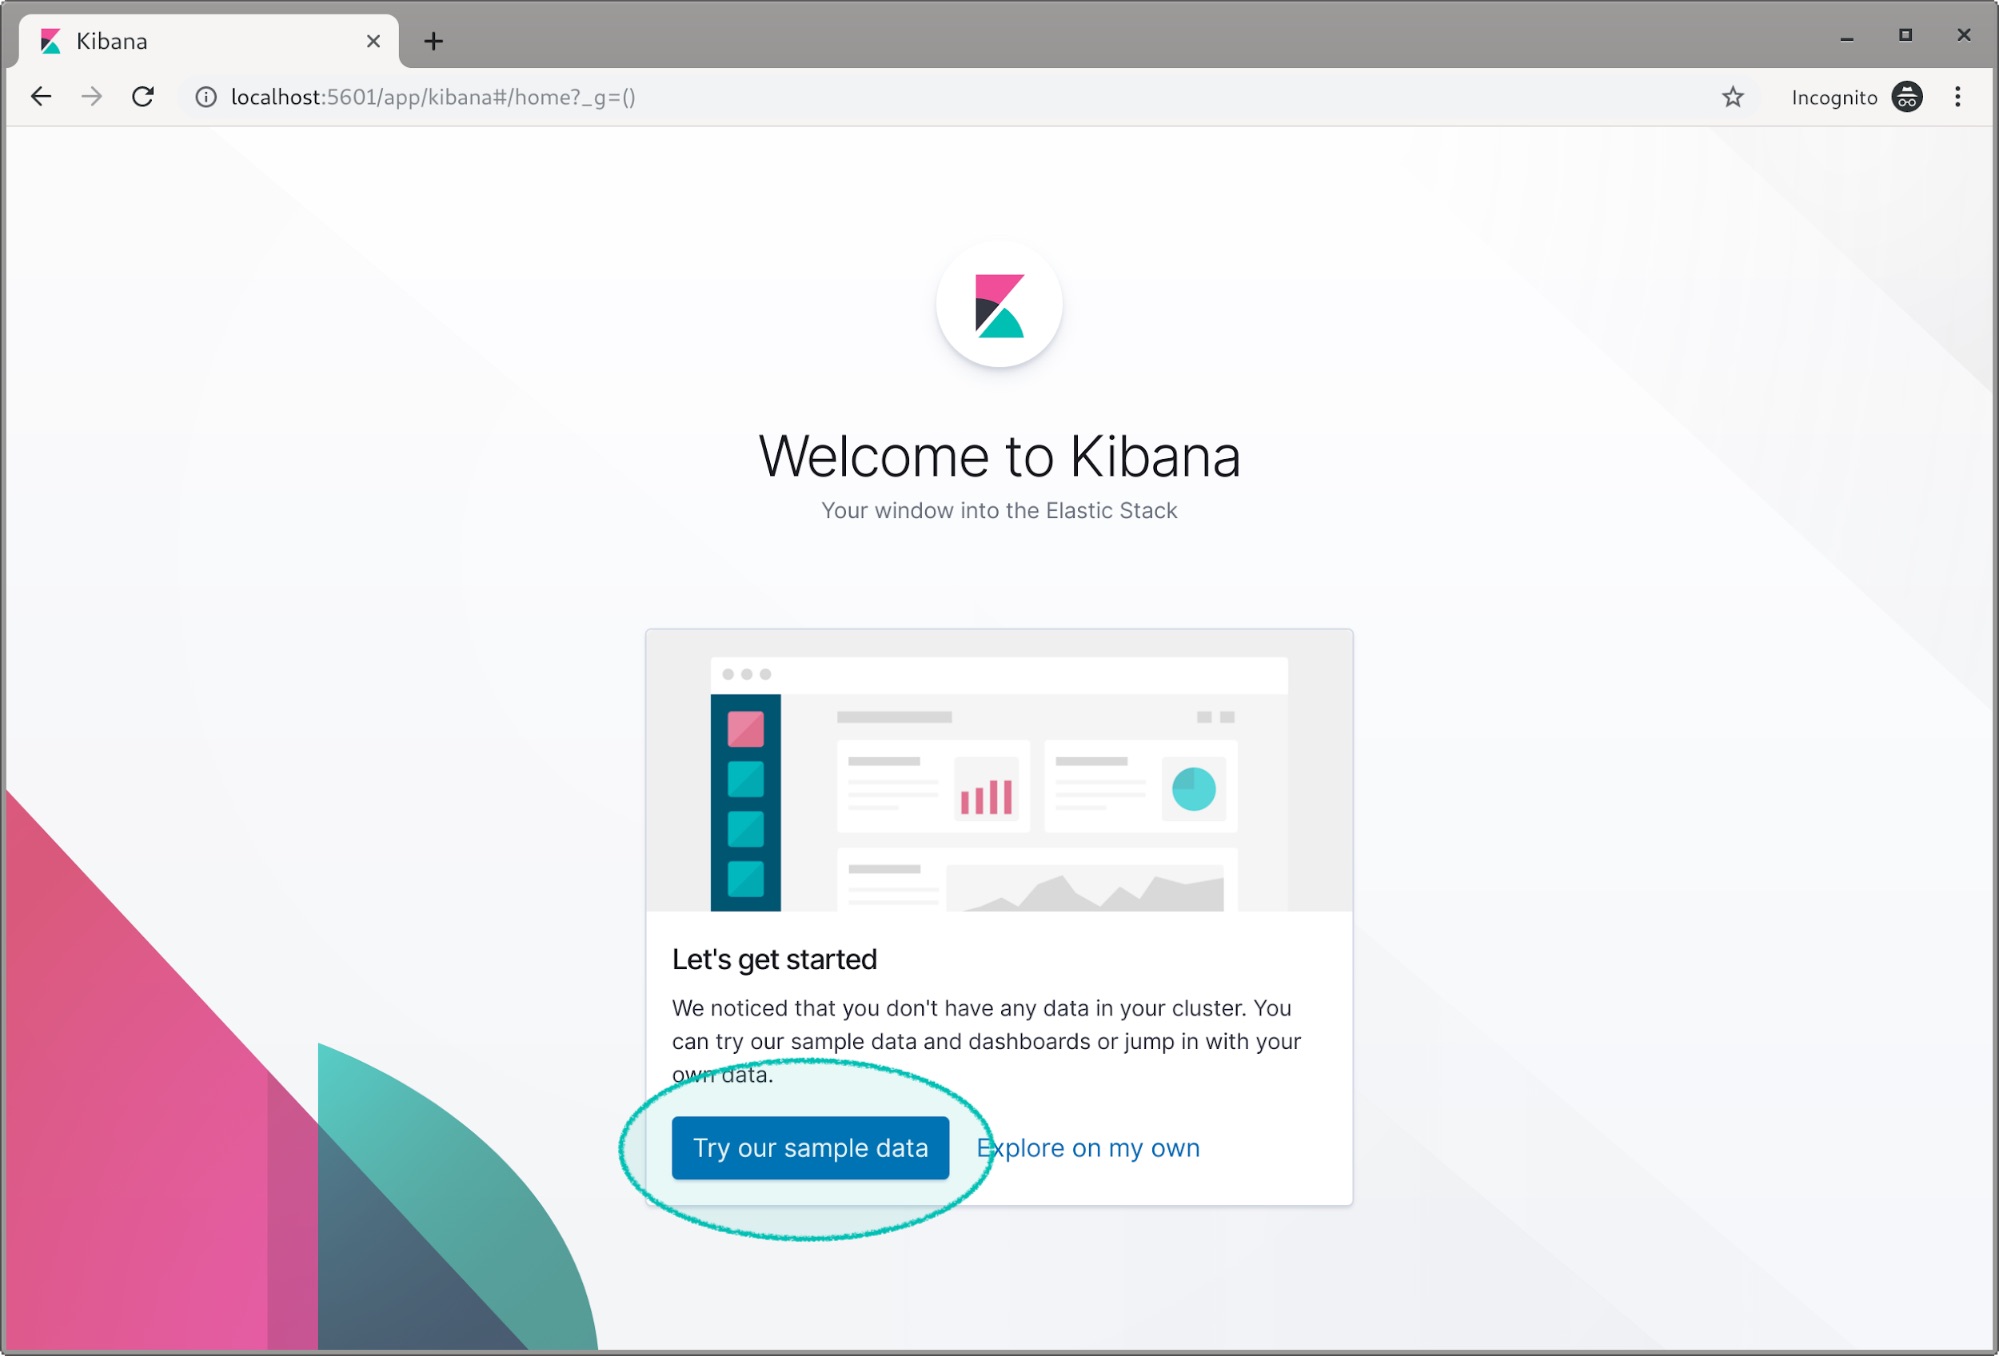
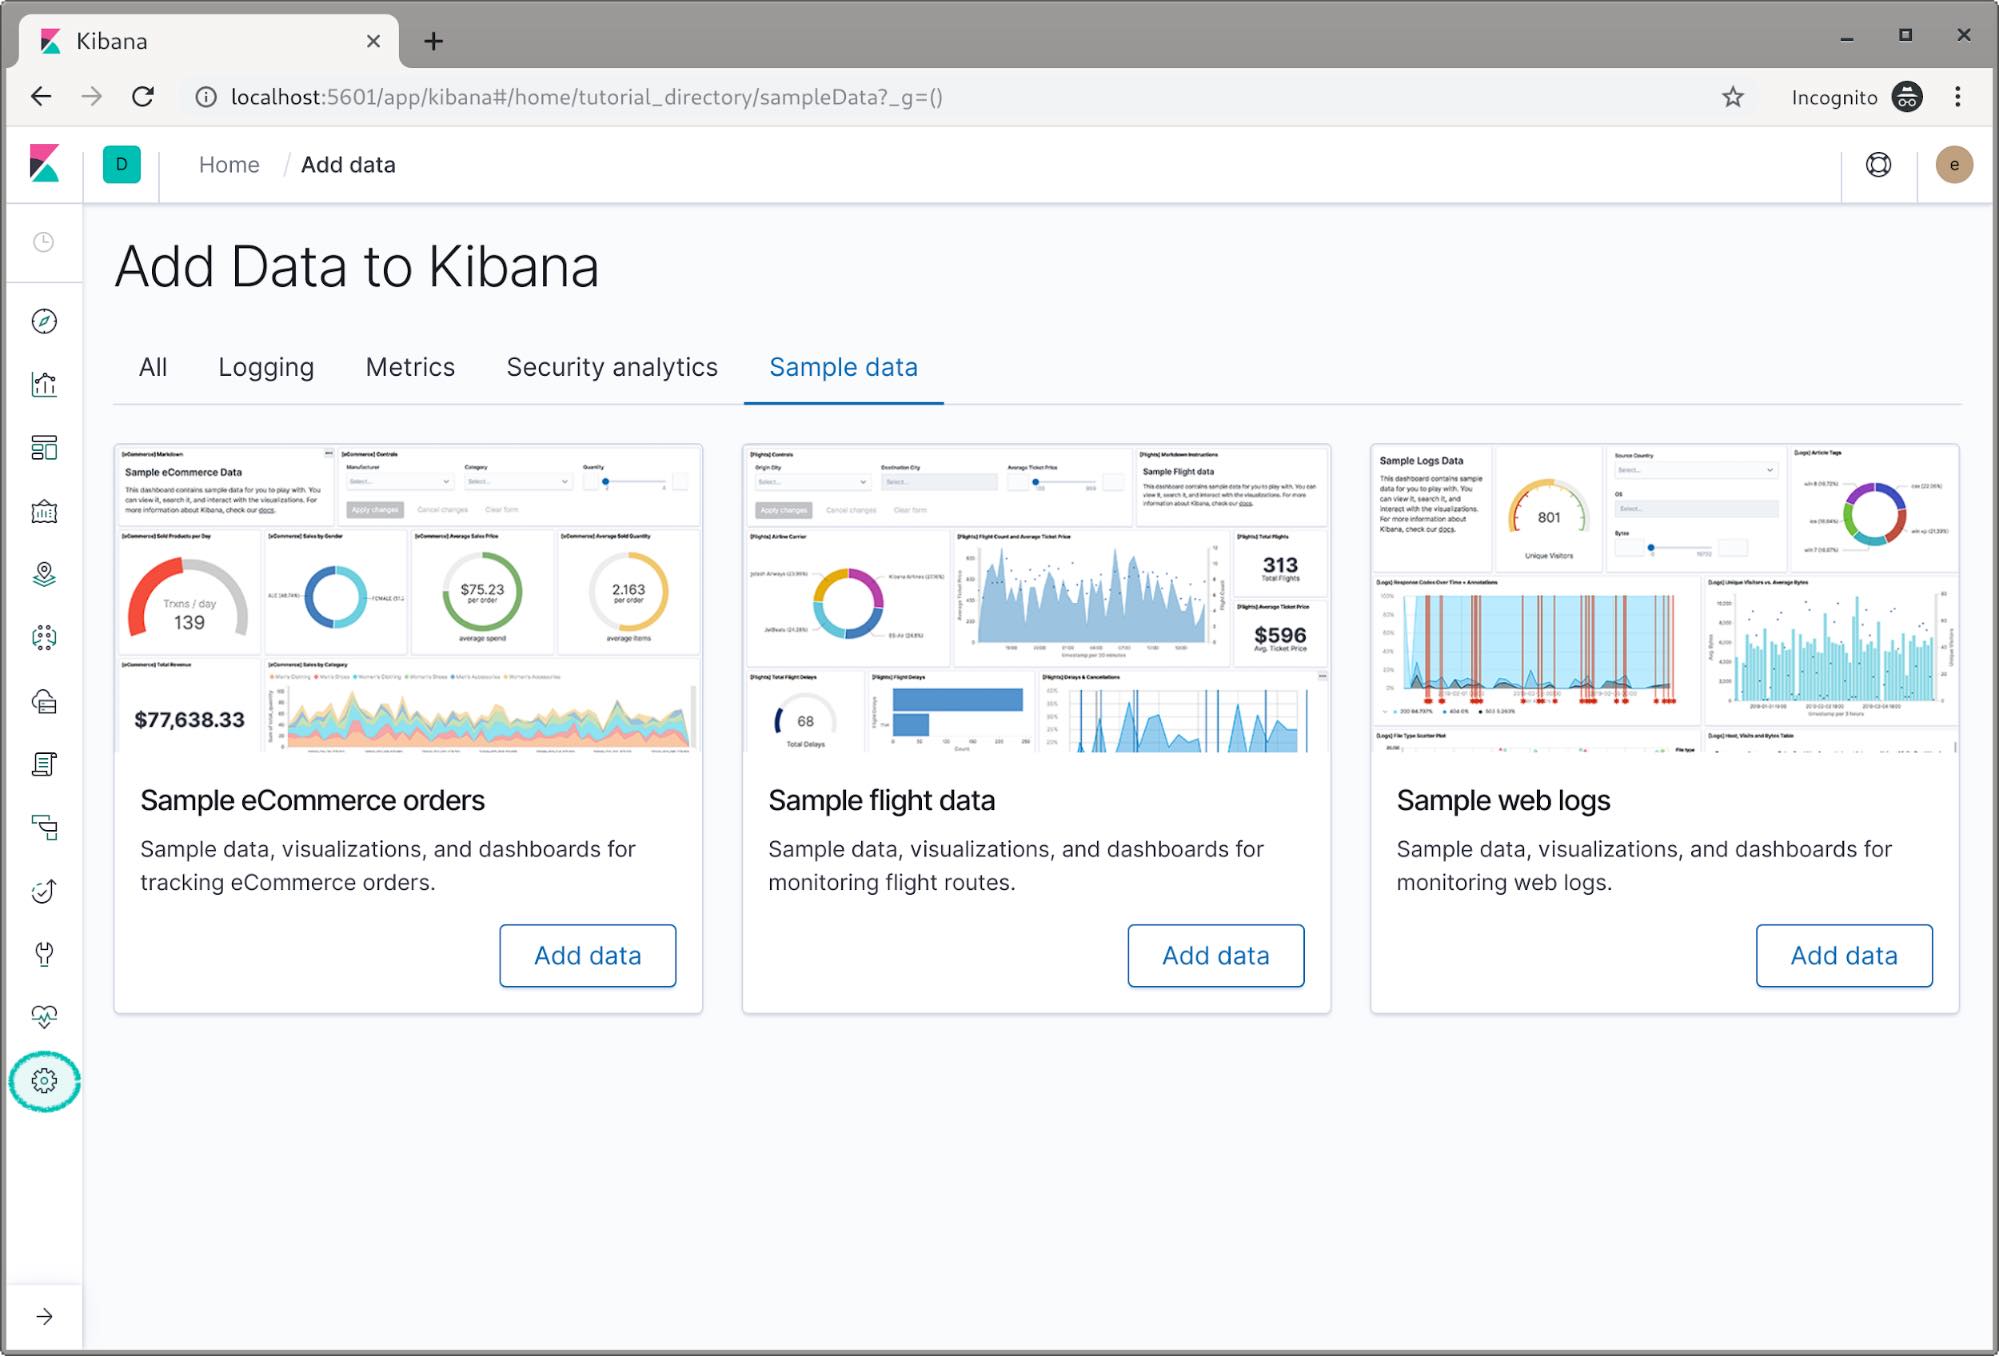
Let’s load the flight and web sample data for the sake of this example. Once loaded, click on the configuration gear icon.
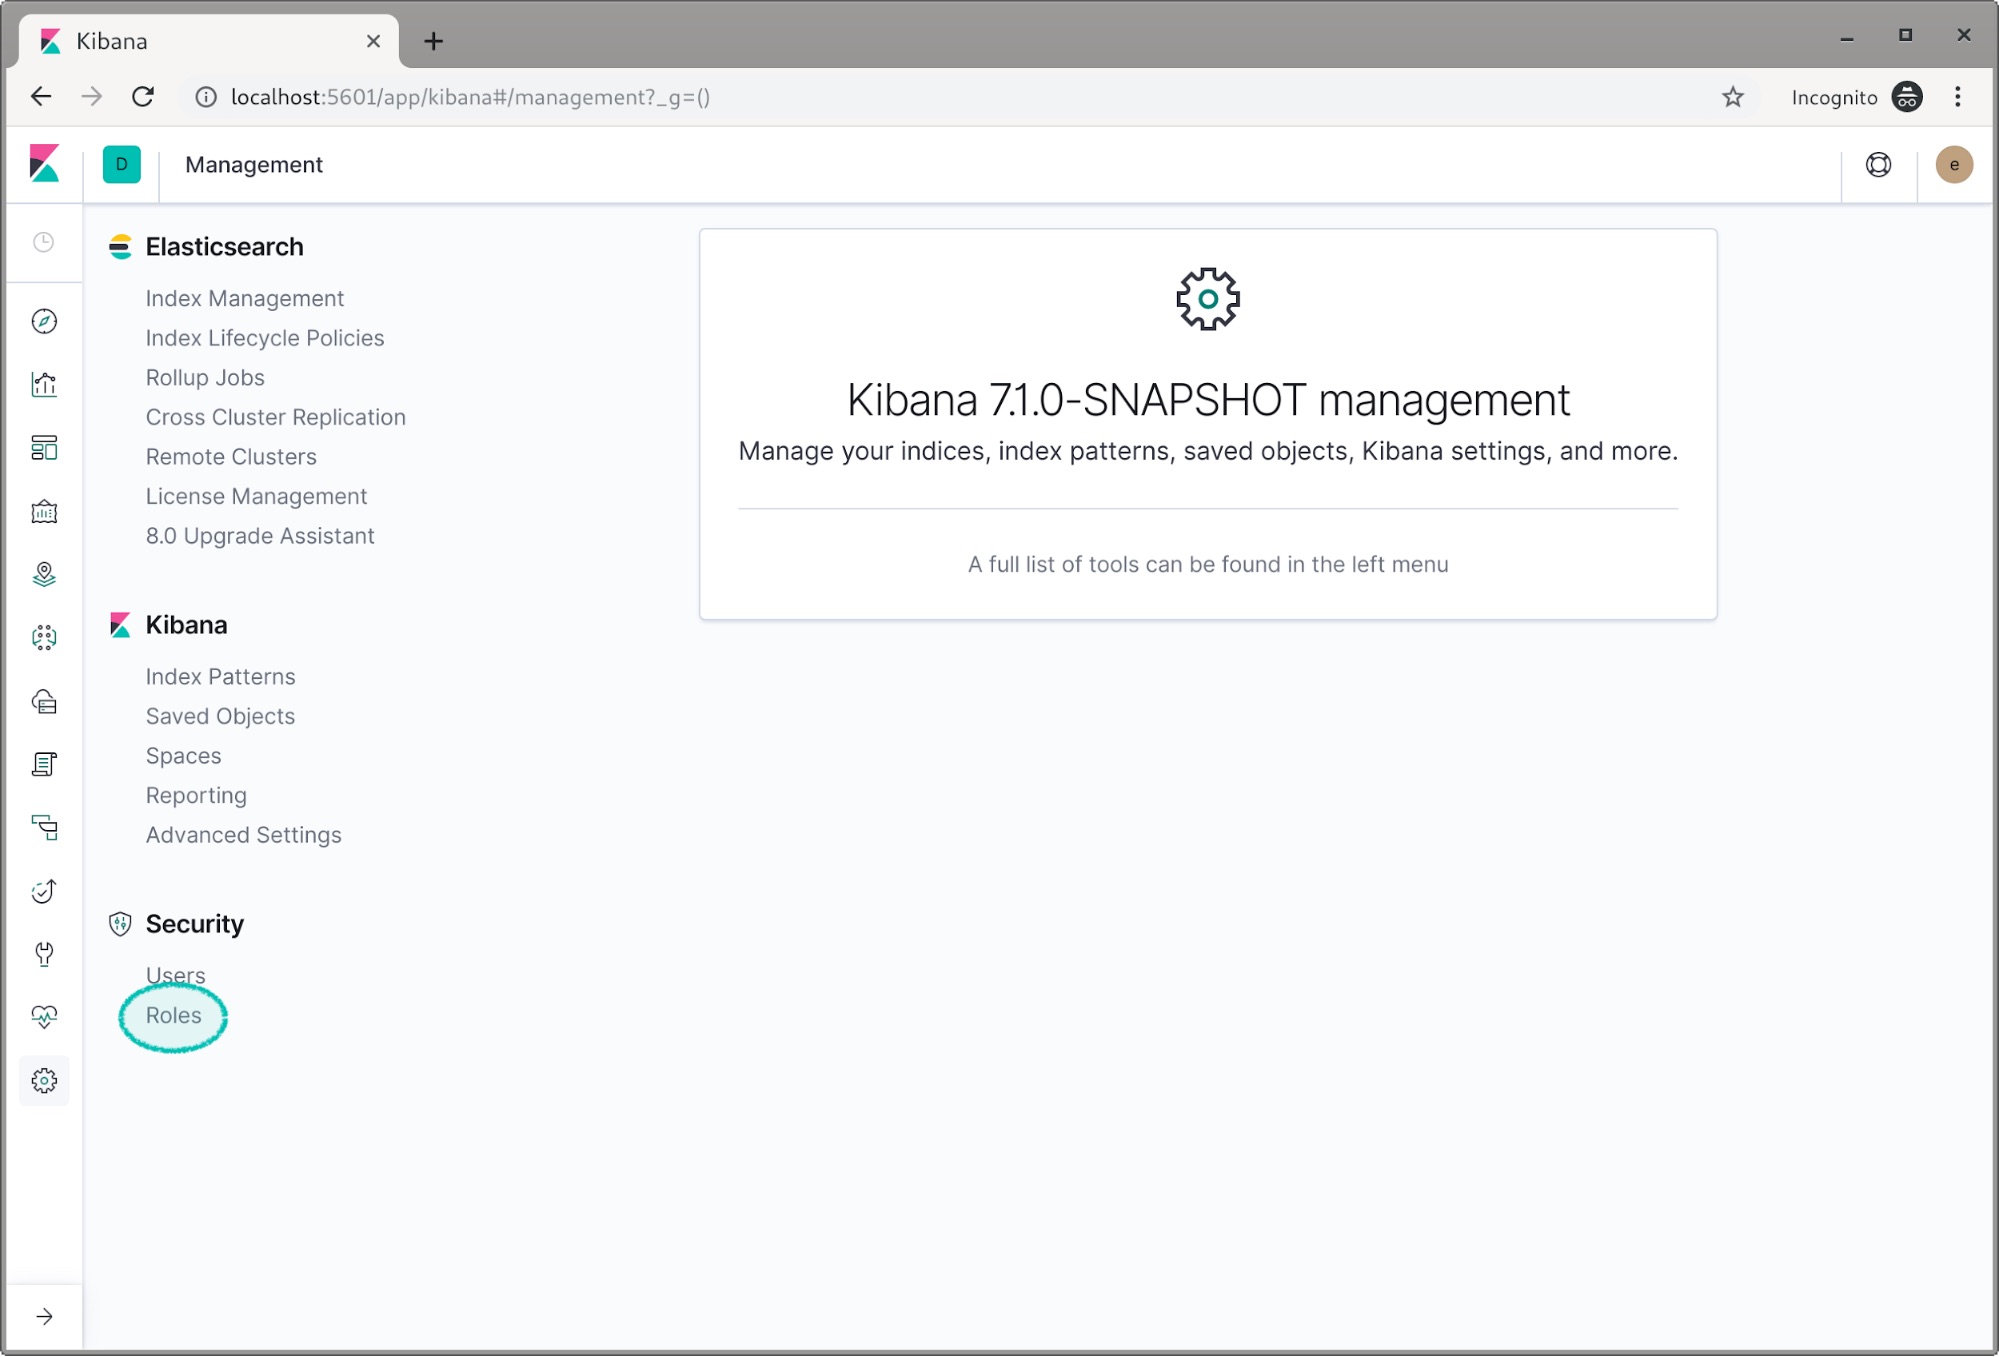
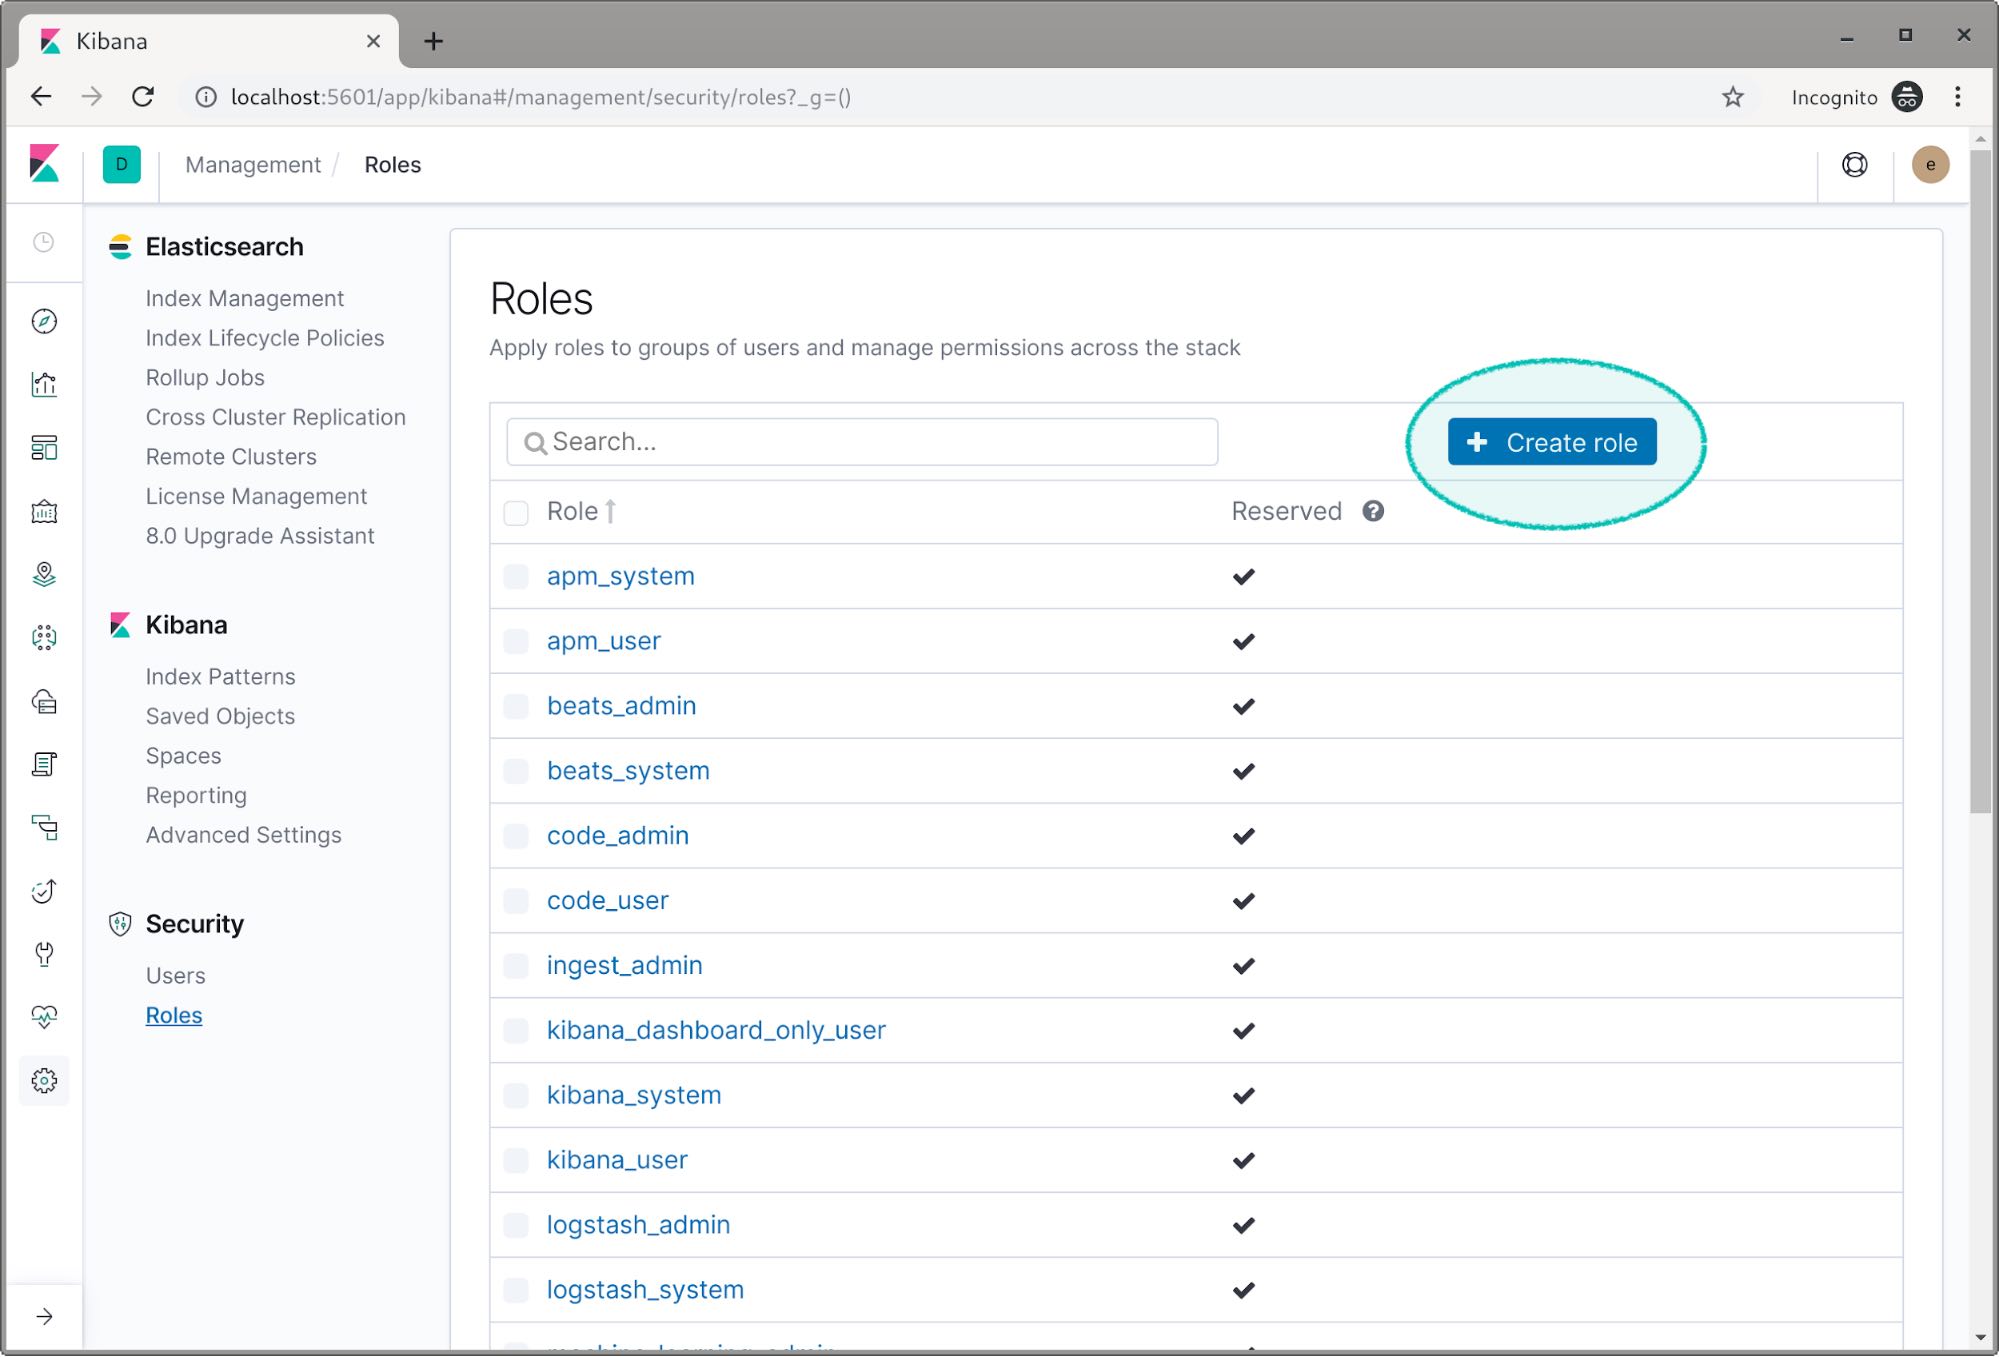
Now let’s create our roles. Find and click on the roles option.
Click on Create role.
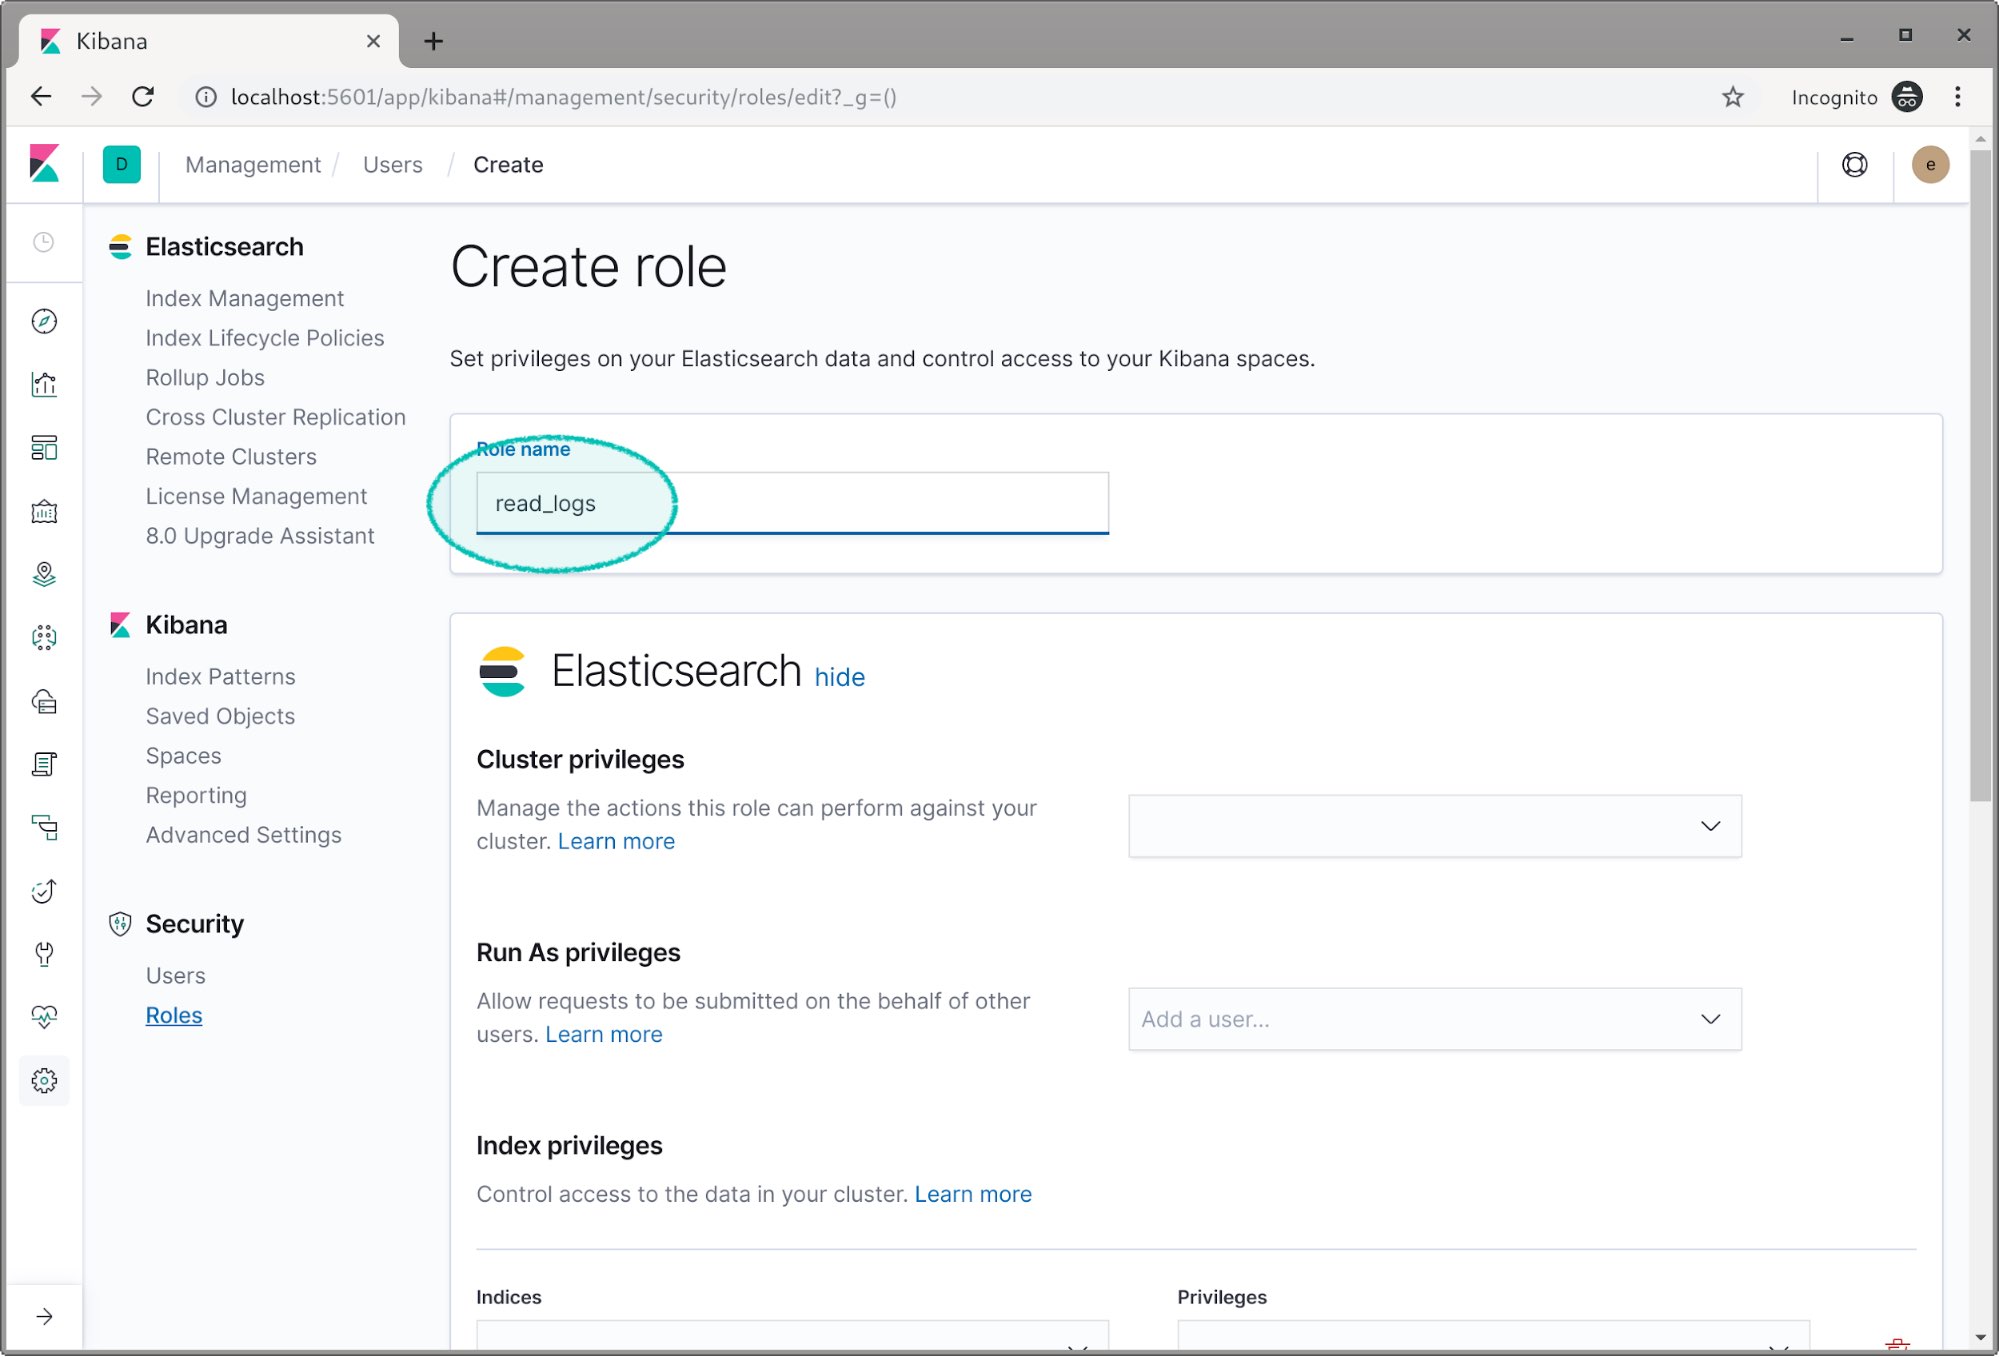
We’re going to name the first role read_logs.
Scroll down to the index privileges field and select the log index. Then we give it the read privilege.
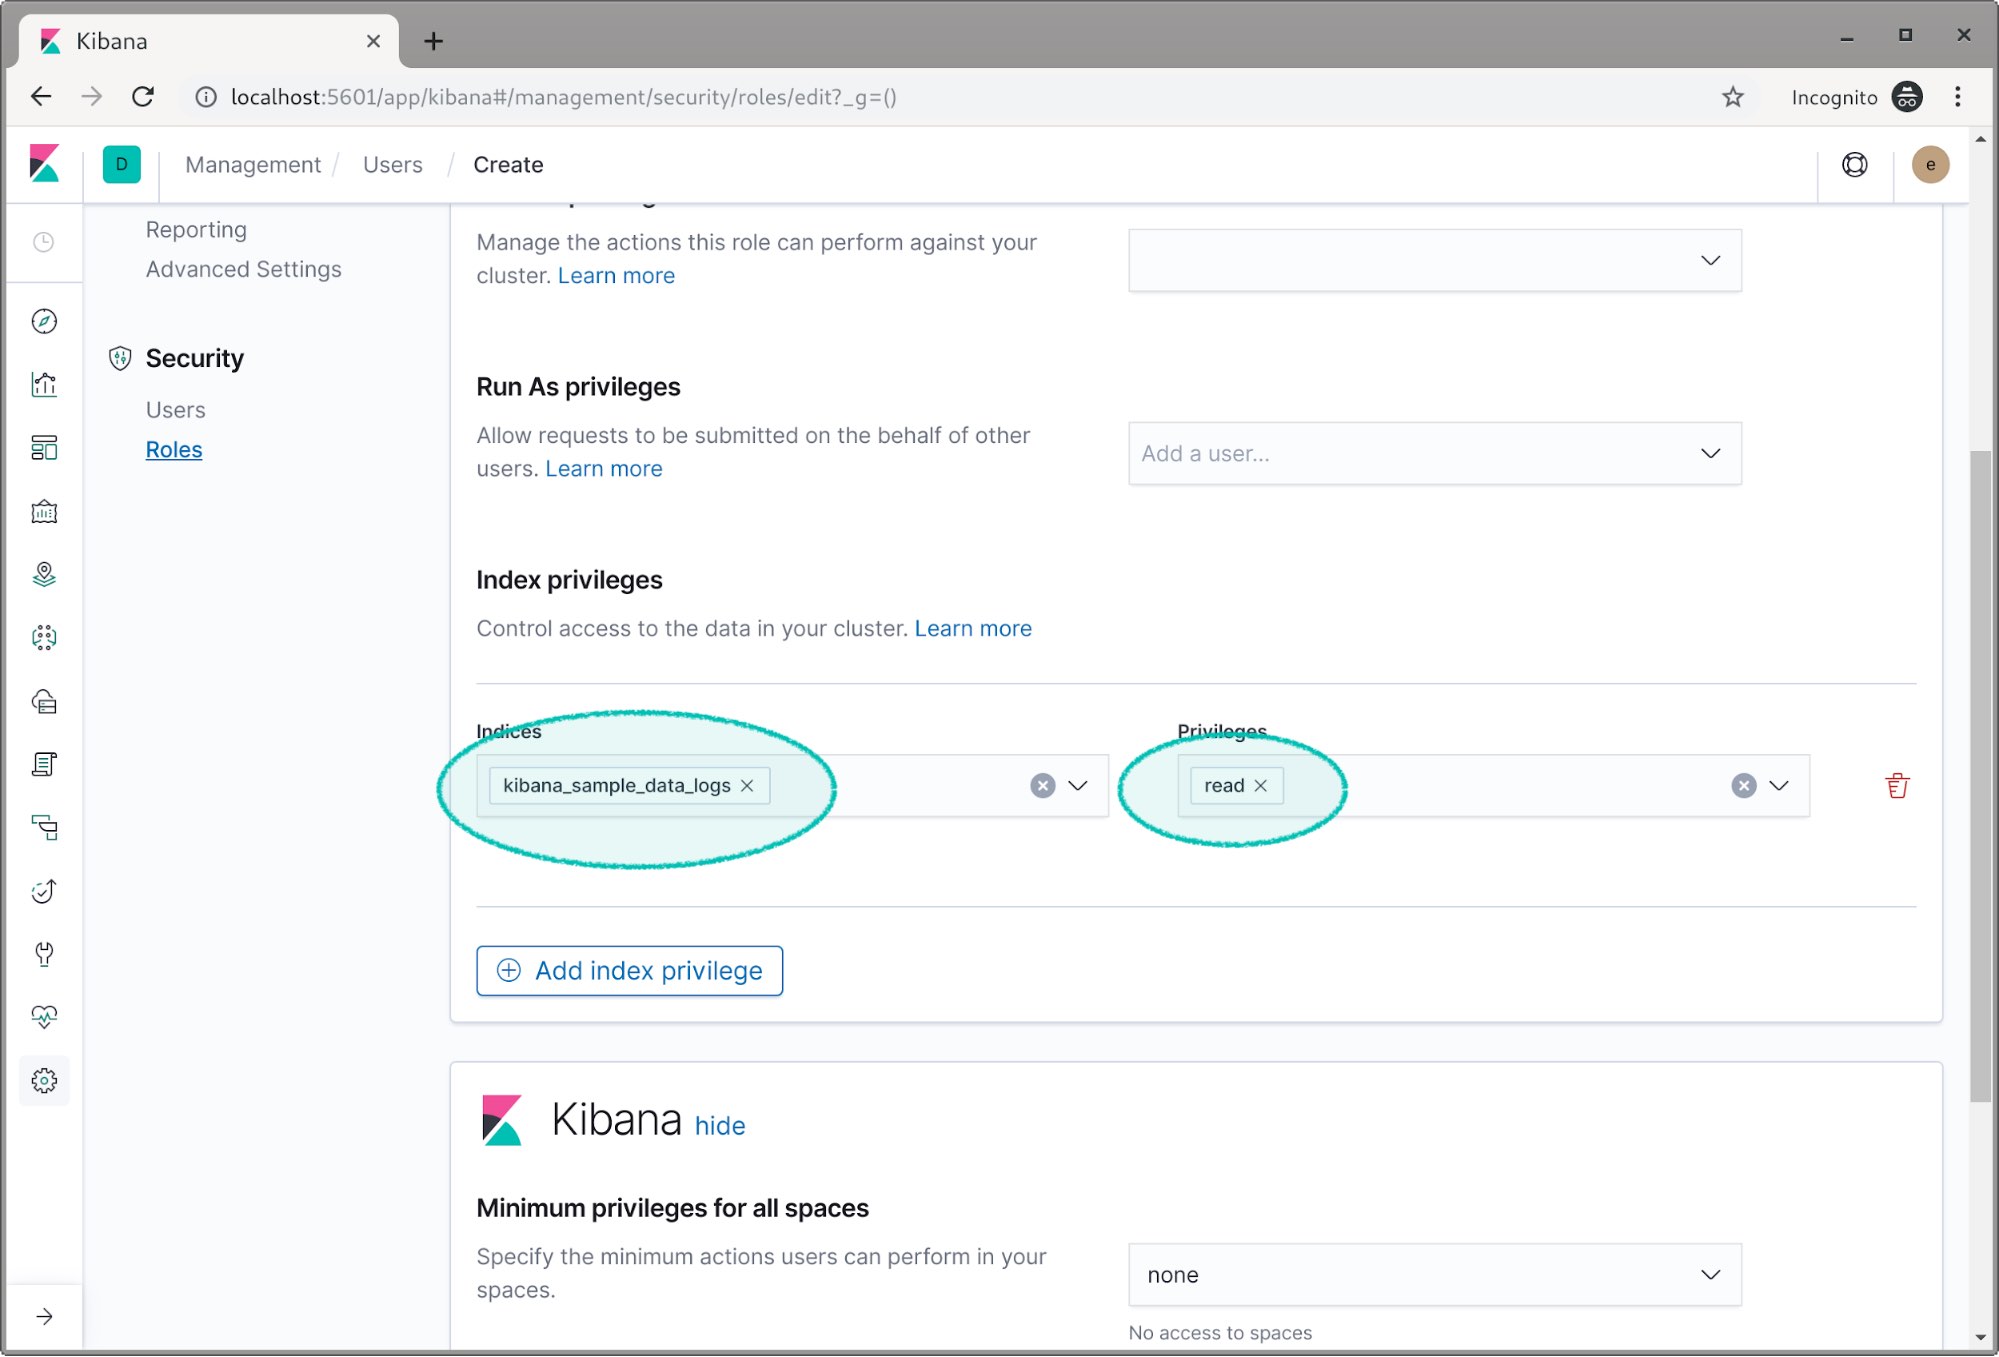
This section about spaces is something you’ll probably want to investigate once you have security working, but for this post we’re going to skip it. To learn more about spaces — which are great for organizing and securing data within Kibana — check out our Kibana spaces documentation or this introductory Kibana spaces blog.
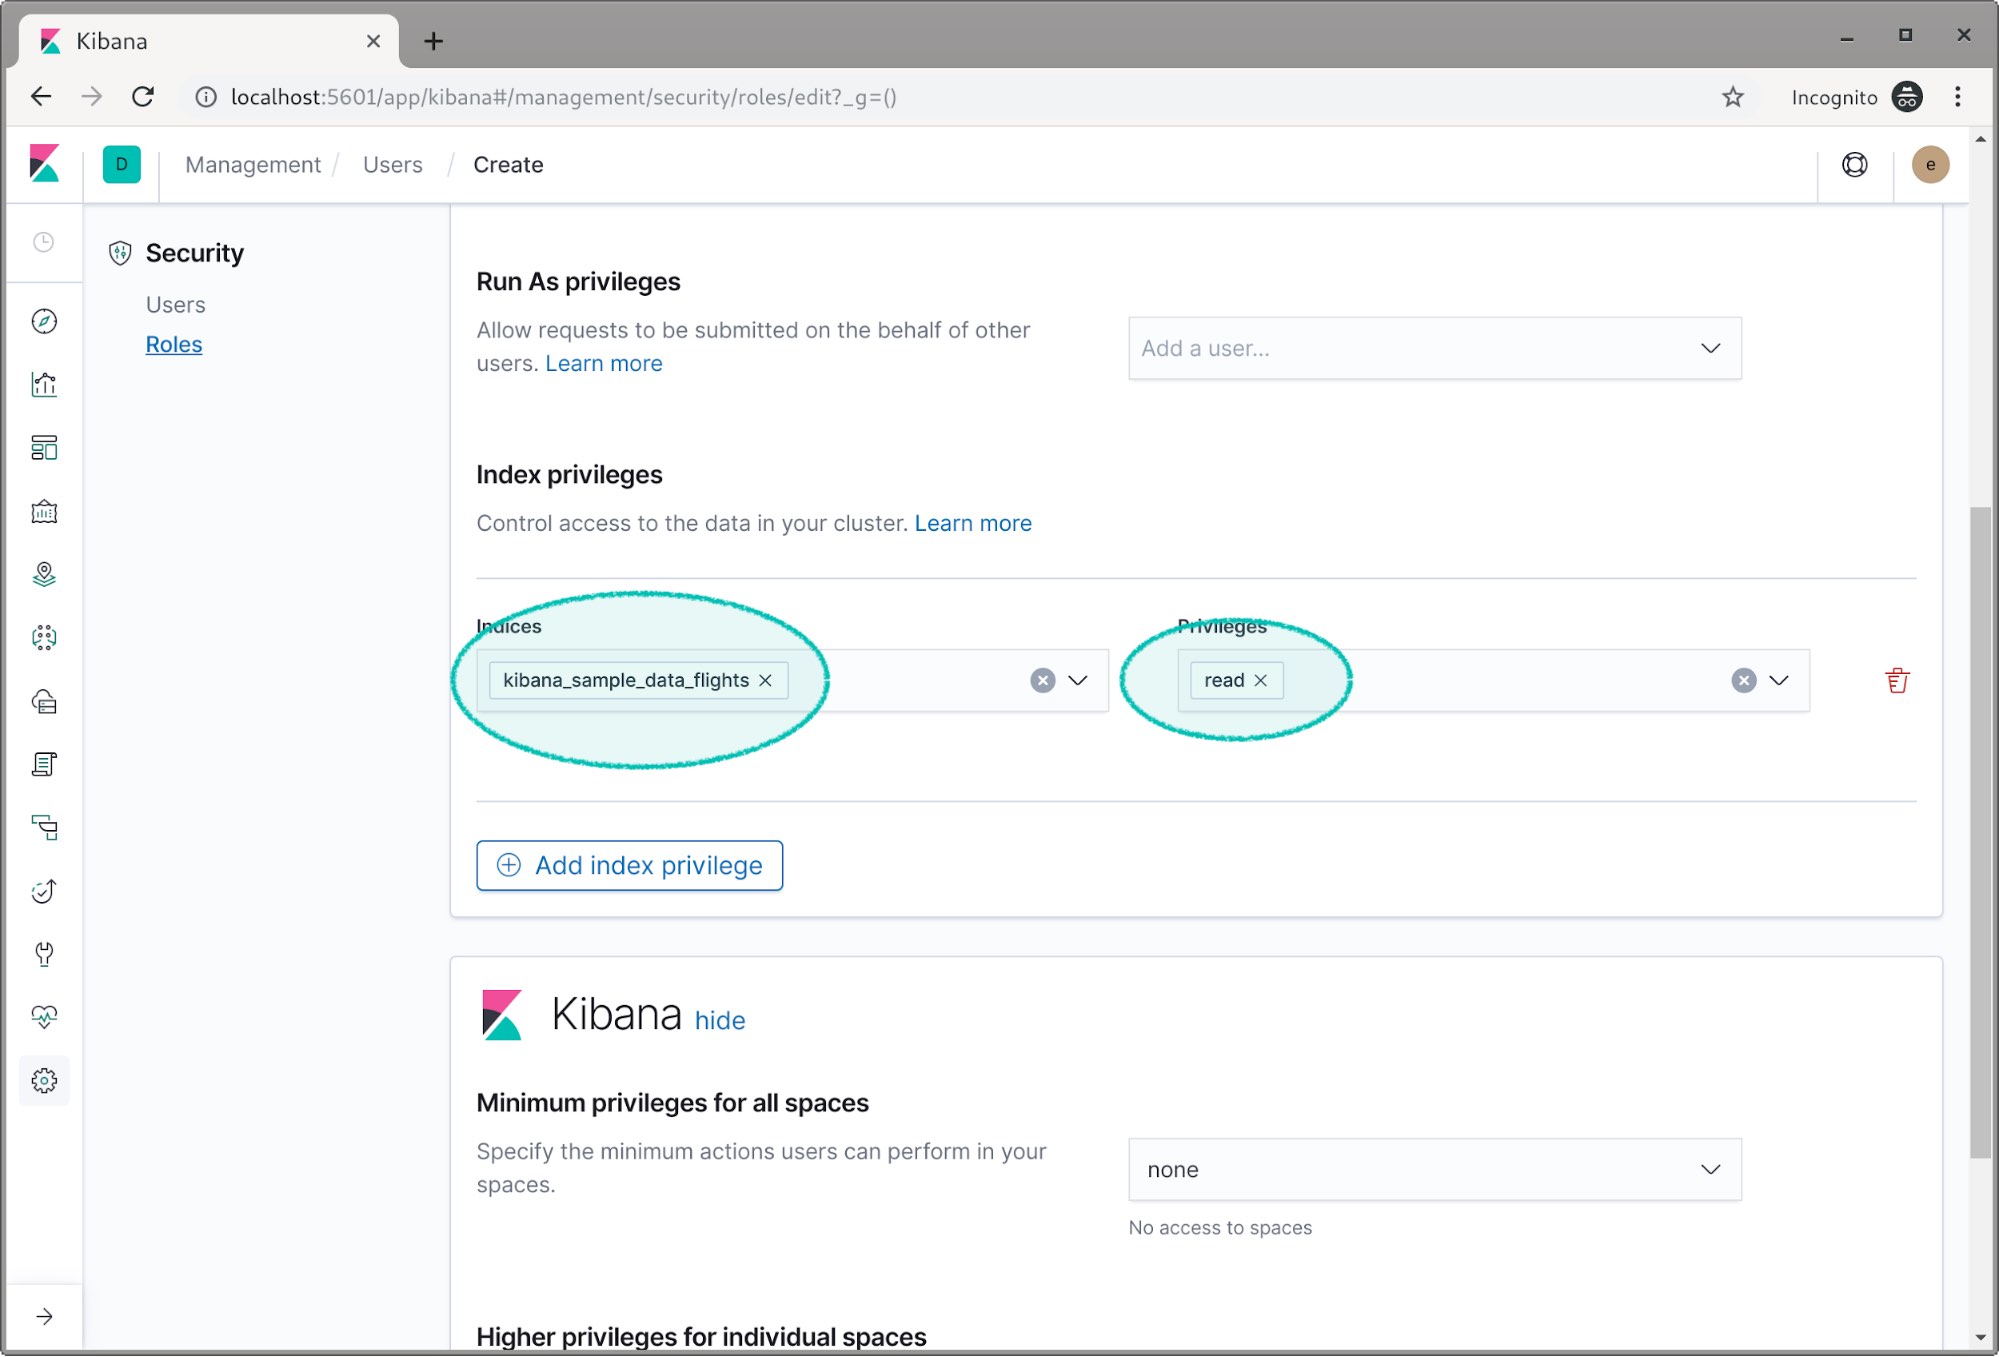
Now let’s create another role called read_flight.
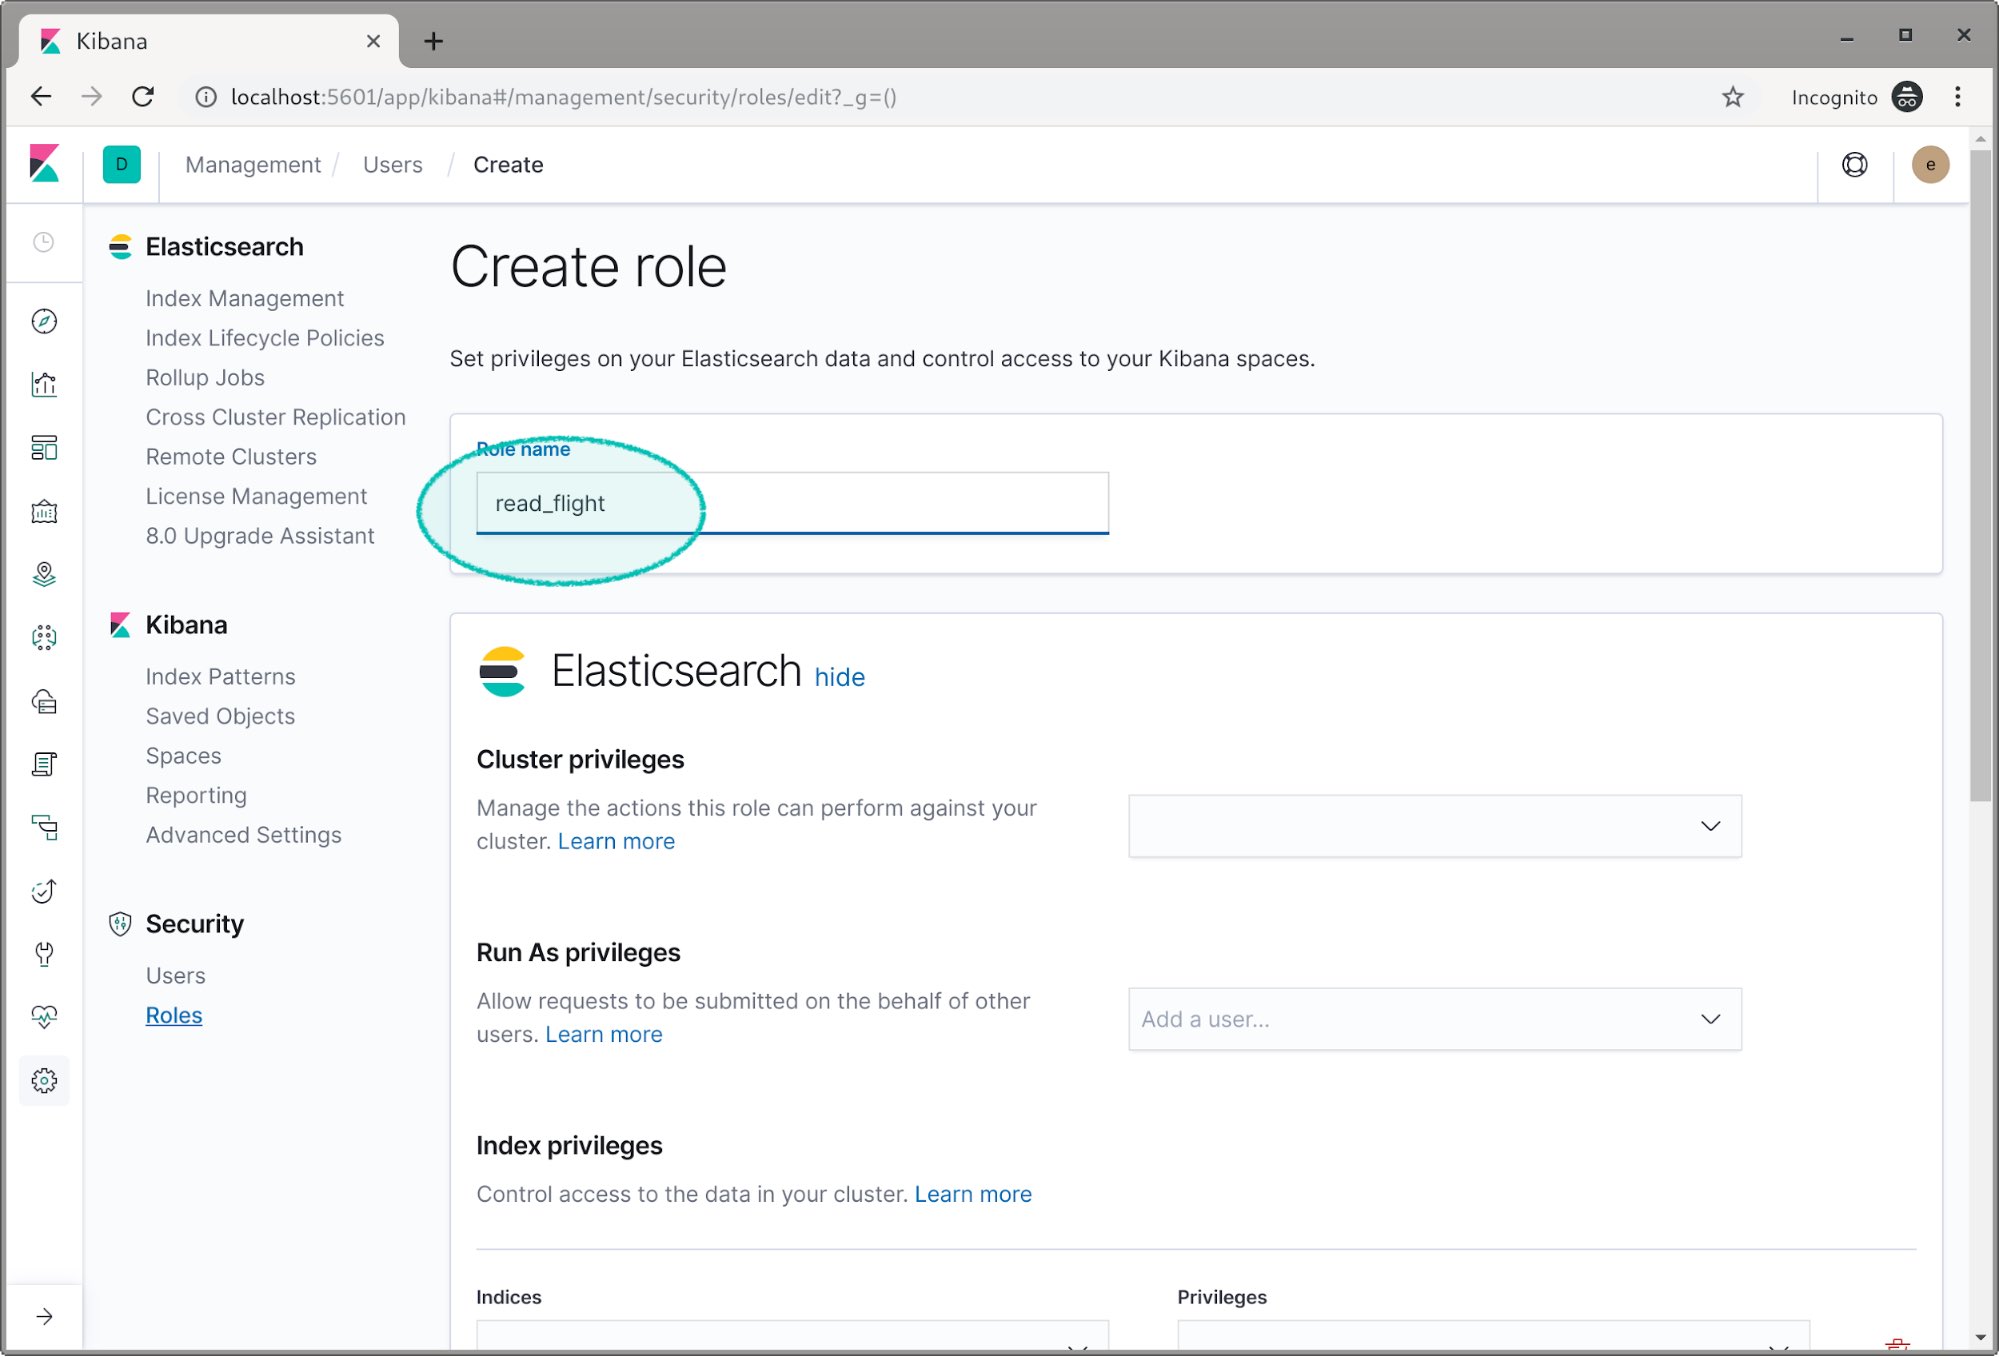
We assign the flight index the read privilege.
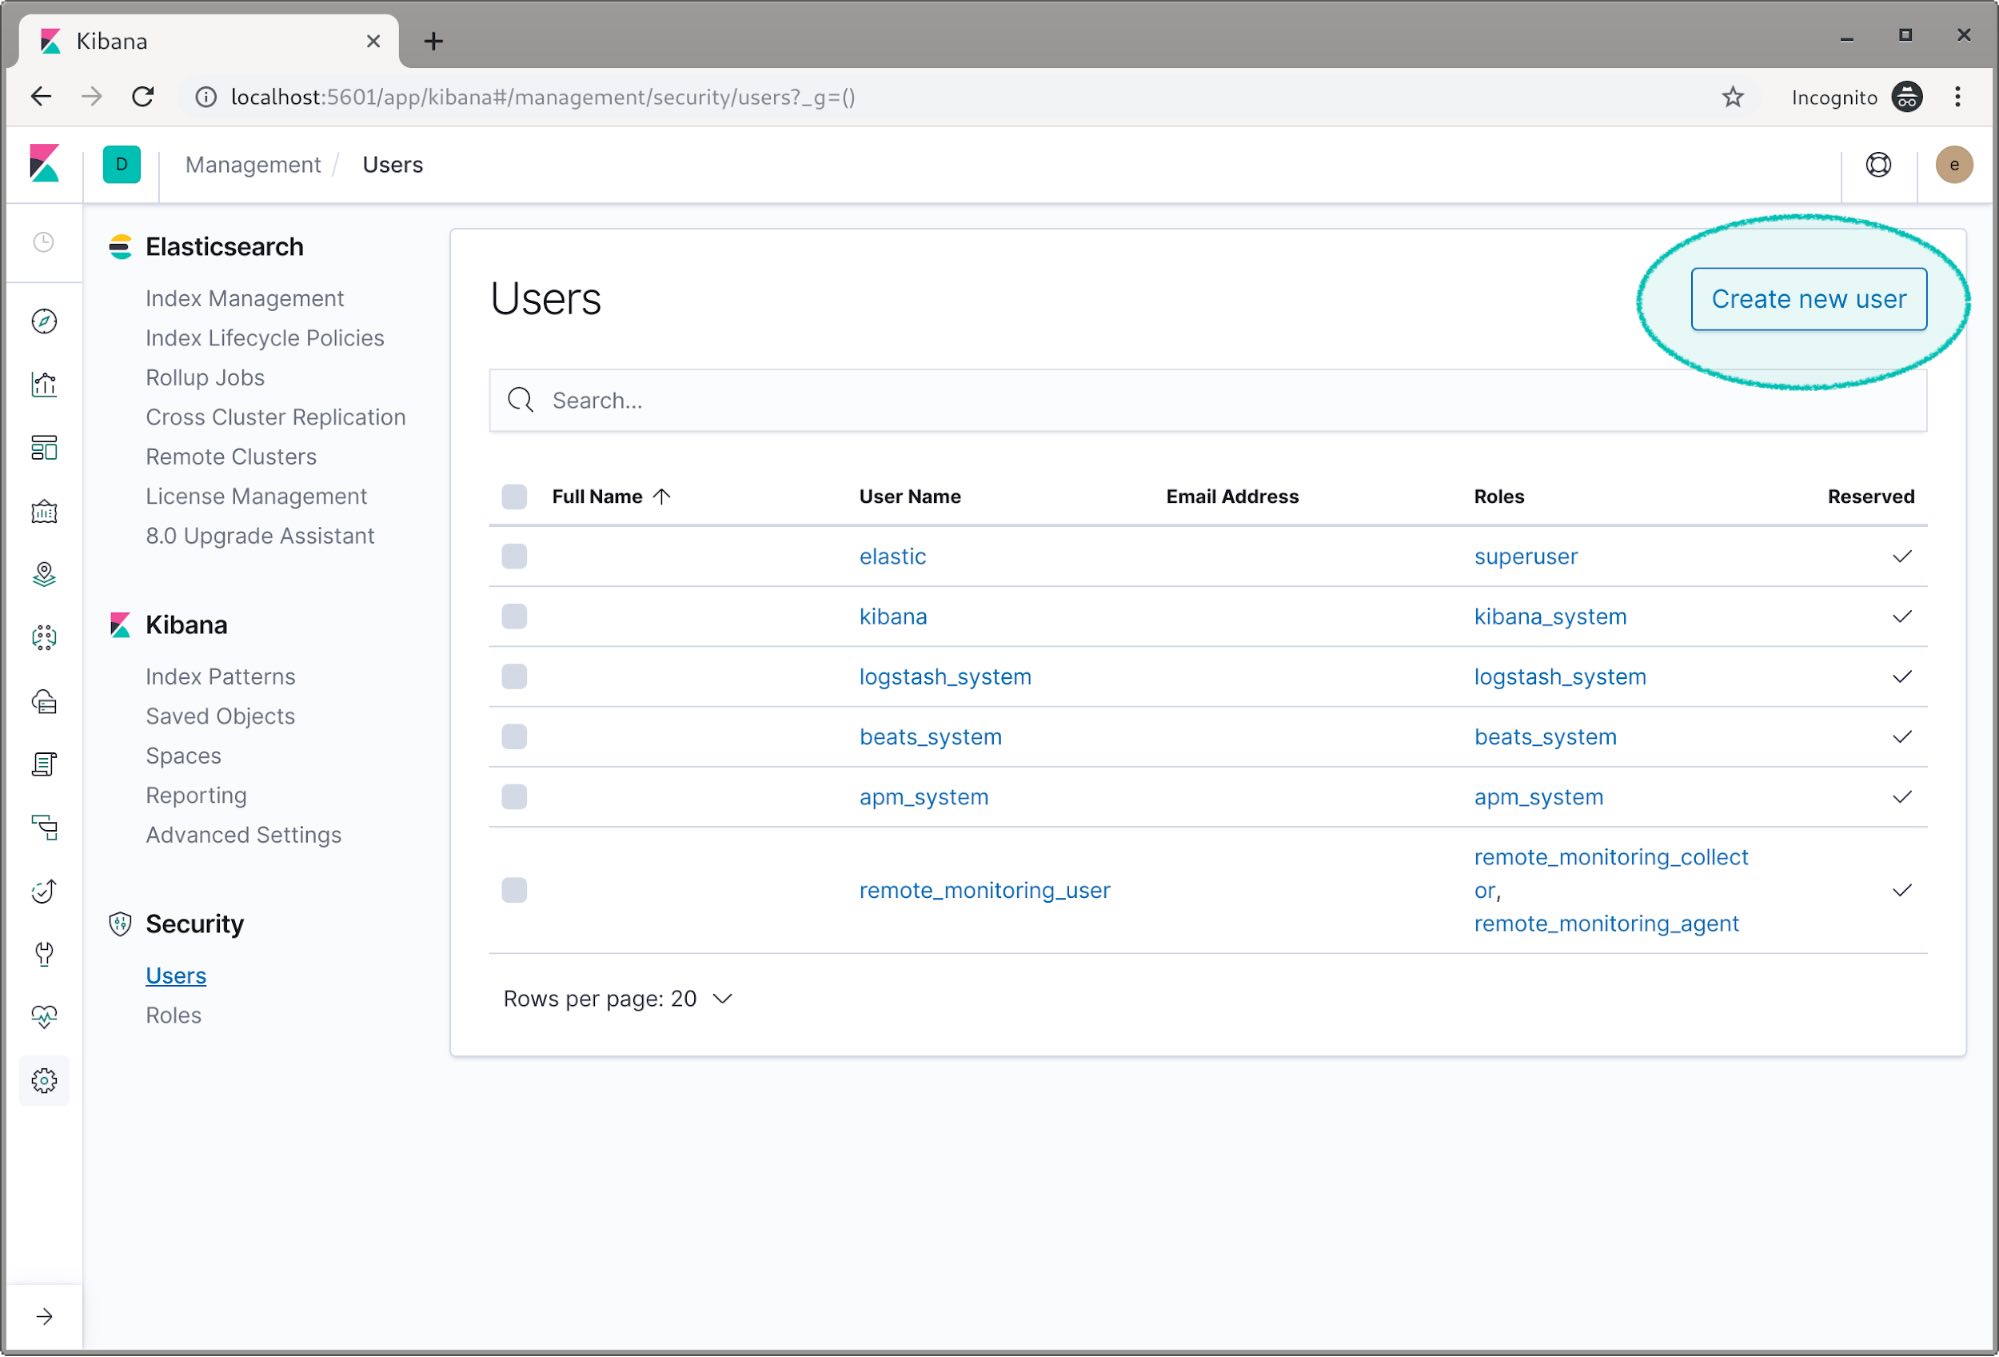
Now we’re going to create two users and assign them these roles. Select the Users link on the left and click the Create new user button.
We’ll name this user flight_user and set the password. We don’t need to set the full name and email address. We need to assign our read_flight role and we also need to assign the kibana_user role as this user will be viewing data in Kibana.
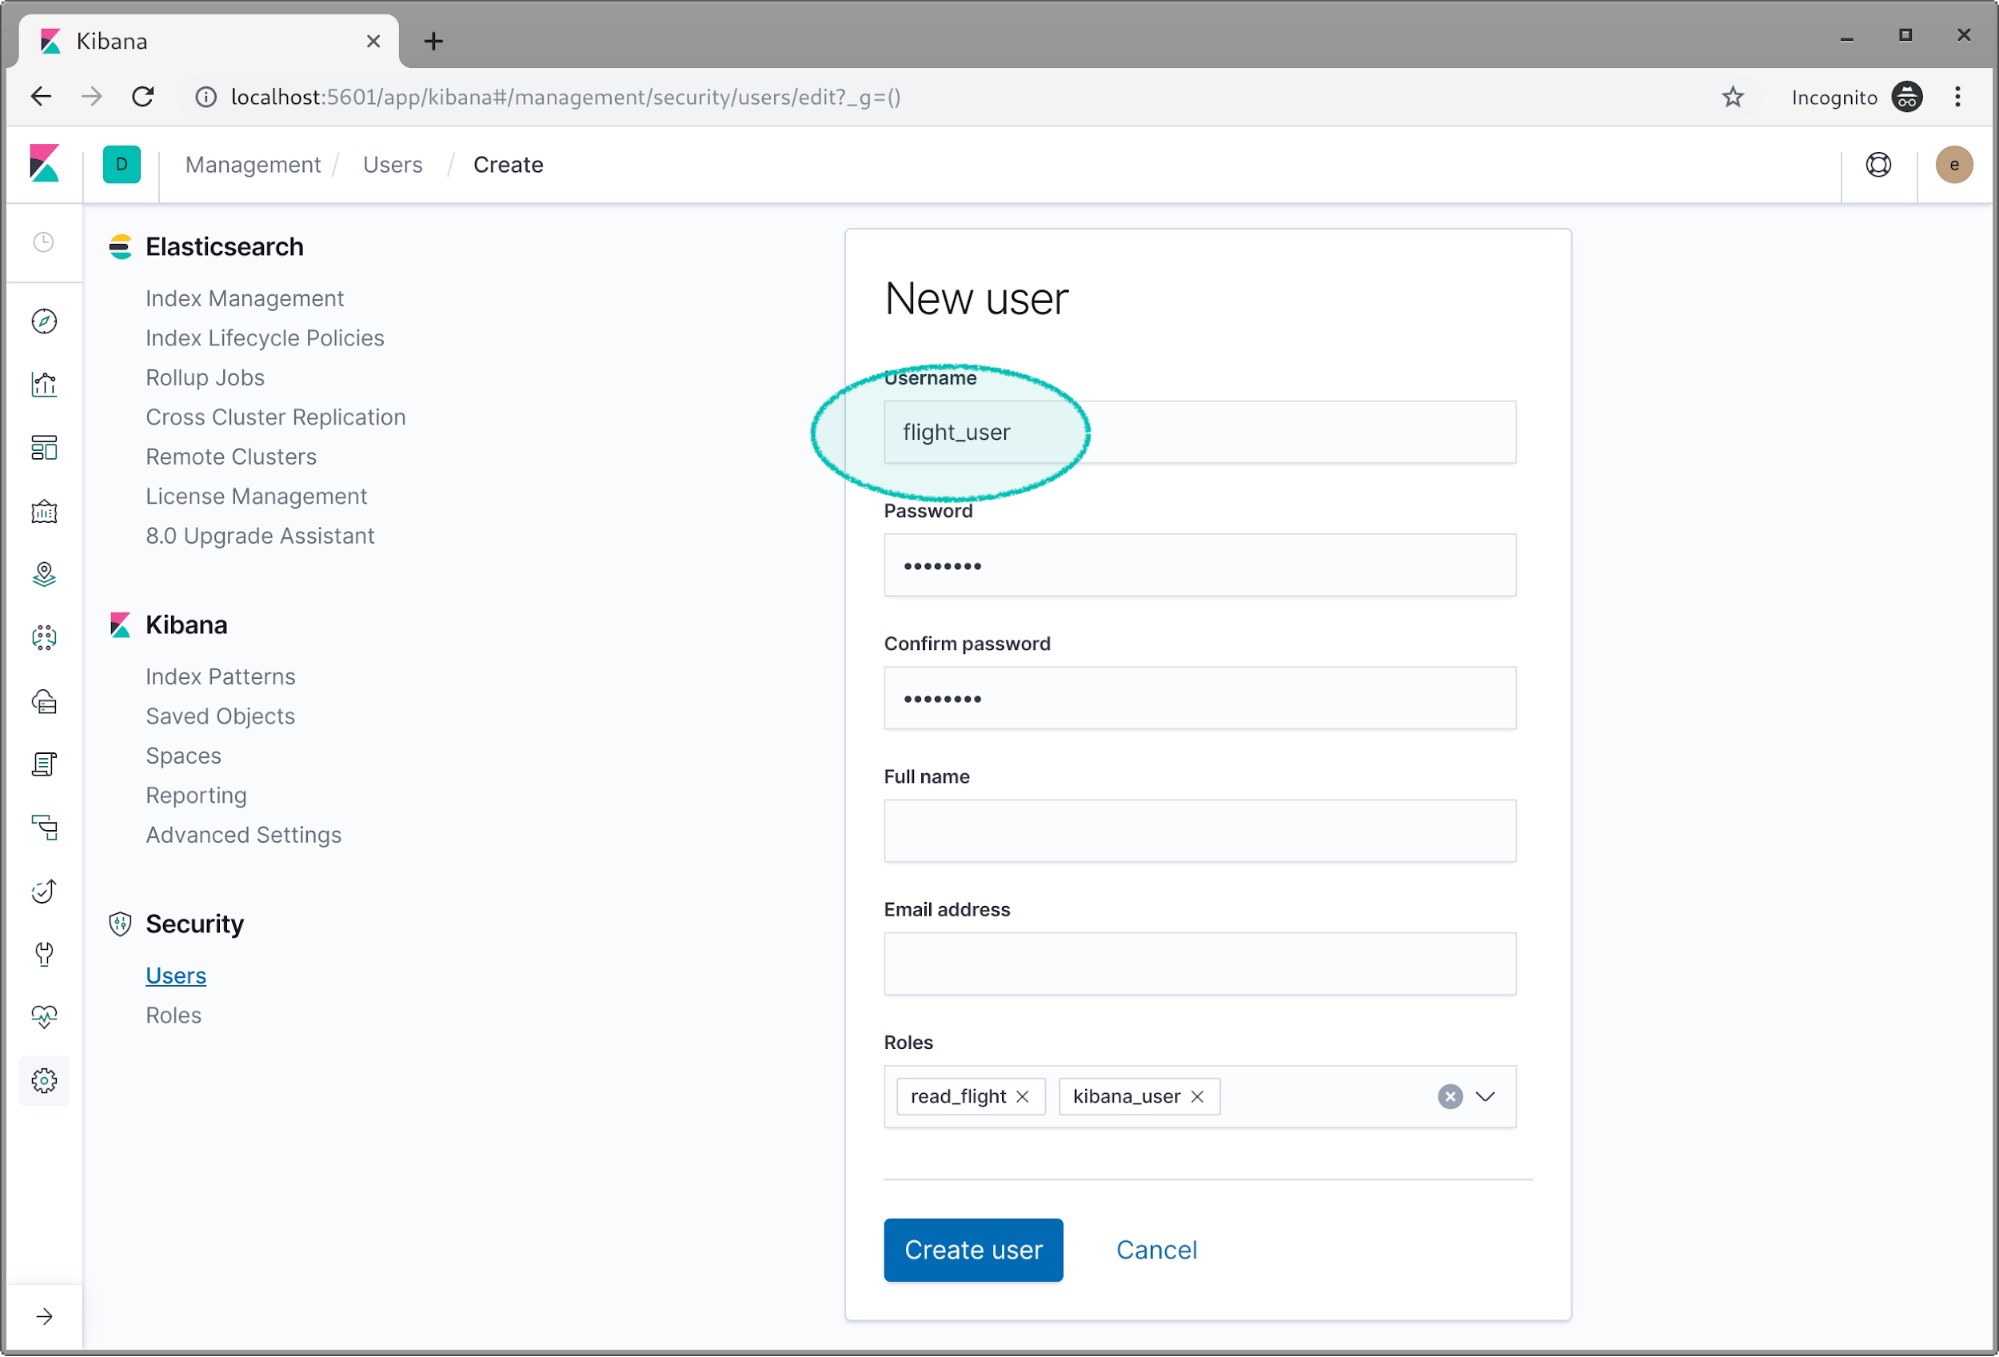
Hit create, and let’s do it again for the log_user. This time we add the read_logs and kibana_user roles.

OK we’re all set with two new users. We can now log out as the elastic user.
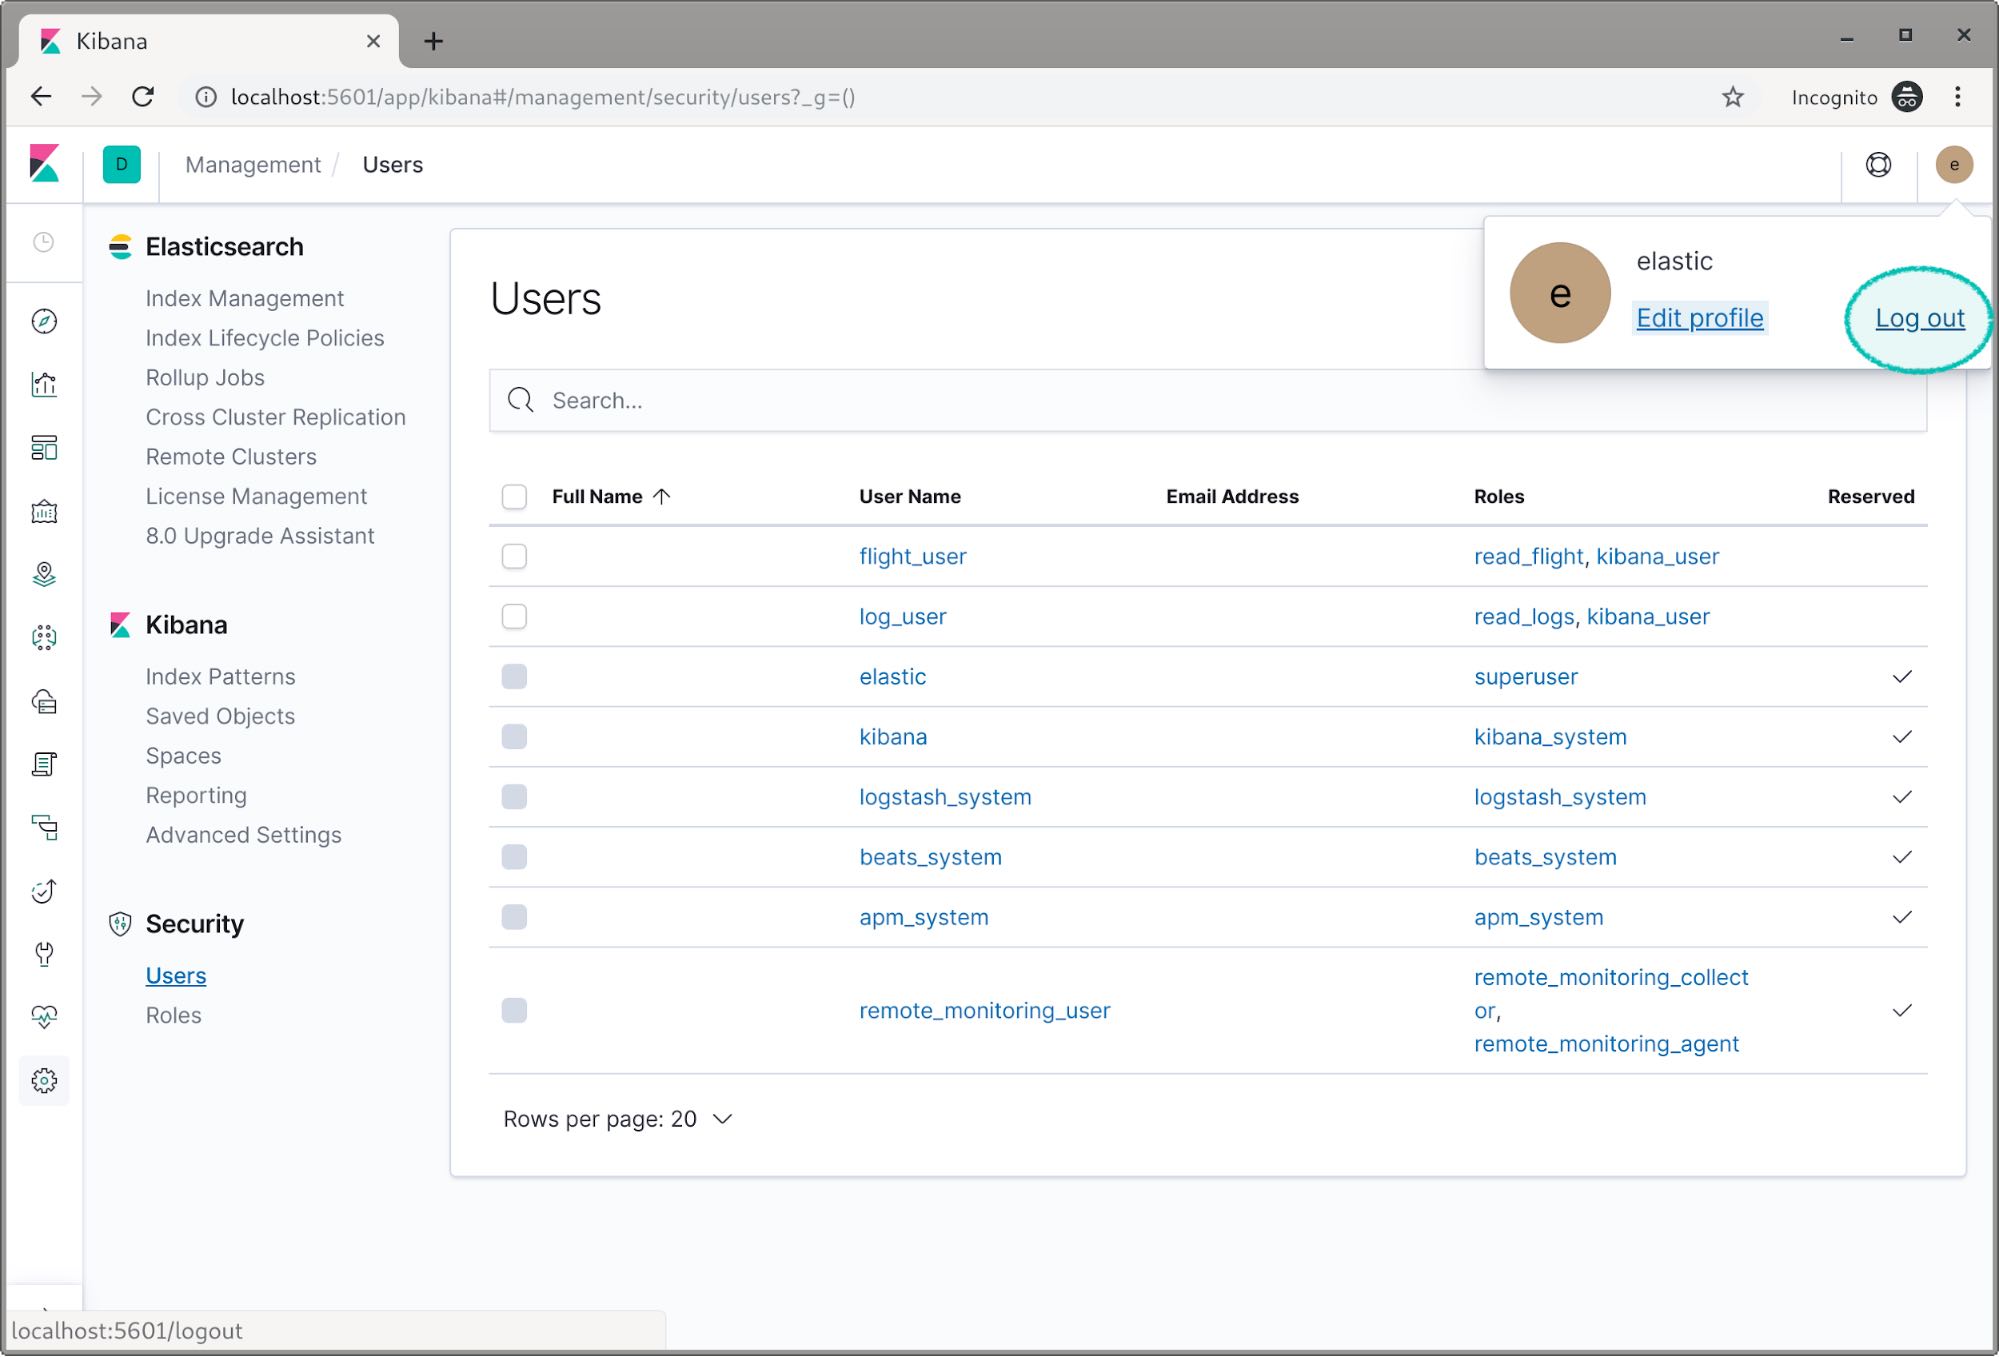
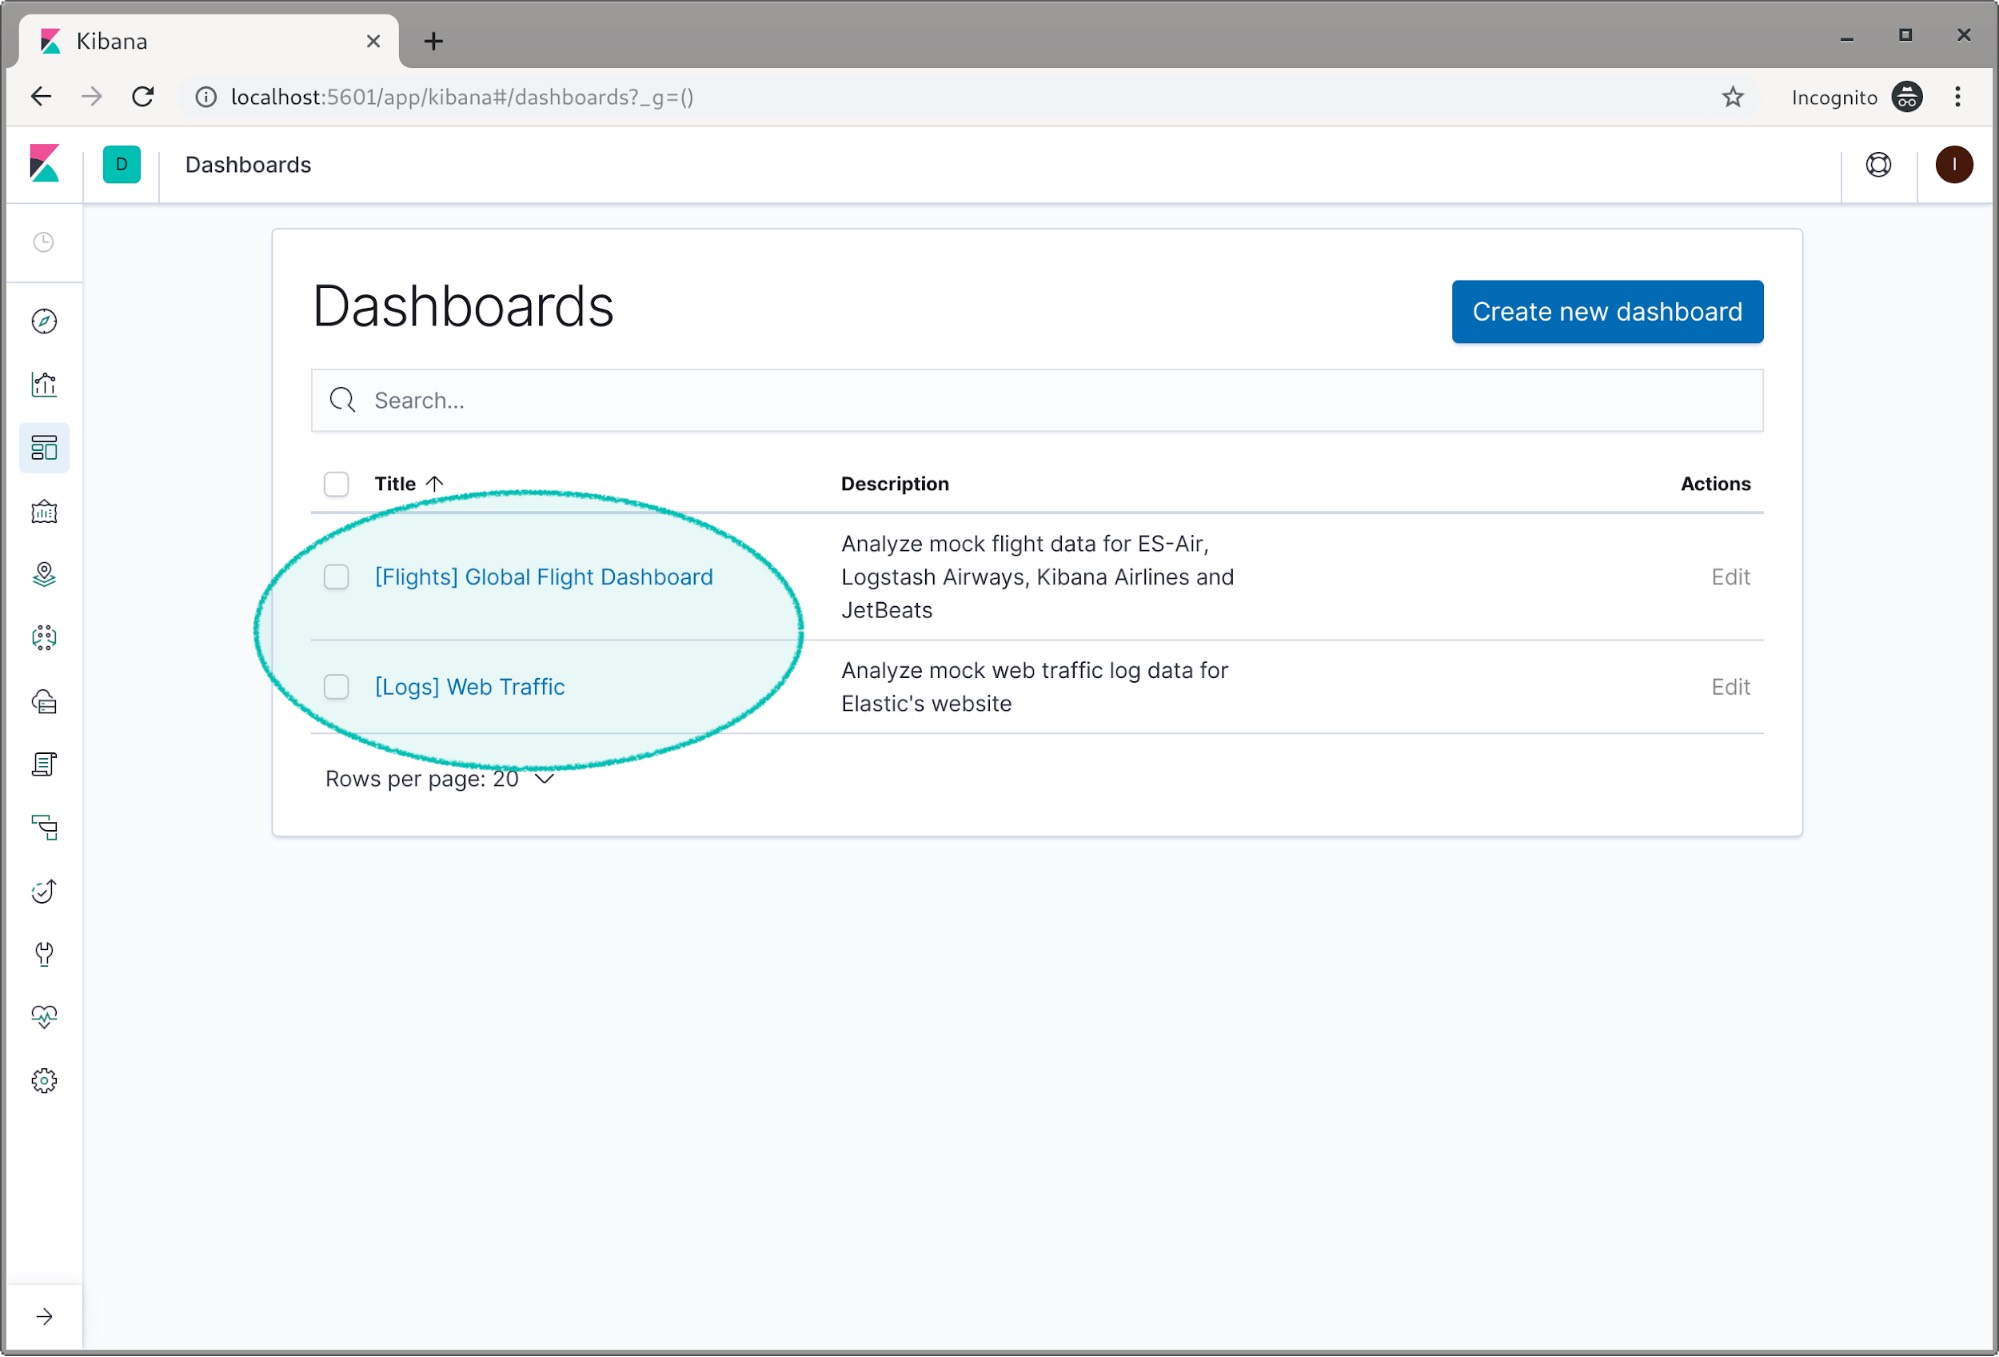
Then we can login as log_user. If we click on the dashboards icon we can see there are two dashboards, one for flights and one for logs.
If you click on the Logs dashboard you will see the demo log data. If we go back and try to view the flight dashboard we can see the dashboard, but we can’t see any of the data. This is a place Kibana spaces can be used for security purposes to only allow certain users to see certain dashboards.
Now we can logout as the log_user and log back in as the flight_user.
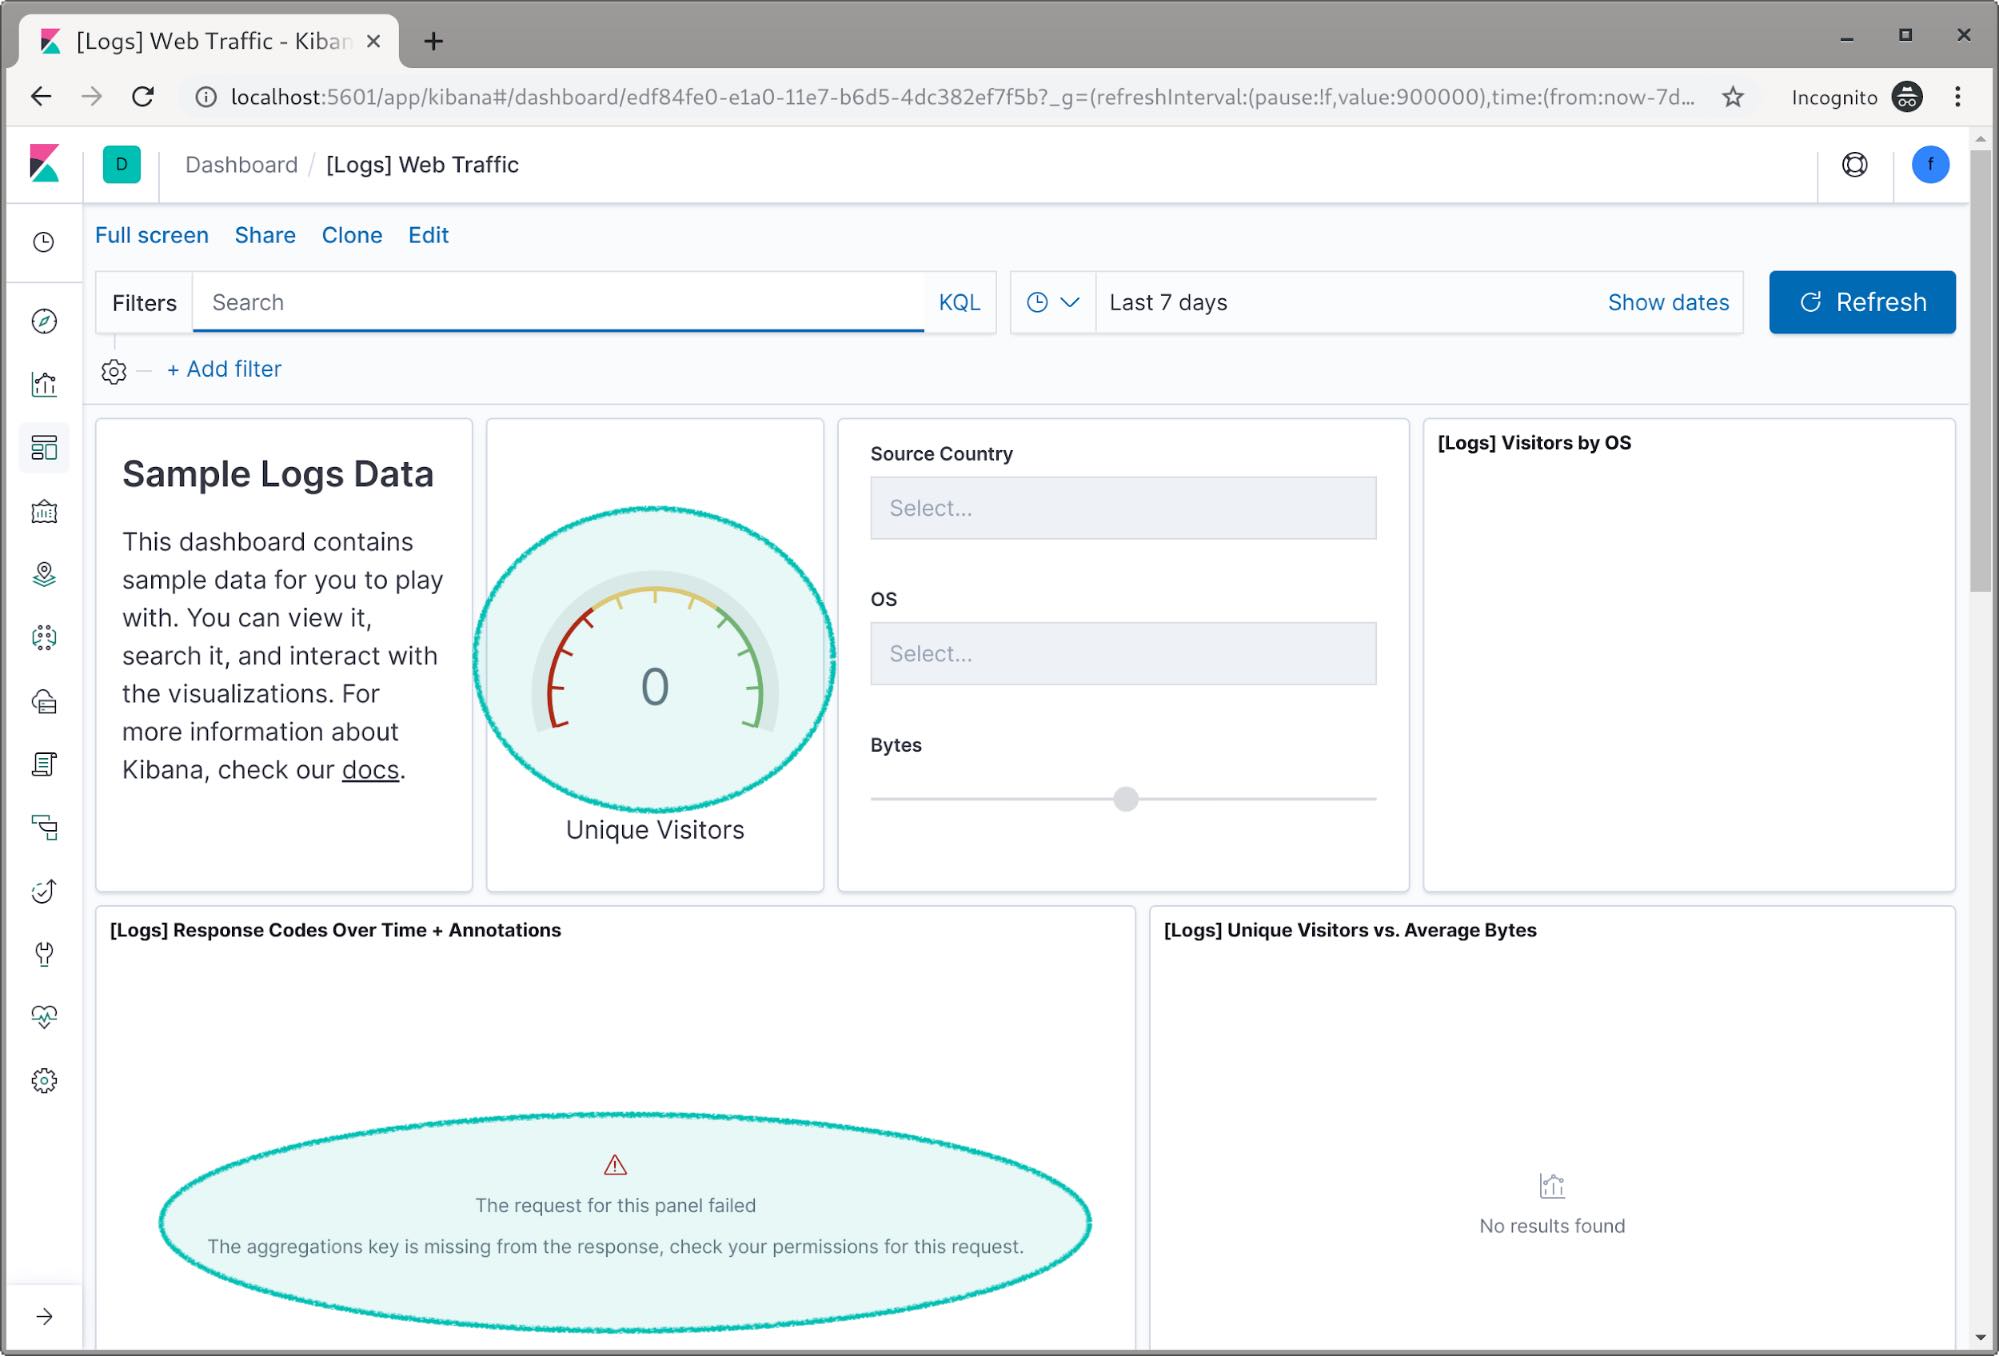
If we open the log dashboard, this time we can’t see any data. We even get an error because Kibana can’t access the log index.
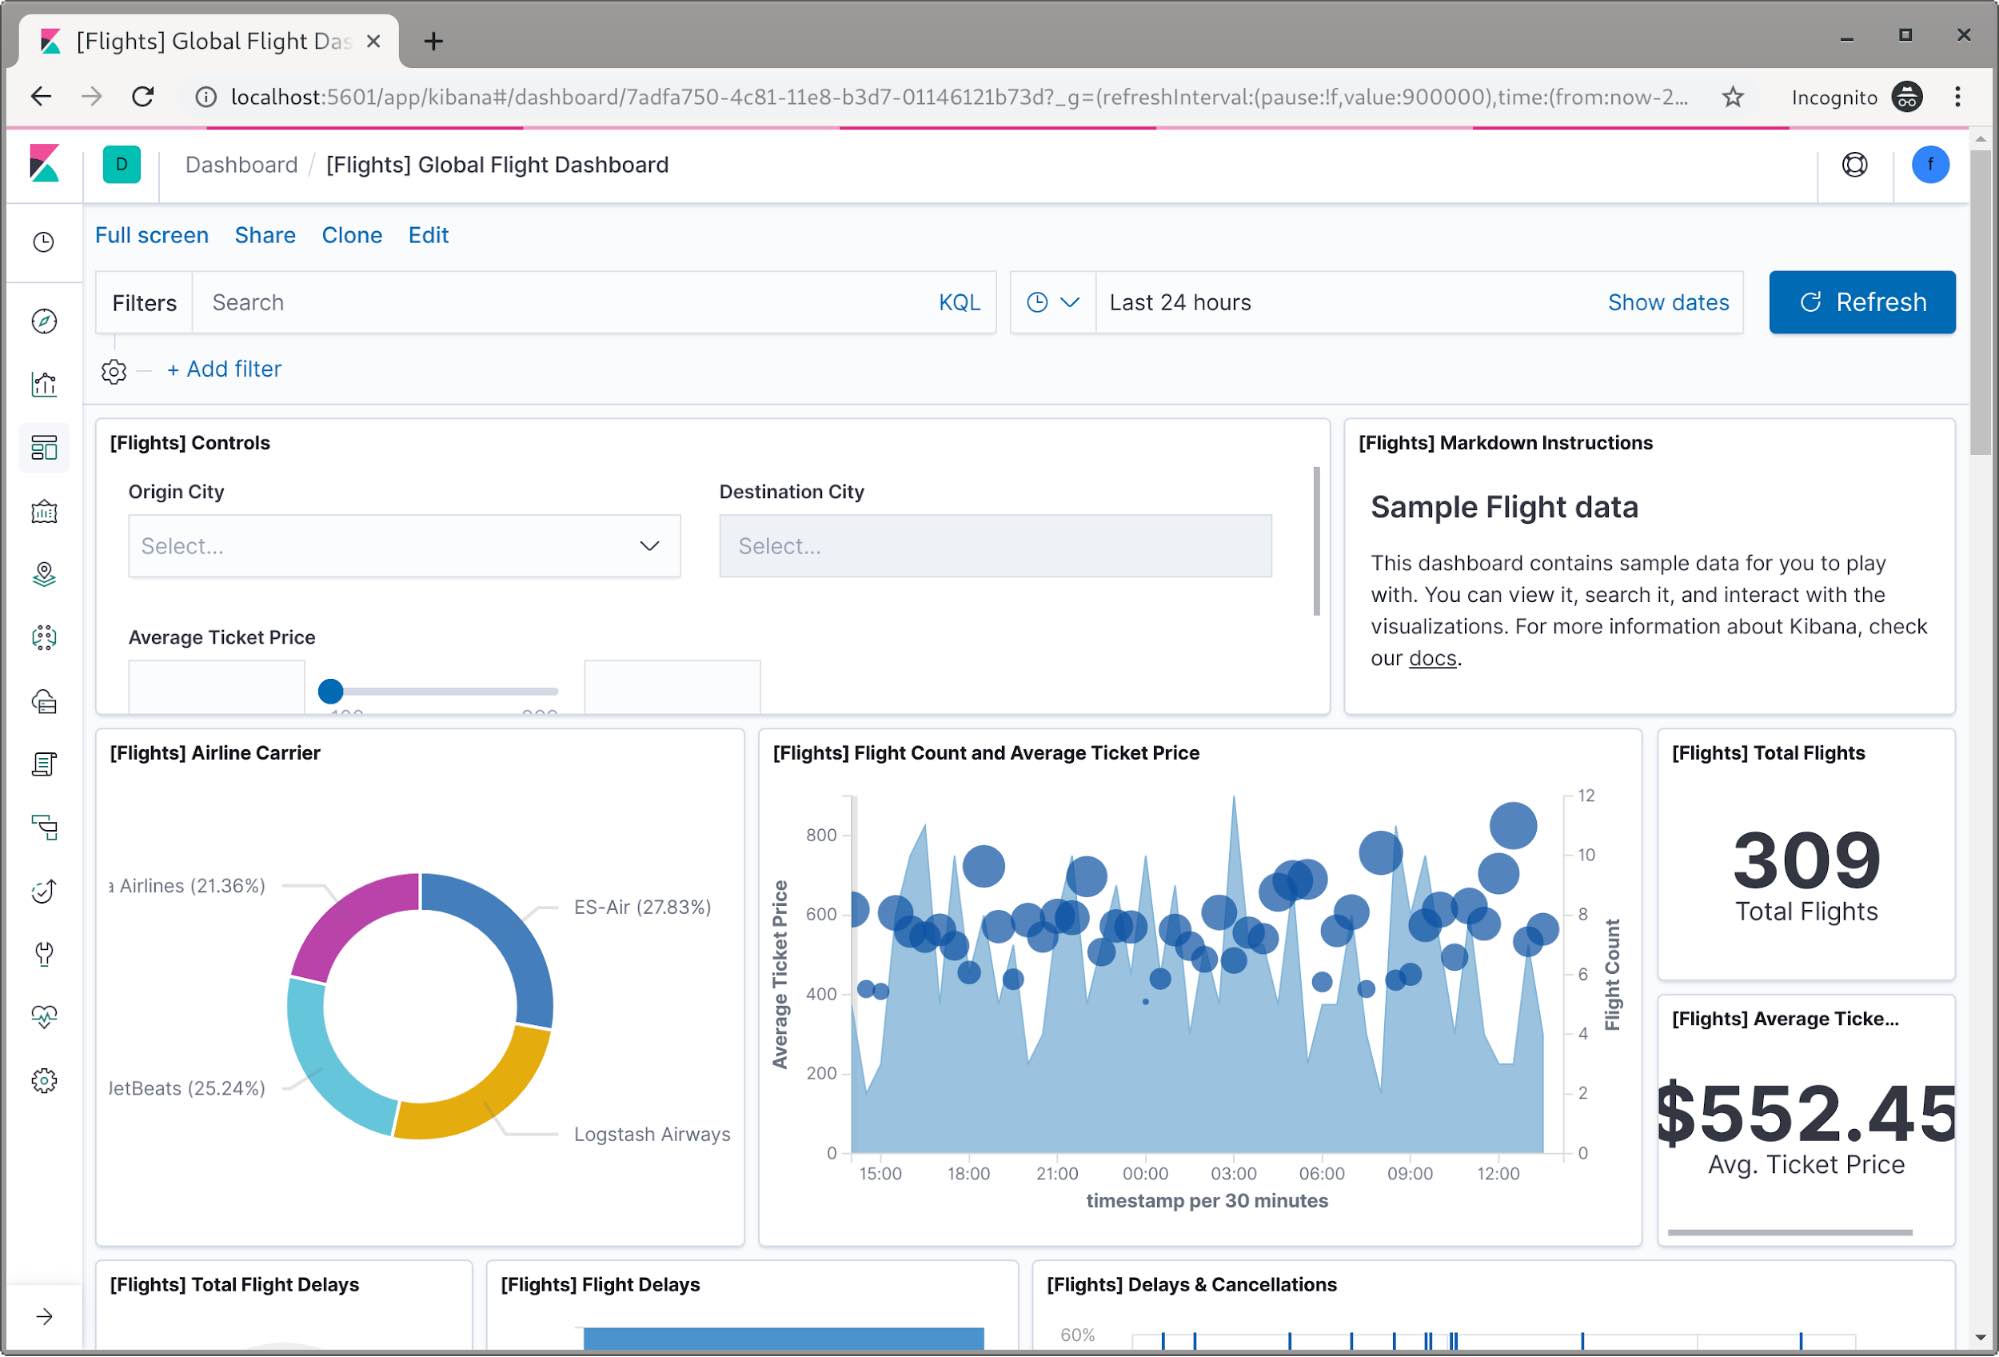
Now when we check the flight dashboard we can see we have access to the flight data this time.
Congratulations! We now have a two node cluster configured and two users with restricted access to index data.
Wrapping up
Security in the Elastic Stack is extremely versatile, there’s so much more that it can do that we didn’t cover in this post. The purpose of this post was to get you started. In the future we’ll have plenty of content covering many of the security features and how you can use them. In the meantime, we have more documentation and blog posts on how Elastic Stack security works and what else you can accomplish.
- Fundamentals of Securing Elasticsearch training
- Elasticsearch security documentation
- Configuring TLS blog post
- Kibana Spaces blog post
You can also ask for help on our public forum.
Happy searching!