A Full Stack in One Command
Concept
At Elastic, we are constantly looking for ways to make it easy for new users to experience the magic of the Elastic Stack. How can we shorten the time from "I have heard about this Elasticsearch thing" to "Oh, drill downs in Kibana are so amazing"?
During the recent reorganization of our examples repo (contributions always welcome!!), we updated the legacy Docker examples to reflect the publication of our official images. And then we had a whacky idea. Can we provide examples for our new users to experience the full stack in a single command? One command. Uno.
Now, if you have been following the evolution of the Elastic Stack, you would know that recent releases have focused on simplifying the getting started experience. They build on the idea that simple things should be simple. Logstash modules and Beats modules are both steps in that direction, providing both the necessary ingest pipelines for parsing data, as well as supporting dashboards for common data sources. We wanted to simplify this even further for new users in the exploratory mode looking to simply "get a feel" for the capabilities of the stack. Remember, all down to one command.
Before continuing, keep in mind that this example is for exploration purposes ONLY and is not appropriate for production use or as a means of initiating a production architecture - it simply provides a quick and easy way for a user to experience a fully featured stack with little effort.
Technology
The above restrictions were relevant when deciding on the appropriate technology for this problem. Despite all the recent developments in orchestration tooling, we decided Docker Compose still represents the easiest way of formulating a full stack example targeted at a single machine. Compose is a tool for defining and orchestrating multiple Docker containers to form an application. The containers, and their respective interactions, are largely defined through YAML files. These YAML files can be executed by Compose with a single command, including the initialization and startup all of the containers defined. We assume the reader has basic knowledge of Docker before proceeding.
Architecture
On confirming the technology, we had to decide what specifically to include. Ideally, the Compose example would simply deploy a complete stack. On closer inspection this aim was a little unrealistic. Our Beats modules, especially Filebeat and Metricbeat, have grown rapidly, allowing a wide range of technologies to be monitored. For now, we have therefore focused on deploying a range of Beats modules only, whilst ensuring appropriate data sources are available and automatically ingested to populate any dashboards. We will, however, update the example on the release of Logstash modules in 5.6. We settled on the following architecture which captures and populates as much data as possible:
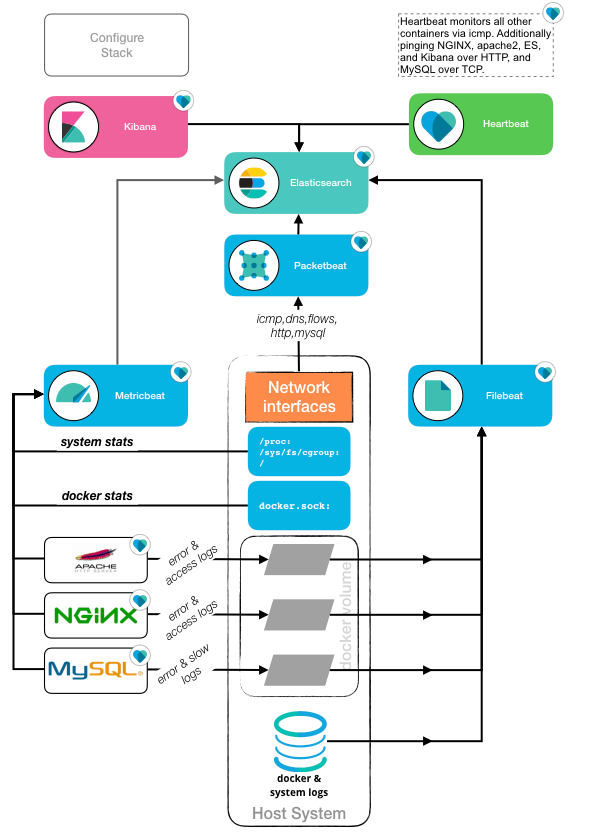
As illustrated above, as well as starting containers for Elasticsearch, Kibana and each of our Beats, we spin up instances of NGINX, Apache2 and MySQL. These provide interfaces for Metricbeat modules (apache, nginx, mysql) to monitor, as well as generating logs that can be consumed by equivalent modules in Filebeat (apache2, nginx, mysql). Furthermore, with some careful bind-mounting of local filesystem locations, Metricbeat can be used to monitor both the host's system statistics (via the system module) and the Docker containers themselves (via the docker module). Filebeat can additionally be used to collect and ingest the host's system logs using its equivalent of the system module, as well as the Docker JSON logs generated as a result of the containers sending their output to stdout. We use Packetbeat to collect and monitor any DNS, HTTP, or other layer-7 traffic traffic occurring on the host, including MySQL transaction data. Although not illustrated above (to avoid a spider web of connecting lines), Heartbeat monitors all other containers via ICMP, performs health checks against Kibana, Elasticsearch, Apache2 and NGINX over HTTP, and against MySQL through a raw TCP socket connection.
All of the above provides a fairly comprehensive set of monitoring (and duplication for purposes of example), for an architecture you might deploy, whilst maximising the number of modules deployed and dashboards populated. A full list of the dashboards for which data will be available is listed here. Deploying more modules would unfortunately require a prohibitive number of containers for hosts with limited resources, but users with larger systems could easily add further functionality - see Customising and Contributing.
Usage
To use the example, simply download and extract the archive provided here (Linux/OSX) or here (Windows). This provides a Docker Compose file for each operating system, supporting configuration files for each of the Elastic Stack components and some small datasets for ingesting through Logstash. Ensure you have Docker installed locally. The example itself was tested on Docker version 17.07.0 which includes docker-compose by default on Windows and OSX.
A few port considerations
TCP ports 80 (NGINX), 8000 (Apache2), 5061 (Libana), 9200 (Elasticsearch), 3306 (MySQL), 5000 and 6000 (both Logstash) are all mapped through to the host. Ensure these are available on the host and any existing services which might use them are stopped.
For those using Windows or OSX
For Linux, Docker uses native resource isolation features of the kernel such as cgroups, namespaces and a union-capable file system such as OverlayFS to provide Docker functionality. Docker for Windows (in Linux mode on Windows 10/2012) utilises a small Linux VM for the purposes of providing Docker functionality, powered by Hyper-V. OSX utilises a similar technique using HyperKit. Older implementations i.e. Docker Toolbox, utilised a Virtualbox VM. Supported versions are listed here.
The above has some important implications, specifically:
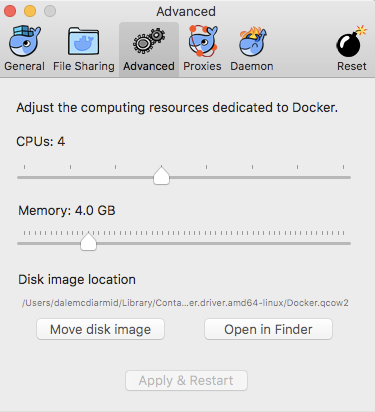
- The VM used by Windows and OSX will default to using only 2GB of memory. Given we assign 2GB to the Elasticsearch container alone, we strongly recommend increasing this to 4GB in the preferences. Further instructions for OSX here and Windows here.
- The Compose file provided relies on mounting several locations from the host operating system. These include:
- The "/private/var/logs" and "/var/logs" directories for OSX and Linux respectively, in order to access the system logs of the host rather than those of the Filebeat container. This is not supported on windows.
- "/proc" and "/sys/fs/cgroup" on Linux for the Metricbeat system module to report on the host memory, disk, network and CPU usage for the host machine rather than just the Metricbeat container. For OSX and Windows, this module will report the stats of the VM hosting Docker.
- "/var/run/docker.sock" to provide details of the Docker containers to the Metricbeat docker module. This should report the correct containers for all operating systems.
- The Packetbeat container binds itself to the host network in order to capture HTTP, DNS, ICMP and SQL traffic created by the user. For Windows and OSX, it appears the container only has visibility of network traffic within the host VM. Further investigation is underway, to see if this can be resolved, and contributions are welcome.
- For those using the older Docker implementation for Windows i.e. Docker Toolbox that utilises a Virtualbox VM, you will need to install the loopback adapter to allow communication with "localhost". Furthermore, you will need to configure port forwarding on the NAT interface for the Virtualbox VM. See here for additional details. Docker Toolbox for OSX has not been tested.
Important - In addition to the above, the Filebeat container needs access to the NGINX, Apache2 and MySQL logs. To achieve this, these containers mount a "./logs" volume to which their logs are written. Filebeat in turn also mounts this directory as read only. For OSX and Windows the user needs to ensure that this folder is bind-mounted and thus available to the Docker containers. Further instructions on achieving this - Windows, OSX. The appropriate OSX configuration panel is shown below.
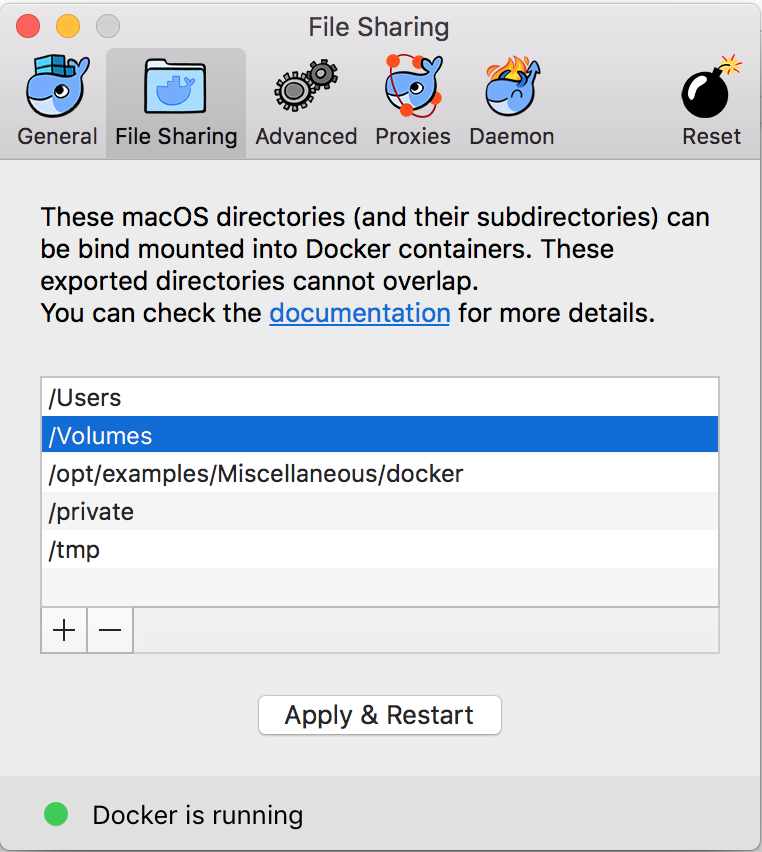
Note: This step can be skipped if you extract the example into a subdirectory of "/Users" on OSX or "C:\Users" on Windows. These directories are bind mounted by default.
Deploying the Stack
Starting a terminal, navigate to the extracted folder full_stack_example. On Linux ensure all config files are owned by root:
chown -R root:root ./config
Simply run the following command, adjusting for your supported operating system - OSX, Windows or linux.
docker-compose -f docker-compose-<operating_system>.yml up
e.g.
docker-compose -f docker-compose-osx.yml up
For those not familiar with Docker, this command initiates deployment of the architecture described in the Compose file. In order to do this, it first needs to download the images for each container. Whilst we make an effort to minimise the size of these images for each stack component, they still require a base operating system (currently Centos 7) and hence this might a good time to make a nice cup of tea.
To confirm the stack is fully deployed, issue the following command:
docker ps -a --format "{{.Names}}: {{.Status}}"
This should list the following containers:
- filebeat: Up 10 minutes
- packetbeat: Up 10 minutes
- heartbeat: Up 10 minutes
- metricbeat: Up 10 minutes
- logstash: Up 10 minutes
- configure_stack: Exited (0) 10 minutes ago
- kibana: Up 11 minutes (healthy)
- nginx: Up 11 minutes (healthy)
- mqsql: Up 11 minutes (healthy)
- elasticsearch: Up 11 minutes (healthy)
- apache2: Up 11 minutes (healthy)
You may have noticed that the container "configure_stack" above has actually exited. This container, shown in the earlier diagram, is deliberately short-lived and is responsible for some configuration details - including setting a password for Elasticsearch, loading the Beats dashboards, and adding a default Kibana index pattern.
Further technical details and instructions can be found in our examples repository here.
Exploring the data
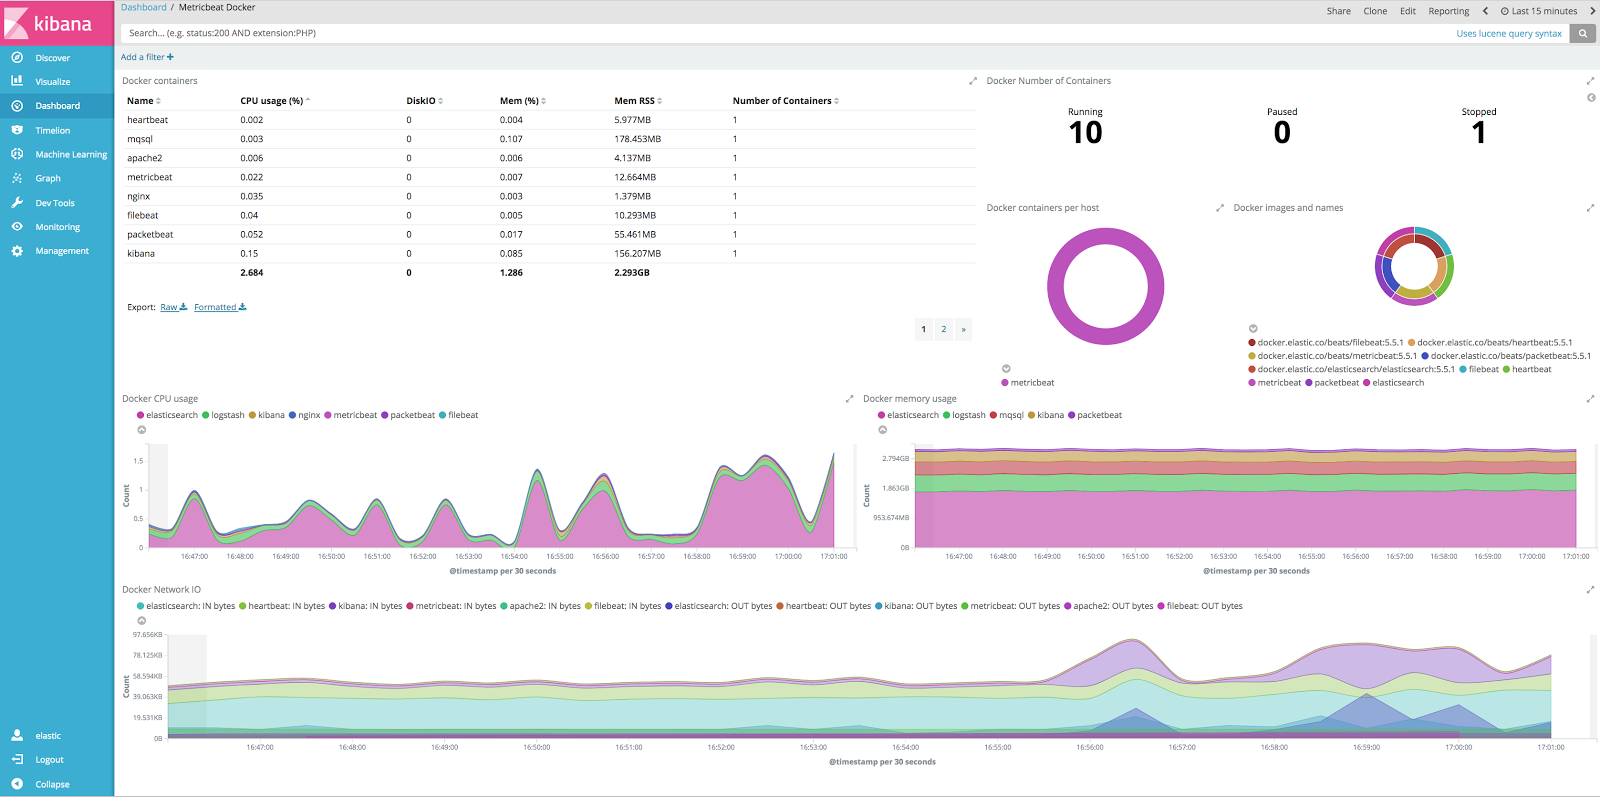
On completion of the deployment, navigate to the Kibana Dashboard view. For Docker for Windows you will need to use the url http://docker.for.win.localhost:5601/. The default credentials of "elastic" and "changeme" should apply unless these have been modified - see Customising and Contributing. The complete list of dashboards for which data is populated is significant - 22 out of 35 at the time of writing. Below we can see the "Metricbeat Docker" dashboard populated with the details of our containers.
Adding More data
The majority of these dashboards will simply populate due to inherent "noise" caused by the images. However, we do expose a few additional ports for interaction to allow unique generation. These include:
- MySQL - port 3306 is exposed allowing the user to connect. Any subsequent MySQl traffic will in turn be visible in the dashboards "Filebeat MySQL Dashboard", "Metricbeat MySQL" and "Packetbeat MySQL performance".
- NGINX - port 80. Currently we don't host any content in NGINX so requests will result in 404s. However, content can easily be added as described here.
- Apache2 - port 8000. Other than the default Apache2 "It works" pages the stack doesn't host any content. Again easily changed.
- Docker logs - Any activity to the Docker containers, including requests to Kibana, are logged. These logs are captured in JSON form and indexed into a index "docker-logs-<yyyy.mm.dd>".
Customising & Contributing
Firstly, we welcome contributions! Obvious customisations might be to add containers for other products often used in conjunction with the Elastic Stack, for which modules exist e.g. Kafka or Redis. As discussed earlier we balanced the containers started against what could realistically be hosted on a single machine. As we release further modules for Beats, as well Logstash, we will continue to enrich and maintain this example where possible.
Further details on customising this architecture, such as the Elasticsearch password, version or memory size, can be found here.
For new users to the Elastic Stack, hopefully the above has simplified your experience from hearing about Elasticsearch to getting started. Using Docker Compose we have shown how a full stack can be deployed in a single command, with data from Beats modules used to populate a wide range of rich and interactive dashboards.
In writing this blog, I would like to mention a special thanks to Toby McLaughlin and Dimitrios Liappis for the initial inspiration and guidance, as well as Jamie Smith for converting grey boxes into usable diagrams. Finally, thanks to Rathin Sawhney for acting as a Windows guinea pig.
1 The Docker logs are collected by the Filebeat container mounting the host directory /var/lib/docker/containers. These JSON files are in turn collected and processed by a custom ingest pipeline.