What’s new in Kibana 7.10.0: Kibana Lens is now generally available
We’re pleased to announce the availability of Kibana 7.10! This release brings major developments, including:
- Kibana Lens general availability
- The ability to create dashboard drilldowns to web apps
- Role-based access controls (RBAC) for alerting
Want to get hands-on with Kibana features today? Elastic Cloud is the only managed Elasticsearch offering to include these new capabilities, and you can spin up a deployment in minutes with a free trial. You can also easily download the latest versions of Kibana and the Elastic Stack.
For a full list of bug fixes and other changes, check out our Kibana 7.10 release notes.
Kibana Lens is now generally available
Kibana Lens is an easy and intuitive way to visualize your Elasticsearch data using a simple drag-and-drop interface. Lens is the future of Kibana data visualization and the ideal experience we want our users to enjoy. After 11 months in beta, we’ve seen hundreds of thousands of people use Lens to explore their data like never before and with such tremendous feedback we know the time is right to let everyone experience it by bringing Kibana Lens to this next milestone.
Since its beta release nearly a year ago, we’ve continuously added numerous capabilities to Lens aided by tremendous feedback from thousands of Lens users in our community. From new chart types like donut charts and treemaps to granular analytics formatting capabilities, Lens has grown with every release in 2020 — and this is just the beginning.
And with Kibana Lens moving to general availability, it is now officially recommended for production use cases.
Lens is also full of new features for 7.10 that give you even more flexibility to find and share insights, including:
- New percentage-based chart types
- The ability to filter aggregations
- Multiple new formatting and configuration options
To learn more about Kibana Lens becoming generally available its new 7.10 features, be sure to read the 7.10 Kibana Lens blog.
Build dashboards that drive insight and action with URL drilldowns
Dashboards present insights that drive critical decision-making, whether you’re surveilling for real-time cyber threats in a security operations center or monitoring for system incidents in developer operations.
Kibana can help you transform these insights into actionable insights.
Bridge the gap from decision to action with a new capability in 7.10: URL drilldowns. Previously we introduced dashboard-to-dashboard drilldowns as a way for you to build analytical navigation paths for viewers between dashboards. Now in 7.10 you can dramatically expand the destination of those paths to be any URL. With a single click, you can go directly from spotting malicious cyber activity in your Kibana web security dashboard to blacklisting an IP in your firewall solution. In seconds, you can respond to application performance issues spotted in your monitoring views by navigating to your incident response platform.
New URL drilldowns in Kibana are more than just a navigation aid: each Kibana visualization has the ability to support a URL drilldown with query string parameters taken from the data itself.
This lets you skip the manual steps such as copying and pasting IP addresses or hostnames while tabbing between views. URL drilldowns in Kibana can help generate tickets with fields already filled out, automatically populate incident information into description fields, and pre-designate priority statuses based on data already in your dashboard.
URL drilldowns are available in beta with Kibana 7.10 as part of a Gold subscription and higher. To learn more, sign up for our upcoming webinar, How to build dashboards that drive insight and action in Kibana.
Move faster in Kibana with new navigational search
Kibana is the primary way to engage with your data at Elastic, from our solutions for enterprise search, observability, and security to ad hoc analysis in Dashboard and Discover.
As the list of awesome interfaces in Kibana continues to grow, we aim to provide easy paths for you to get you where you need to be. In 7.10 we’ve added navigational search so you can rapidly move directly to a dashboard, visualization, or application in just a few keystrokes. Using the new keyboard shortcuts means you can give your mouse a rest and go from the Kibana homepage to your destination in seconds. We’re excited to take this first step in the journey of bringing the power of embedded search to you inside of Kibana.
Support for Vega in Kibana is now generally available
Every day we get new Kibana requests from our community. These include new chart types, specific customizations for the visualizations, and even new interactions experiences (such as the ability to replace a chart text tooltip with a video, for example).
While we are constantly incorporating more and more of these requests into Kibana, we also want to give you the freedom to build your own unique capabilities with tools like custom plugins. When it comes to visualizations and chart customizations however, we also provide another option using Vega. For those not familiar with Vega, it is a declarative language for creating, saving, and sharing interactive visualization designs in a JSON format. Kibana has supported Vega with an experimental designation since 6.3, and since then we’ve deepened our ability to help customers using this integration to create highly customized visualizations. For this reason we are pleased to announce that with 7.10 Vega will move to generally available status.
While Kibana Lens and TSVB are still our recommended paths for creating new visualizations in Kibana, we also want to make sure you know we’re committed to supporting Vega for additional use cases. To learn more about using Vega in Kibana, check out our documentation and tutorials.
Add descriptions to your charts on a dashboard
Often it’s helpful to provide the viewers of dashboards with additional information on a visual analysis. What data is being used? Why was a specific approach taken? What might be an important consideration or conclusion?
Chart titles are helpful but can only convey so much, so you might need more space to add necessary details and context — especially with nuanced or complex data questions. Kibana 7.10 incorporates panel descriptions into the ‘i’ information icon tooltip. Now when add a description to a chart, it’ll appear as a tooltip above the ‘i’ in the panel when you hover your cursor over it.
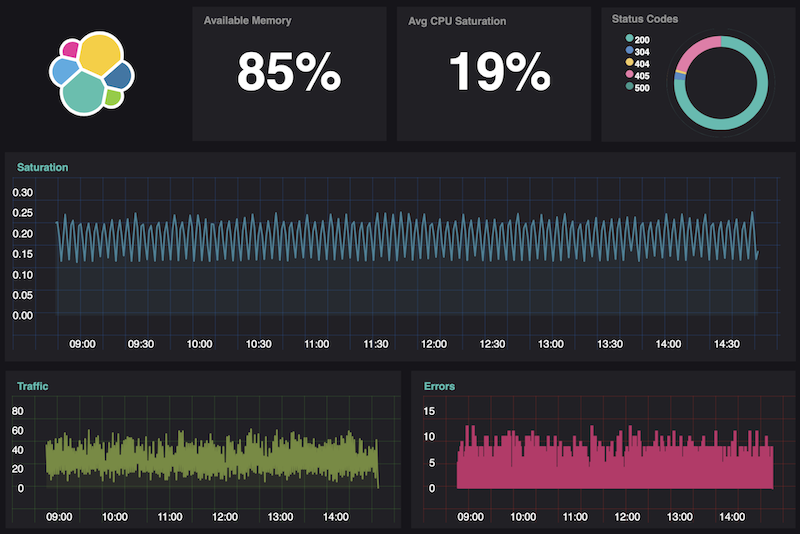
Extend observability analytics with the Canvas APM template
In September, the Canvas and APM teams collaborated to release the first Canvas solution template built for teams responsible for application health as a way to extend Elastic Observability’s out-of-the-box visualization capabilities. Available for download here, this pre-made Canvas workpad lets anyone use their existing APM data already in the Elastic Common Schema (ECS) to rapidly create a beautiful dashboard tracking key performance indicators like available memory, CPU saturation, and even various status codes.
Elastic Maps
Simplified upload of files with latitude and longitude data
Geography matters. We’re on a mission to make ingesting, analyzing, and acting on geospatial data easier than ever. In 7.10, we’ve updated the File Data Visualizer capability to recognize and combine latitude and longitude fields in file uploads. This process automatically creates a geo_point field in the resulting Elasticsearch index and saves you the time of manually having to configure this during import.
See more data in your Elastic Maps with super-fine resolution
For anyone working with large amounts of geopoint data, we added a new option for faster data display at a much higher level of detail. In Elastic Maps 7.10 we’re pleased to introduce a super-fine resolution option into beta, offering an ultra-granular display when using grids and clusters. This new capability is made possible by the ability to use the vector tiles option for raw documents.
Alerts in Elastic Maps for tracking what matters
Also included in 7.10 is a new alert: tracking threshold. With tracking alerts you can monitor the location of entities in real time and trigger a notification or write-back to an index when any entity enters a specified boundary. This beta feature can be turned on by editing your kibana.dev.yml file and adding the following modification:
xpack.trigger_actions_ui.enableGeoTrackingThresholdAlert: true
We’re especially eager for feedback on this particular feature, so please don’t hesitate to share your thoughts in the maps section of the Elastic forums or send your comments directly to us via our Kibana feedback form.
Speaking of alerts…
Stay notified with new alerting features
Try new alerting connectors
We’re excited to announce several enhancements to the new alerting framework, starting with the growth of our collection of alerting connectors and the addition of Jira and IBM Resilient for all alert types. Alerting in the Elastic Stack is critical for use cases like incident management, and these alerting integrations will continue to help you leverage Elasticsearch data to drive notification and issue resolution. As always, we continue to invest and innovate in alerting, so look for additional connectors to be added in future releases.
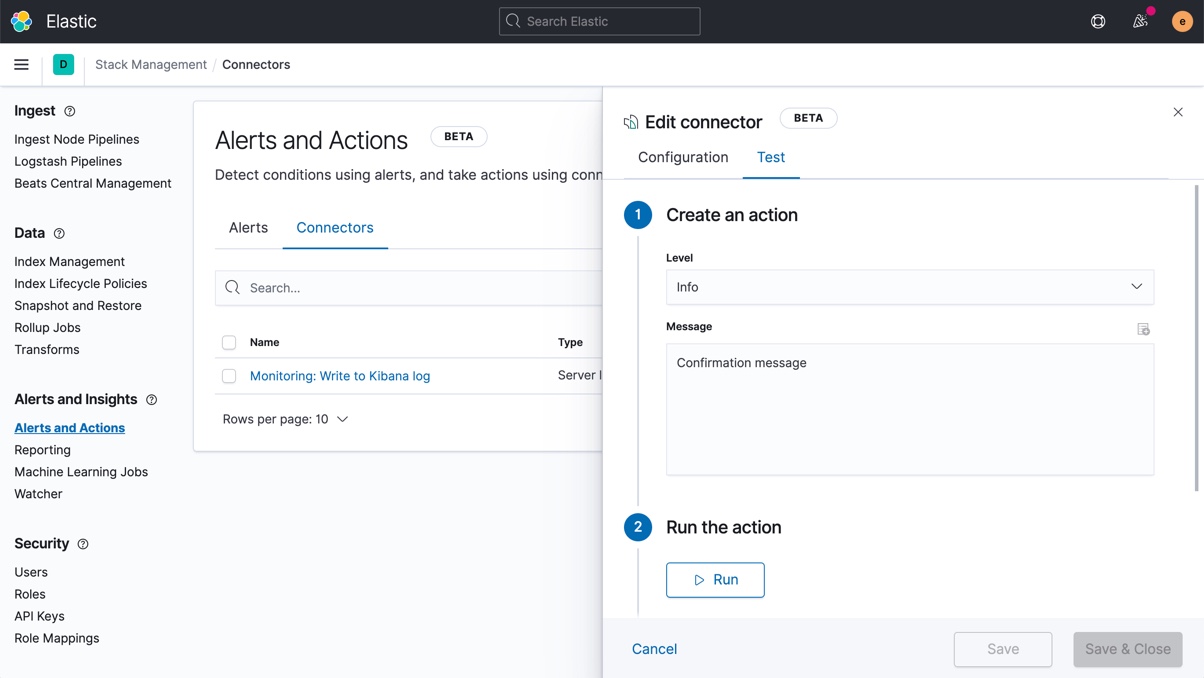
Guarantee alerting connectors work with new test option
While Kibana’s intuitive user interface makes setting up alerts and connecting them to actions easy, it’s still possible to accidentally misconfigure them from time to time (such as a wrong email address or incorrect API key, for example). To safeguard against these scenarios, we’ve introduced the ability to test an alerting connector to verify it works as part of the initial set up process.
Role-based access control (RBAC) comes to alerts
In 7.10 we’ve added RBAC for alerts and actions. This means that you can now secure them based on your organization’s access model. Elastic solution alerts will only be accessible for users that have access to each solution and application as required.
We’ve also added a feature control for stack-level alerts, currently including the index threshold alert type, with more stack alert types in the future. Plus, a feature control for actions and connectors allows you to control which roles can create connectors and attach actions to your alerts. For more details on how you can leverage RBAC with alerting in the Elastic Stack to enforce your authorization model, please see our alerting documentation.
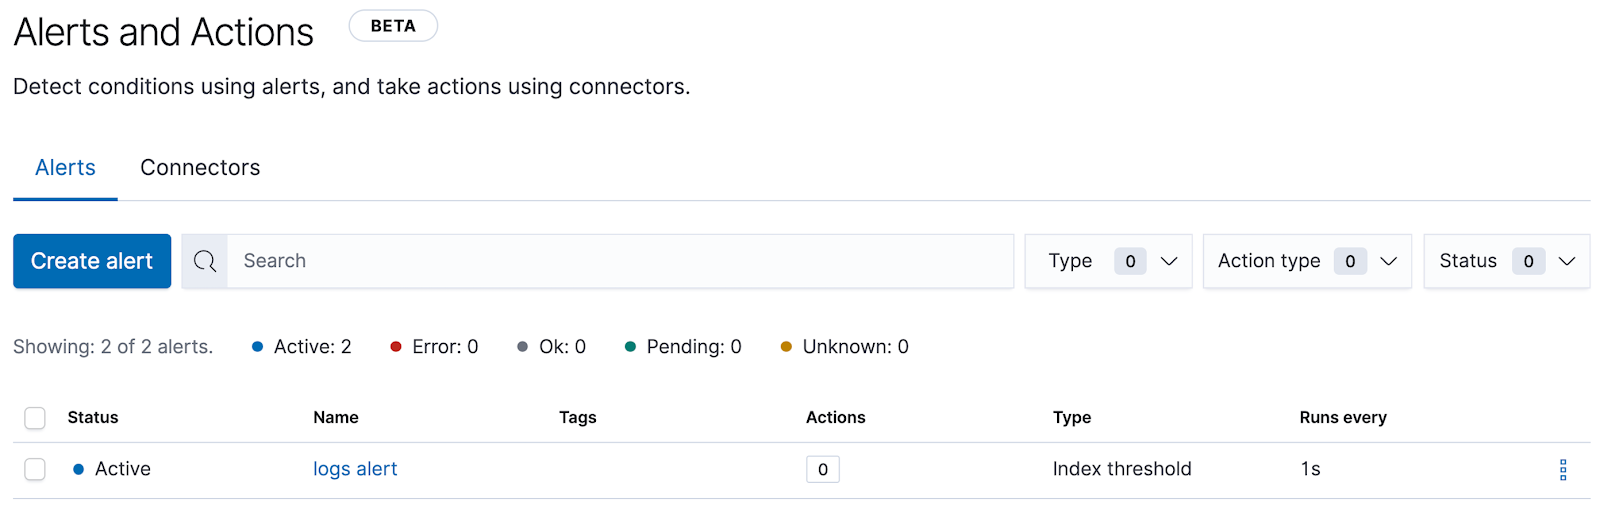
See alert statuses at a glance
And there’s more! Kibana allows you to manage all your alerts in one place with Alerts and Actions management views. We’ve enhanced these views to include alert statuses that provide you with immediate visual feedback on whether an alert is currently active (i.e. the alerting condition is met), inactive or it returns an error (in which case you will also see information about the error, to help you troubleshoot).
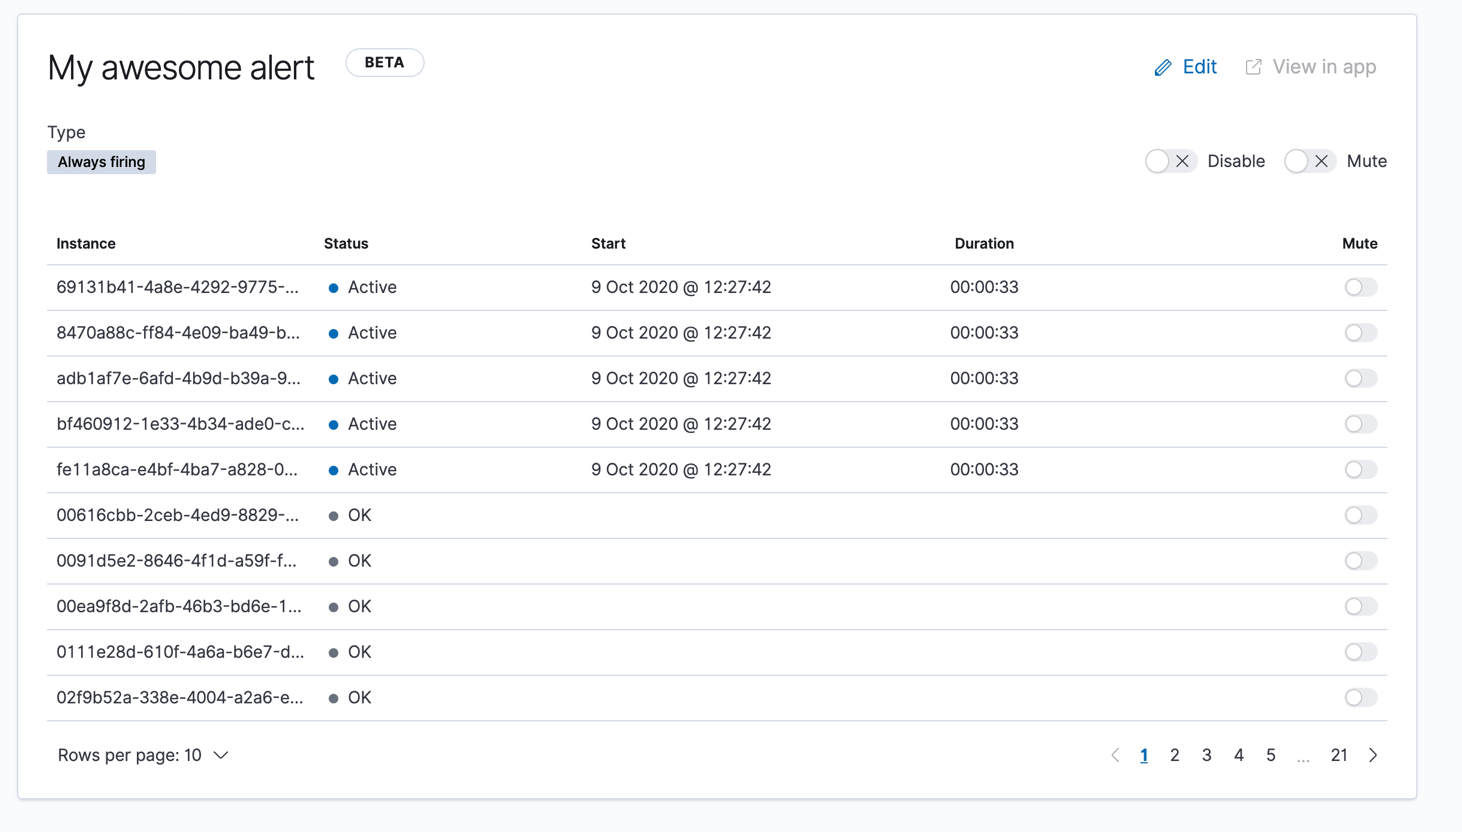
Get deeper alert details
To give you a clearer picture of your alerts’ behavior, the Alert Details view has been enhanced to include alert instances that were active recently but have since recovered.
Securing your Elastic Stack
Get clearer access with a cleaner interface
Kibana’s Stack Management application offers administrators an ever-growing suite of tools to help you manage your stack. Until now, its feature menu displayed tools that some users didn’t have interest in or privileges to access. With 7.10, Stack Management now only shows the features that each user is authorized to access based on the cluster and index privileges their role gives them. This gives you a cleaner experience overall, but it also allows administrators to use Kibana privileges to easily set up for popular use cases such as dashboard-only access.
Easily manage saved objects
While laying the groundwork for sharing saved objects in multiple spaces, we overhauled the UI for copying and importing saved objects. When copying saved objects, you now have the option to create new objects. You can also more easily resolve conflicts, and the flyout shows more helpful information. After importing saved objects, you’ll see a summary of what objects were created.
Key rotation for encrypted saved objects and more
As we work on enhancing security and improving the UX around it, we always look to add value with smaller continuous improvements on both aspects. In security, rotation is key. That’s why we’ve added key rotation for encrypted saved objects.
Key rotation will improve your security while allowing you to use saved objects encrypted with old keys uninterrupted. Separately, if you start adding data to an insecure cluster, you’ll be presented with a warning. Although we hope that this will encourage you to enable and take advantage of the array of free Kibana security features, as an admin you can disable the warning for all users through Kibana configuration.
We’ve also improved the UX around feature controls both in the Kibana privileges (role definition) view and the space editing view to reflect the main Kibana navigation structure.
Better detection with new machine learning (ML) features
Spot spikes with the Anomaly Detection integration in Metrics
The updated Metrics app now allows you to build anomaly detection ML jobs and view any anomalies within the new Timeline feature in Metrics. These jobs detect anomalous spikes in memory and network behavior on hosts and Kubernetes deployments. You can create the jobs from directly within the Metrics app and then view the job results within machine learning.
Additional anomaly detection configurations in Elastic Security
Elastic Security now provides additional anomaly detection jobs out of the box for ECS fields. Twelve new metadata and discovery analysis jobs have been added to enable threat detection on metadata services, system and discovery processes, and compiler events.
Get better anomaly scoring with anomaly detection categorization
Categorization for text fields such as log messages allow you to classify and categorize similar types of log messages for anomaly detection. Per-partition categorization enables you to get better anomaly scoring for multiple categories of log messages or text fields.
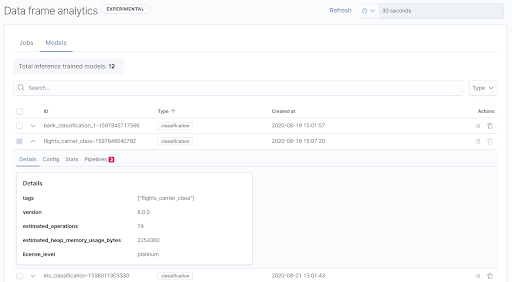
Manage data frame analytics models
Enhancing the functionality for data frame analytics supervised learning, you can now manage the trained models within the machine learning application. The new tab lists each model, with detailed information displayed on row expansion including the inference and job configuration and stats. It also contains a list of which ingest pipelines are making use of each model.
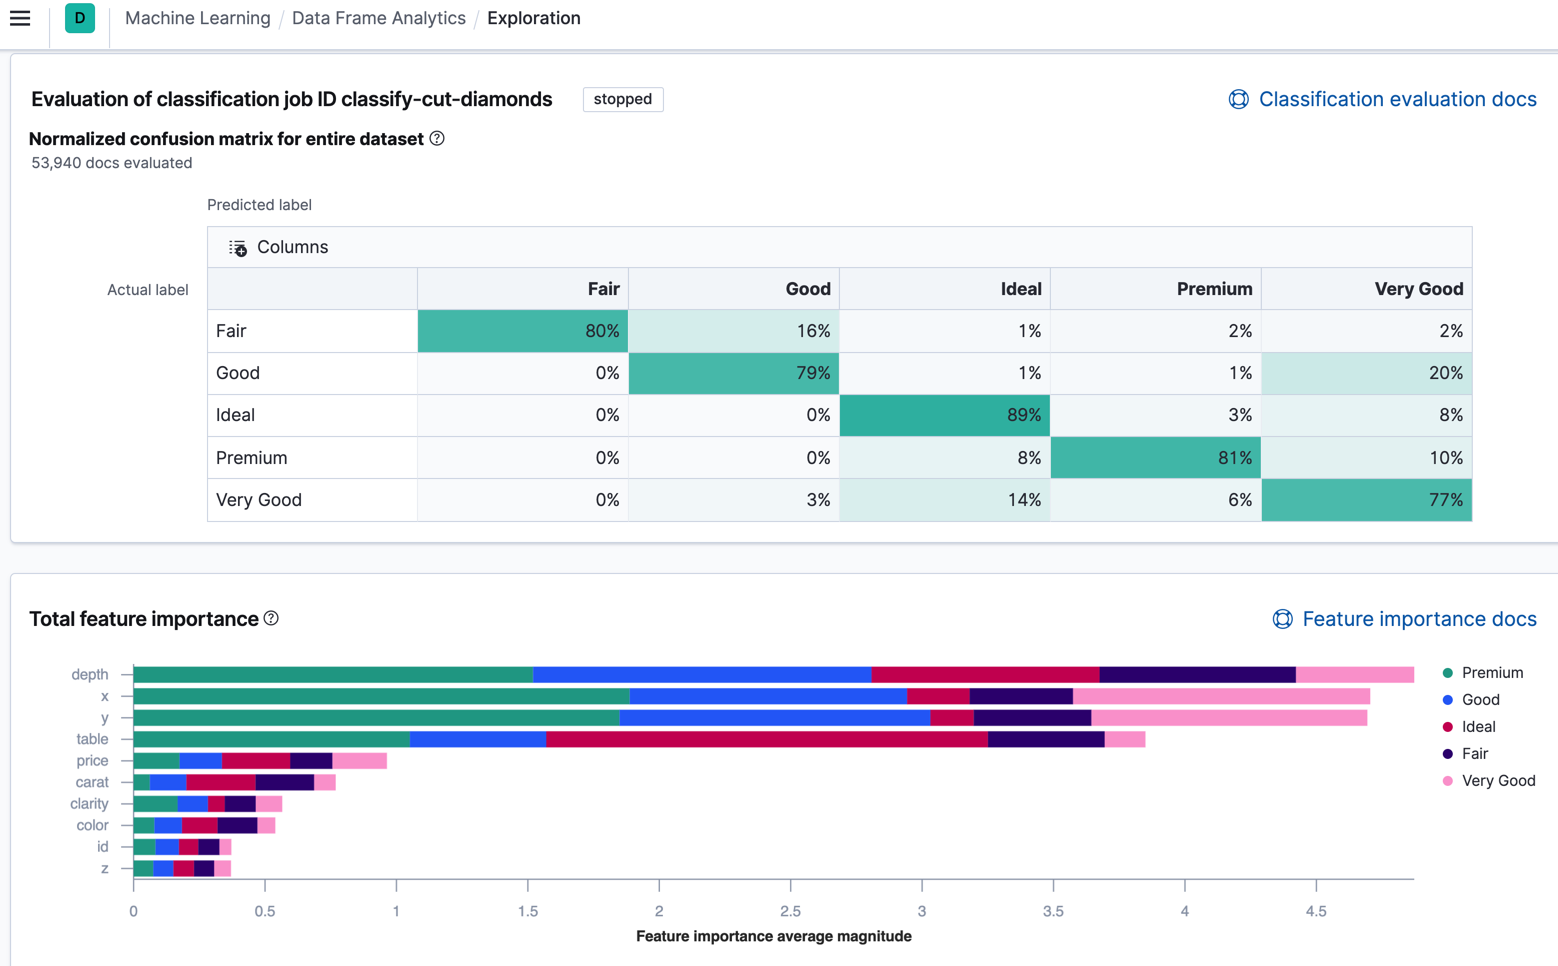
Better understand feature importance
When you examine the results from your {classification} or {regression} {ml} jobs, you can use feature importance to understand which fields had the biggest impact on each prediction. In 7.10, you can see the average magnitude of the feature importance values for each field across all the training data.
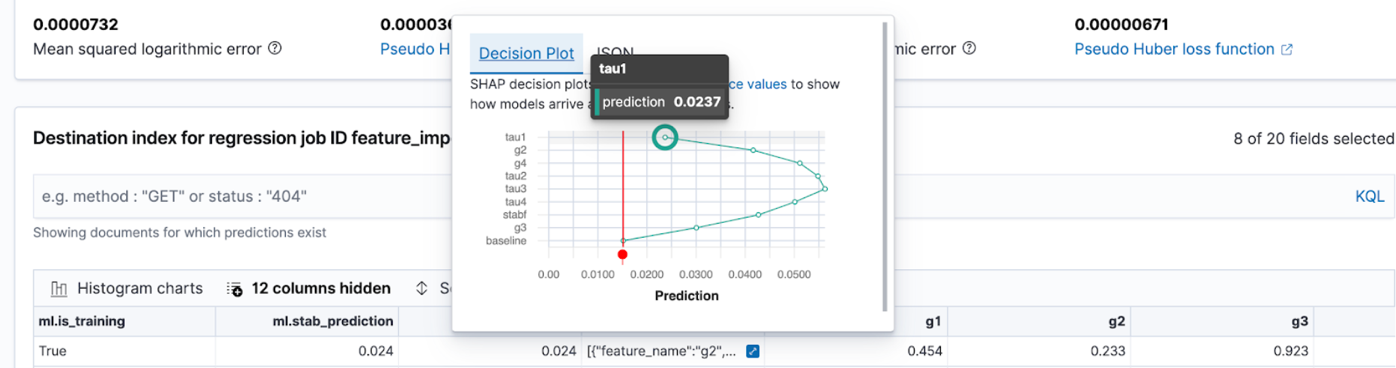
In addition, you can also now examine the feature importance values for each individual prediction in the format of JSON objects or decision plots.
Try Kibana 7.10 today
You can try these new 7.10 features with a free trial of Elasticsearch Service on Elastic Cloud. Downloading the latest builds is also a great way to get started with these new capabilities.
Find us on Twitter (@elastic) or in our forum and let us know what you think. And as always, never hesitate to reach out on the GitHub issues page.
Related blogs: