Blog
Pruning incoming log volumes with Elastic
To drop or not to drop (events) is the question, not only in deciding what events and fields to remove from your logs but also in the various tools used. Learn about using Beats, Logstash, Elastic Agent, Ingest Pipelines, and OTel Collectors.
Elasticsearch turns raw logs into structured, searchable data at ingest. Follow the collect and analyze logs tutorial to see it end-to-end. Start a free cloud trial or try Elastic on your local machine now.
filebeat.inputs:
  - type: filestream
    id: my-logging-app
    paths:
      - /var/log/*.log
filebeat.inputs:
  - type: filestream
    id: my-logging-app
    paths:
      - /var/tmp/other.log
      - /var/log/*.log
processors:
  - drop_event:
      when:
        and:
          - equals:
            url.scheme: http
          - equals:
            url.path: /profile
filebeat.inputs:
  - type: filestream
    id: my-logging-app
    paths:
      - /var/tmp/other.log
      - /var/log/*.log
processors:
  - drop_fields:
      when:
        and:
          - equals:
            url.scheme: http
          - equals:
            http.response.status_code: 200
        fields: ["event.message"]
        ignore_missing: false
input {
  file {
    id => "my-logging-app"
    path => [ "/var/tmp/other.log", "/var/log/*.log" ]
  }
}
filter {
  if [url.scheme] == "http" && [url.path] == "/profile" {
    drop {
      percentage => 80
    }
  }
}
output {
  elasticsearch {
        hosts => "https://my-elasticsearch:9200"
        data_stream => "true"
    }
}
# Input configuration omitted
filter {
  if [url.scheme] == "http" && [http.response.status_code] == 200 {
    drop {
      percentage => 80
    }
    mutate {
      remove_field: [ "event.message" ]
    }
  }
}
# Output configuration omitted
PUT _ingest/pipeline/my-logging-app-pipeline
{
  "description": "Event and field dropping for my-logging-app",
  "processors": [
    {
      "drop": {
        "description" : "Drop event",
        "if": "ctx?.url?.scheme == 'http' && ctx?.url?.path == '/profile'",
        "ignore_failure": true
      }
    },
    {
      "remove": {
        "description" : "Drop field",
        "field" : "event.message",
        "if": "ctx?.url?.scheme == 'http' && ctx?.http?.response?.status_code == 200",
        "ignore_failure": false
      }
    }
  ]
}
PUT _ingest/pipeline/my-logging-app-pipeline
{
  "description": "Event and field dropping for my-logging-app with failures",
  "processors": [
    {
      "drop": {
        "description" : "Drop event",
        "if": "ctx?.url?.scheme == 'http' && ctx?.url?.path == '/profile'",
        "ignore_failure": true
      }
    },
    {
      "remove": {
        "description" : "Drop field",
        "field" : "event.message",
        "if": "ctx?.url?.scheme == 'http' && ctx?.http?.response?.status_code == 200",
        "ignore_failure": false
      }
    }
  ],
  "on_failure": [
    {
      "set": {
        "description": "Set 'ingest.failure.message'",
        "field": "ingest.failure.message",
        "value": "Ingestion issue"
        }
      }
  ]
}
receivers:
  filelog:
    include: [/var/tmp/other.log, /var/log/*.log]
processors:
  filter/denylist:
    error_mode: ignore
    logs:
      log_record:
        - 'url.scheme == "info"'
        - 'url.path == "/profile"'
        - "http.response.status_code == 200"
  attributes/errors:
    actions:
      - key: error.message
        action: delete
  memory_limiter:
    check_interval: 1s
    limit_mib: 2000
  batch:
exporters:
  # Exporters configuration omitted
service:
  pipelines:
    # Pipelines configuration omitted
How helpful was this content?
Not helpful
Somewhat helpful
Very helpful
Related Content
The service with the most errors was healthy: root cause analysis from logs with ES|QL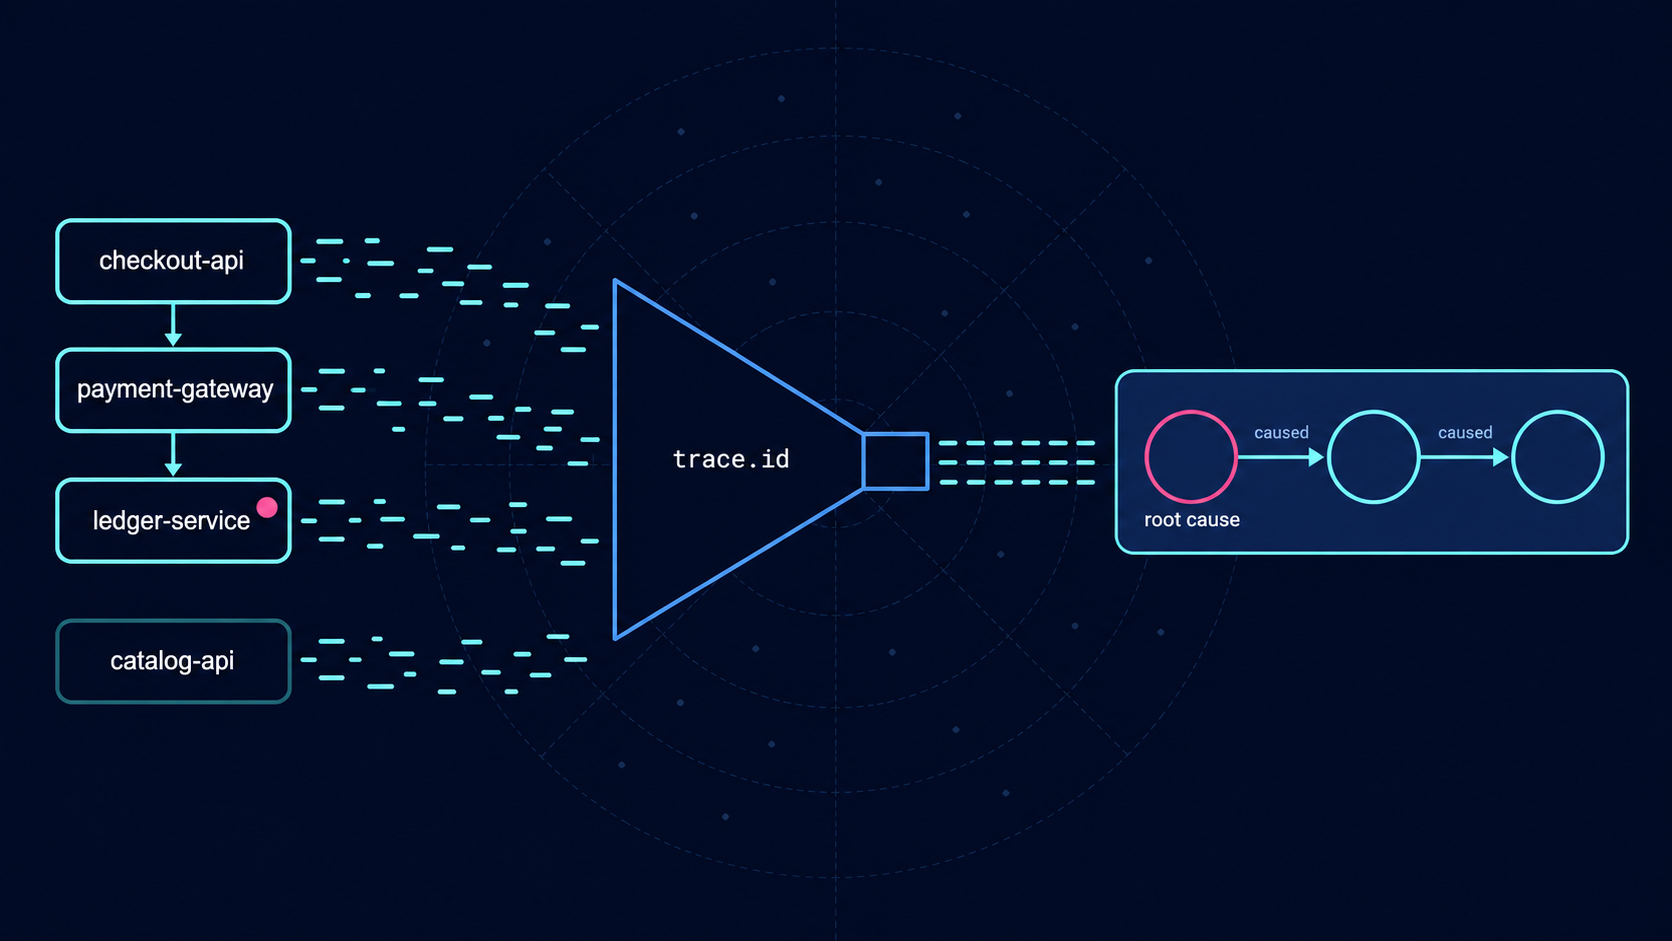
The service with the most errors was healthy: root cause analysis from logs with ES|QL
14 alerts, 1 incident: Measuring alerting rule noise with ES|QL in Elasticsearch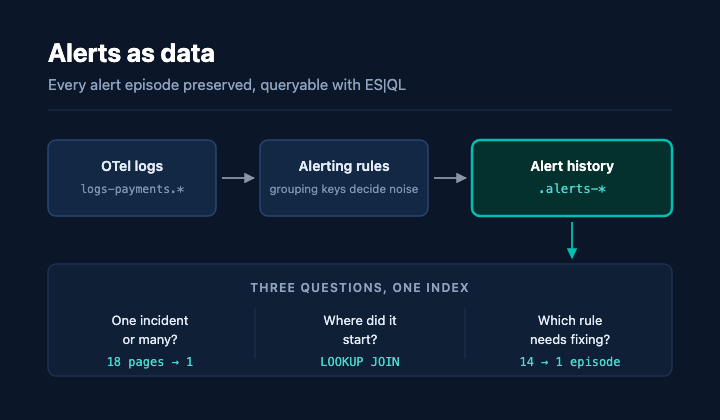
14 alerts, 1 incident: Measuring alerting rule noise with ES|QL in Elasticsearch
Cross-project search for Elastic Observability: one query across every linked project