
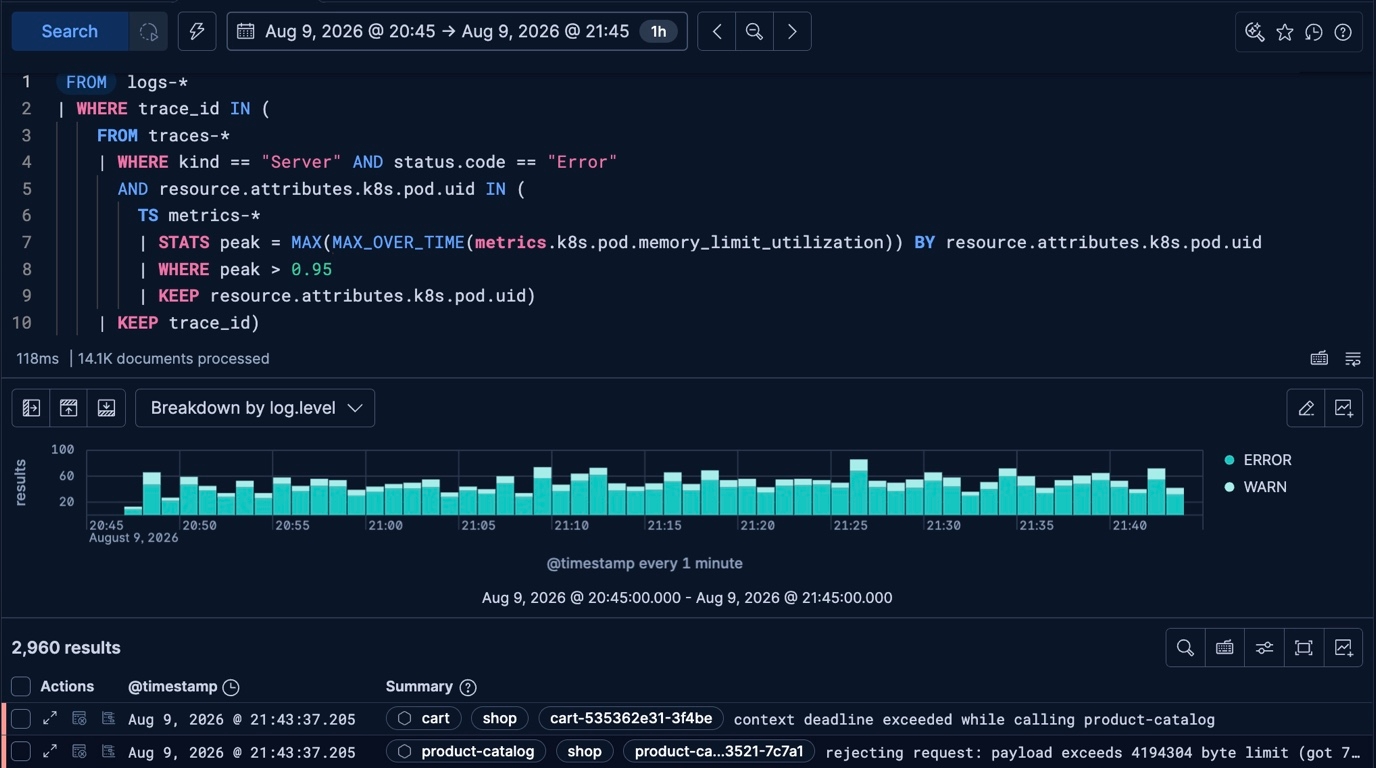
Correlate logs, metrics, and traces in one ES|QL query
Walk through four investigations, from CPU saturation to pod memory pressure, each answered by a single query across signal types.

From CrashLoopBackOff to OOMKilled with PromQL in Elasticsearch and Kibana
Use PromQL in Elasticsearch and Kibana to move from a CrashLoopBackOff alert to OOMKilled, memory versus the limit, and a verified fix.
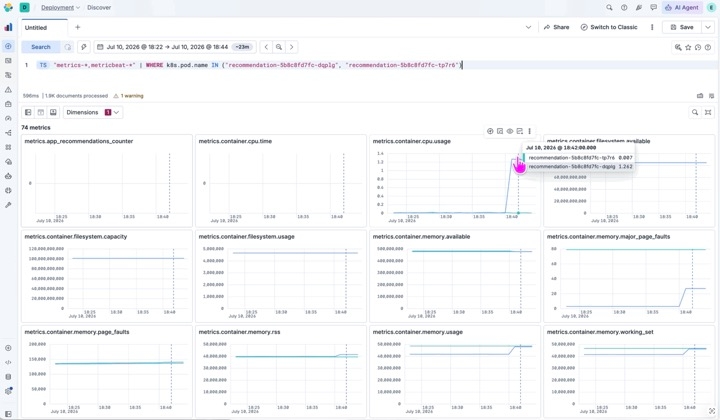
Four clicks from alert to root cause: how Elastic Observability links APM services to Kubernetes infrastructure
Check service dependencies and compare per-pod CPU, memory and network trends on the Infrastructure tab to find which instance is causing trouble, all without leaving the alert investigation.
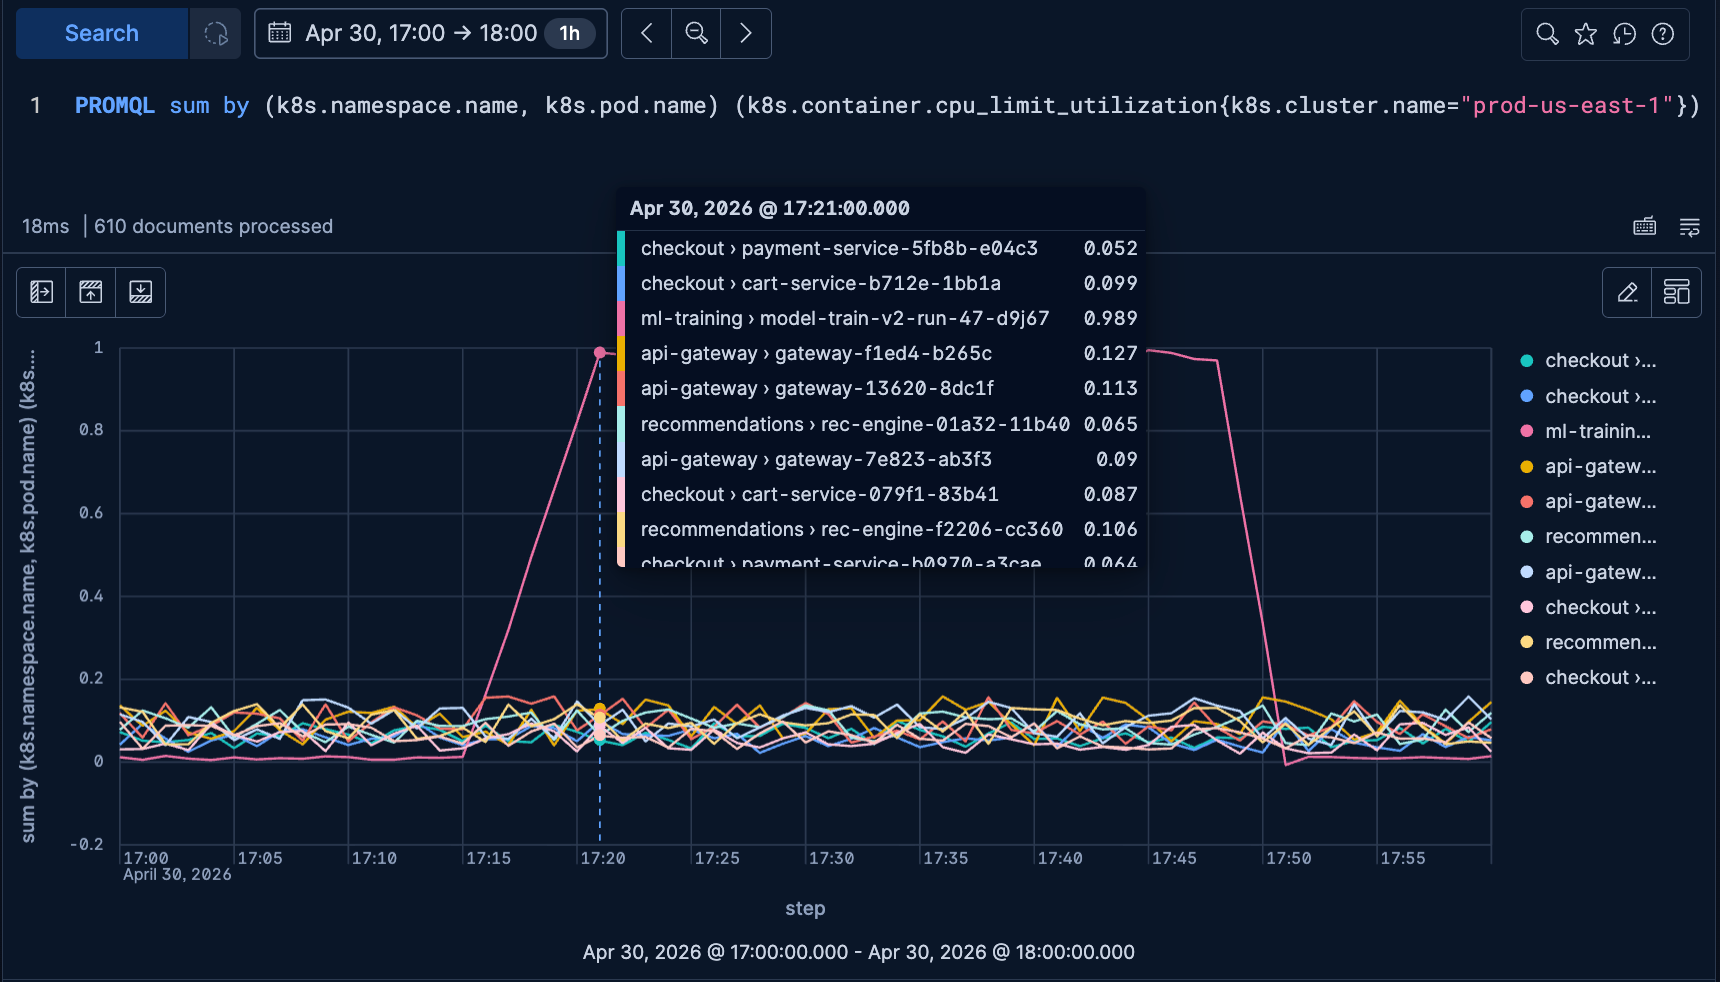
Investigate Kubernetes infrastructure issues with PromQL in Elasticsearch & Kibana
Walkthrough of a Kubernetes fleet-wide CPU investigation in Elastic Observability, from cluster to namespace to the noisy pod, using PromQL in Elasticsearch and Kibana.
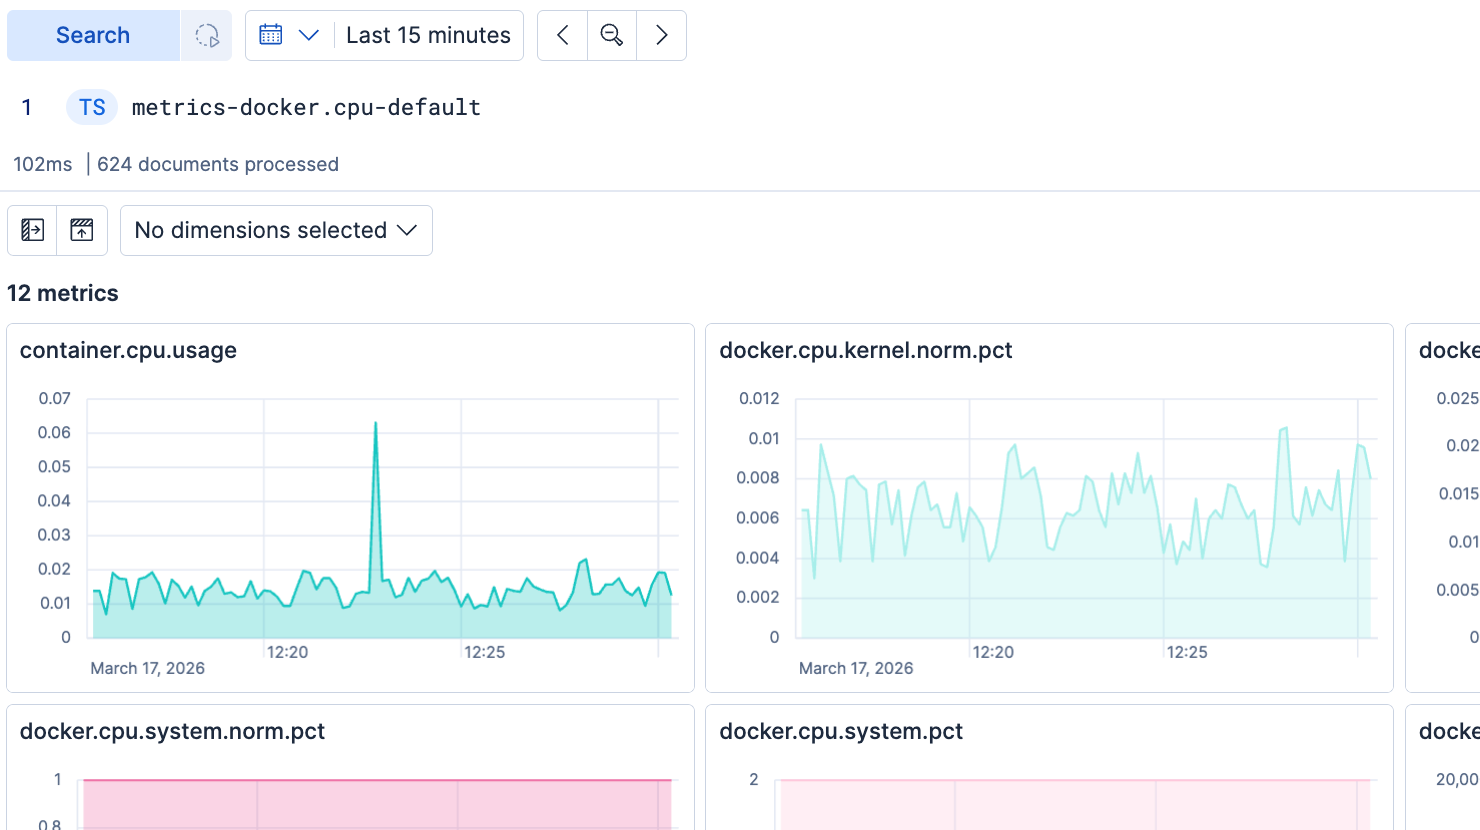
Exploring metrics from a new time series data stream in Discover
Discover helps you see and understand the metrics in a time series stream, with no manual work required. Once you see that your metrics data is flowing, you're ready to build dashboards, alerts, SLOs, and more.
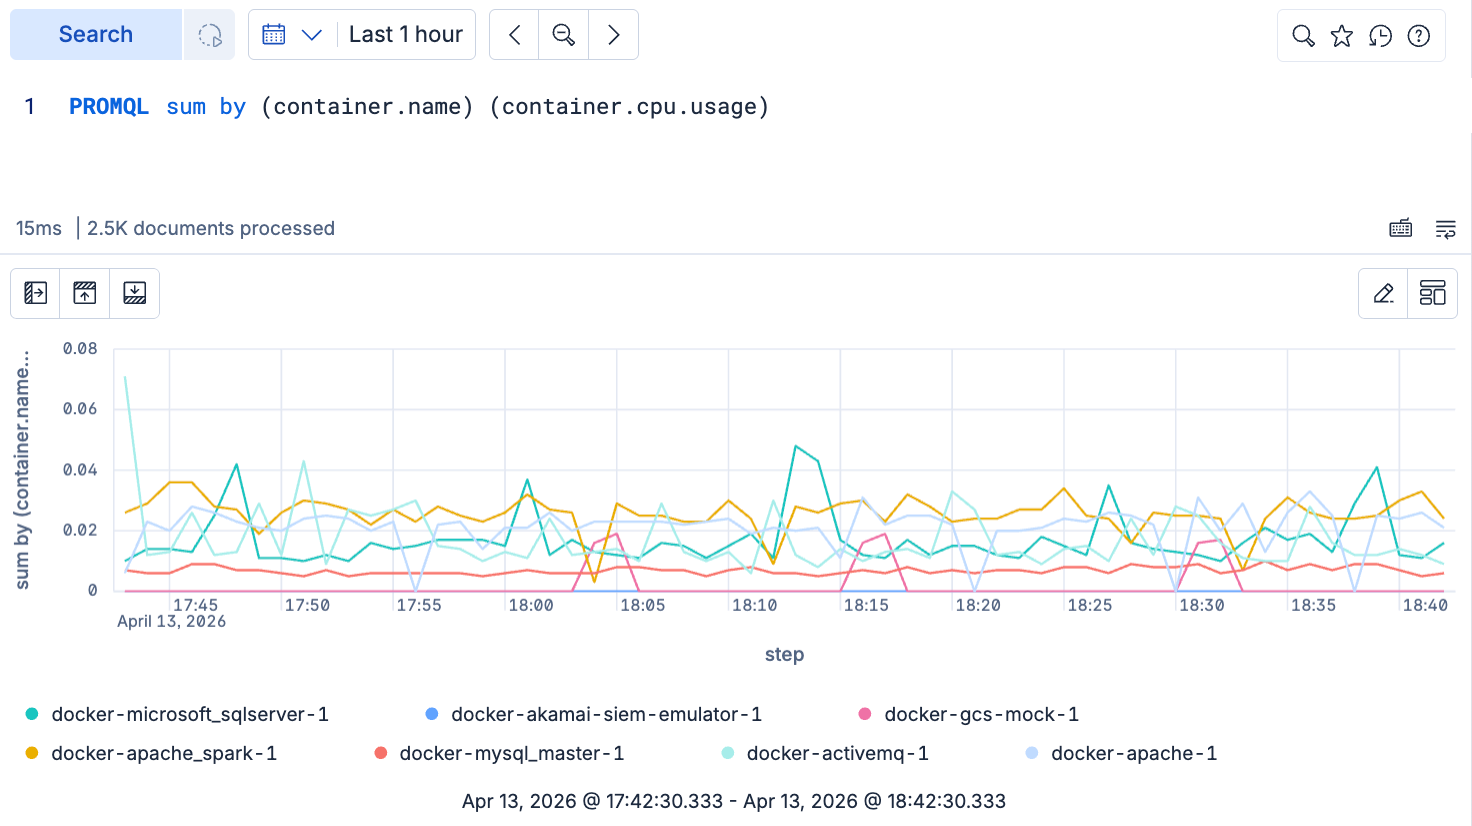
Your PromQL queries now run in Kibana!
With PromQL now natively supported in Kibana, write and execute PromQL for analyzing metrics in Discover, in Dashboards visualizations, in alerting rules and wherever else ES|QL is supported. PromQL is currently available in Tech Preview for common metrics analytics use cases.
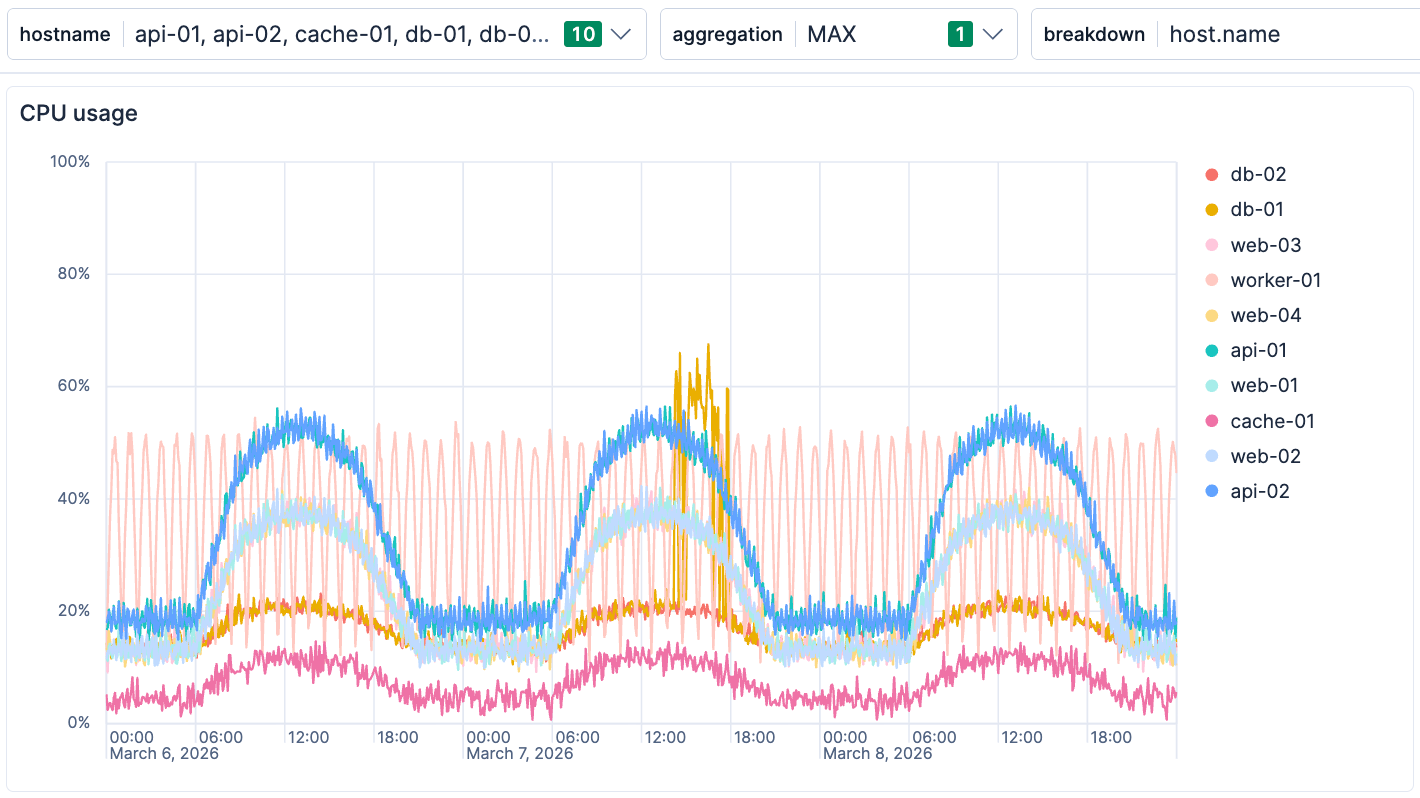
Turn Dashboards Into an Investigation Tool with ES|QL Variable Controls
Learn how to use ES|QL variables in Kibana to turn a dashboard into an investigation tool, applying value and structure controls to uncover problems.