
Meet the new Elastic Streams: Managed data pipelines for telemetry
Elastic’s new Streams gets you investigating in minutes by ingesting any data - structured or not - filtering, parsing, and enriching data with the option to even route it to your own storage end point, such as Amazon S3.
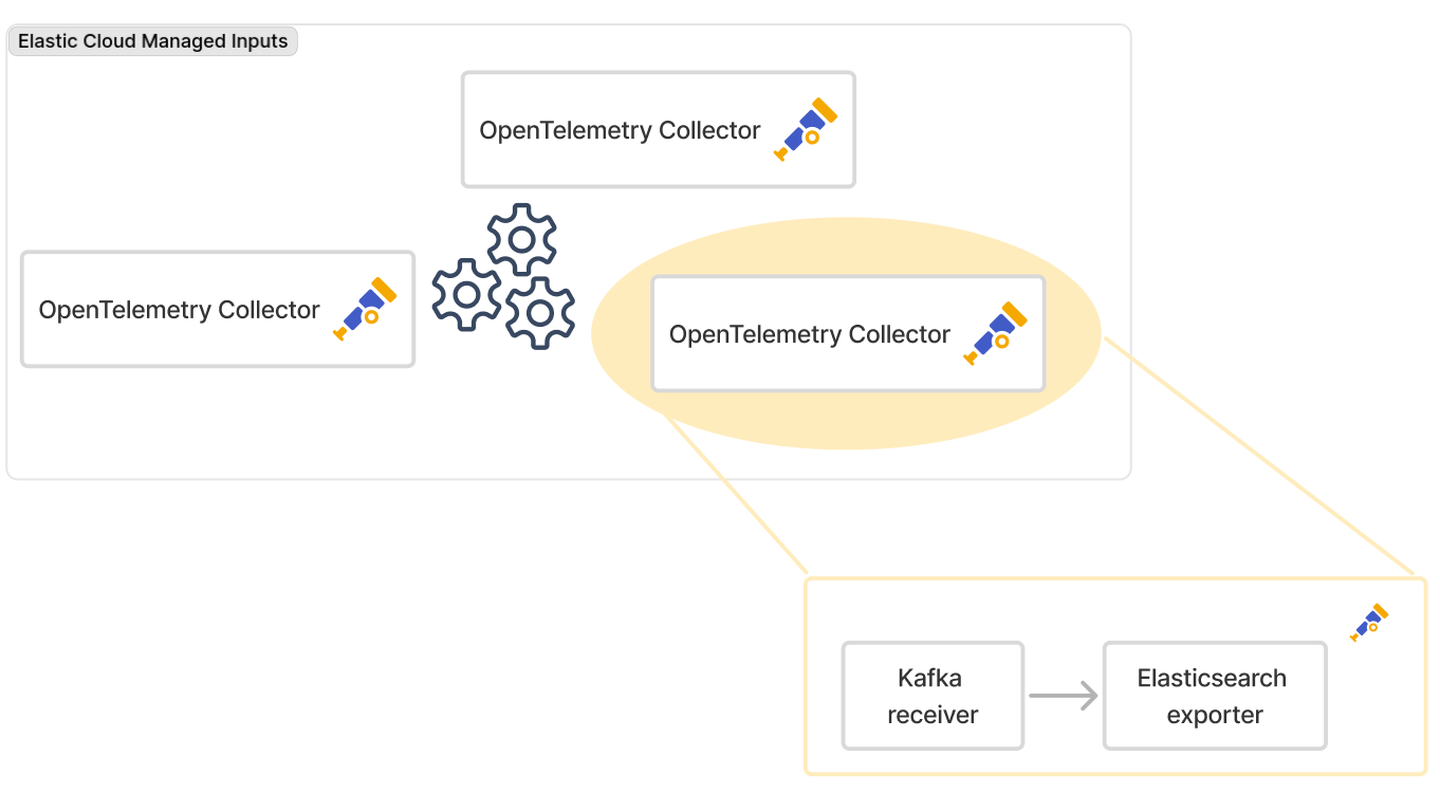
Two changes to the OpenTelemetry Kafka receiver that stop one slow tenant stalling the rest
Every Kafka partition now gets its own worker, and no tenant can take more than its share of the sending queue, so when one tenant's cluster is under load, only that tenant waits.
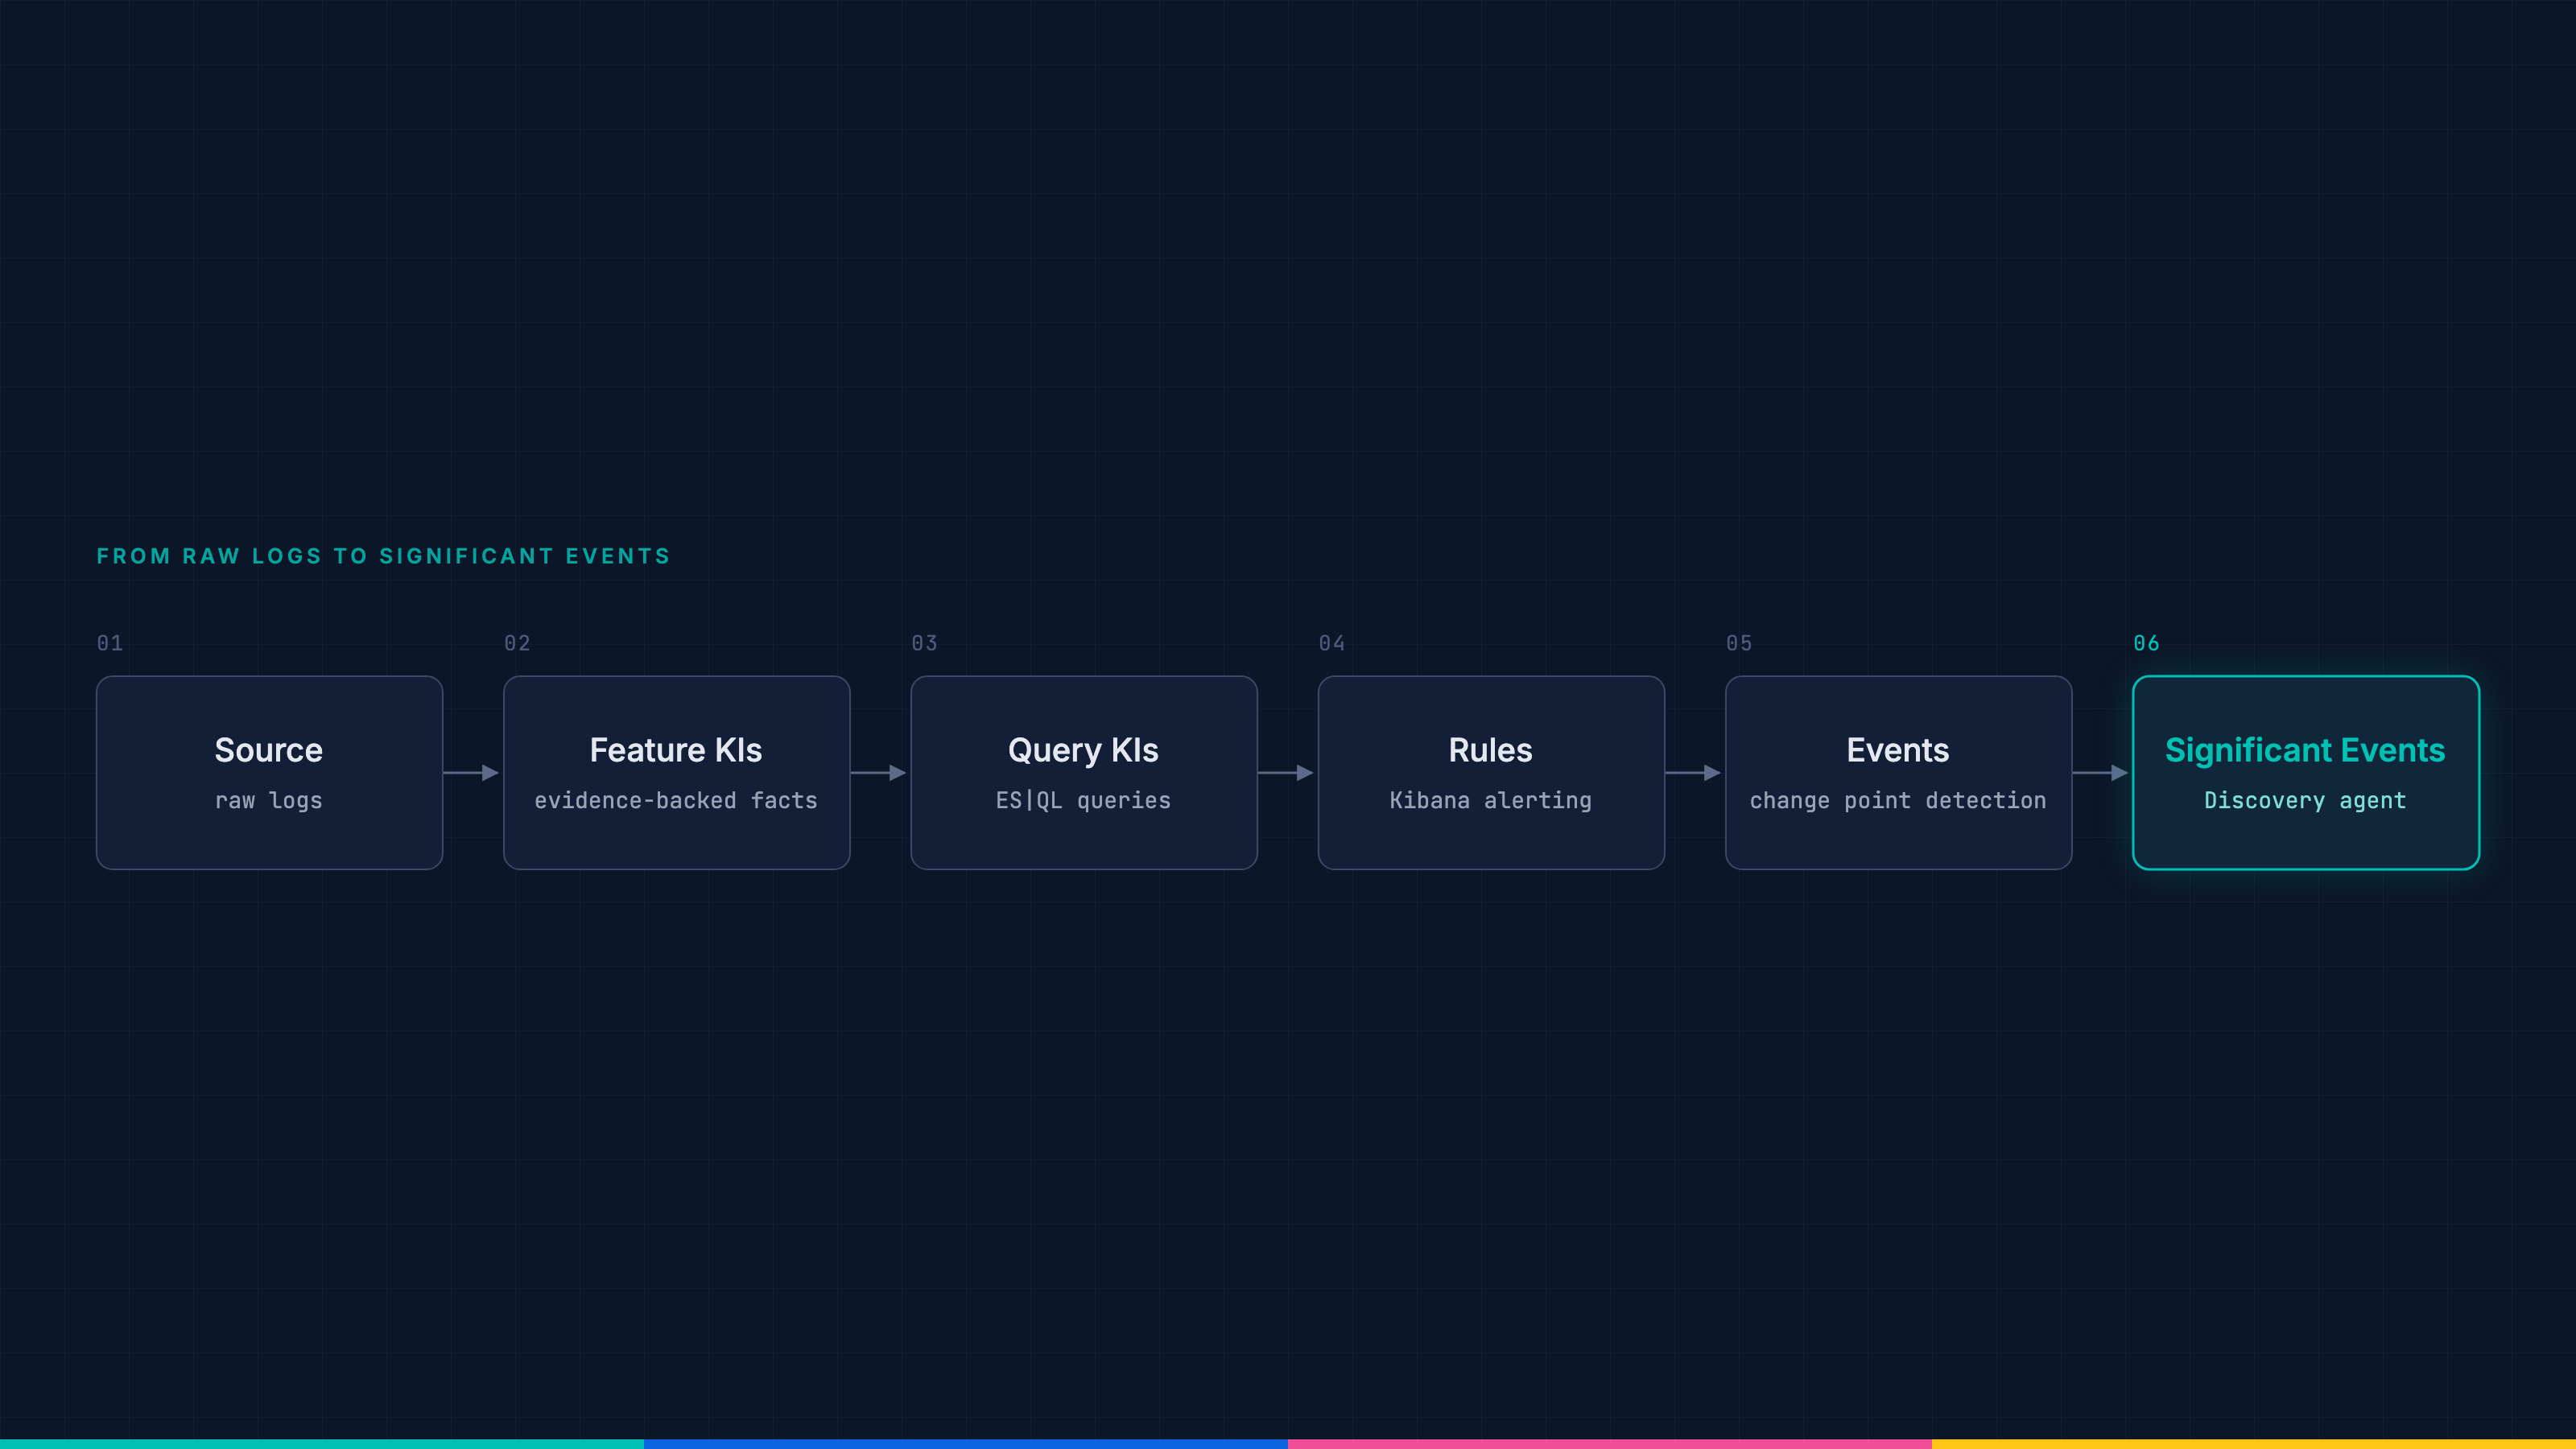
Two rules, one outage, one alert: How change point detection cuts alert noise
The discovery agent re-runs each firing rule’s own ES|QL query against the logs unchanged, so the alert names the unreachable service with the query that proves it.
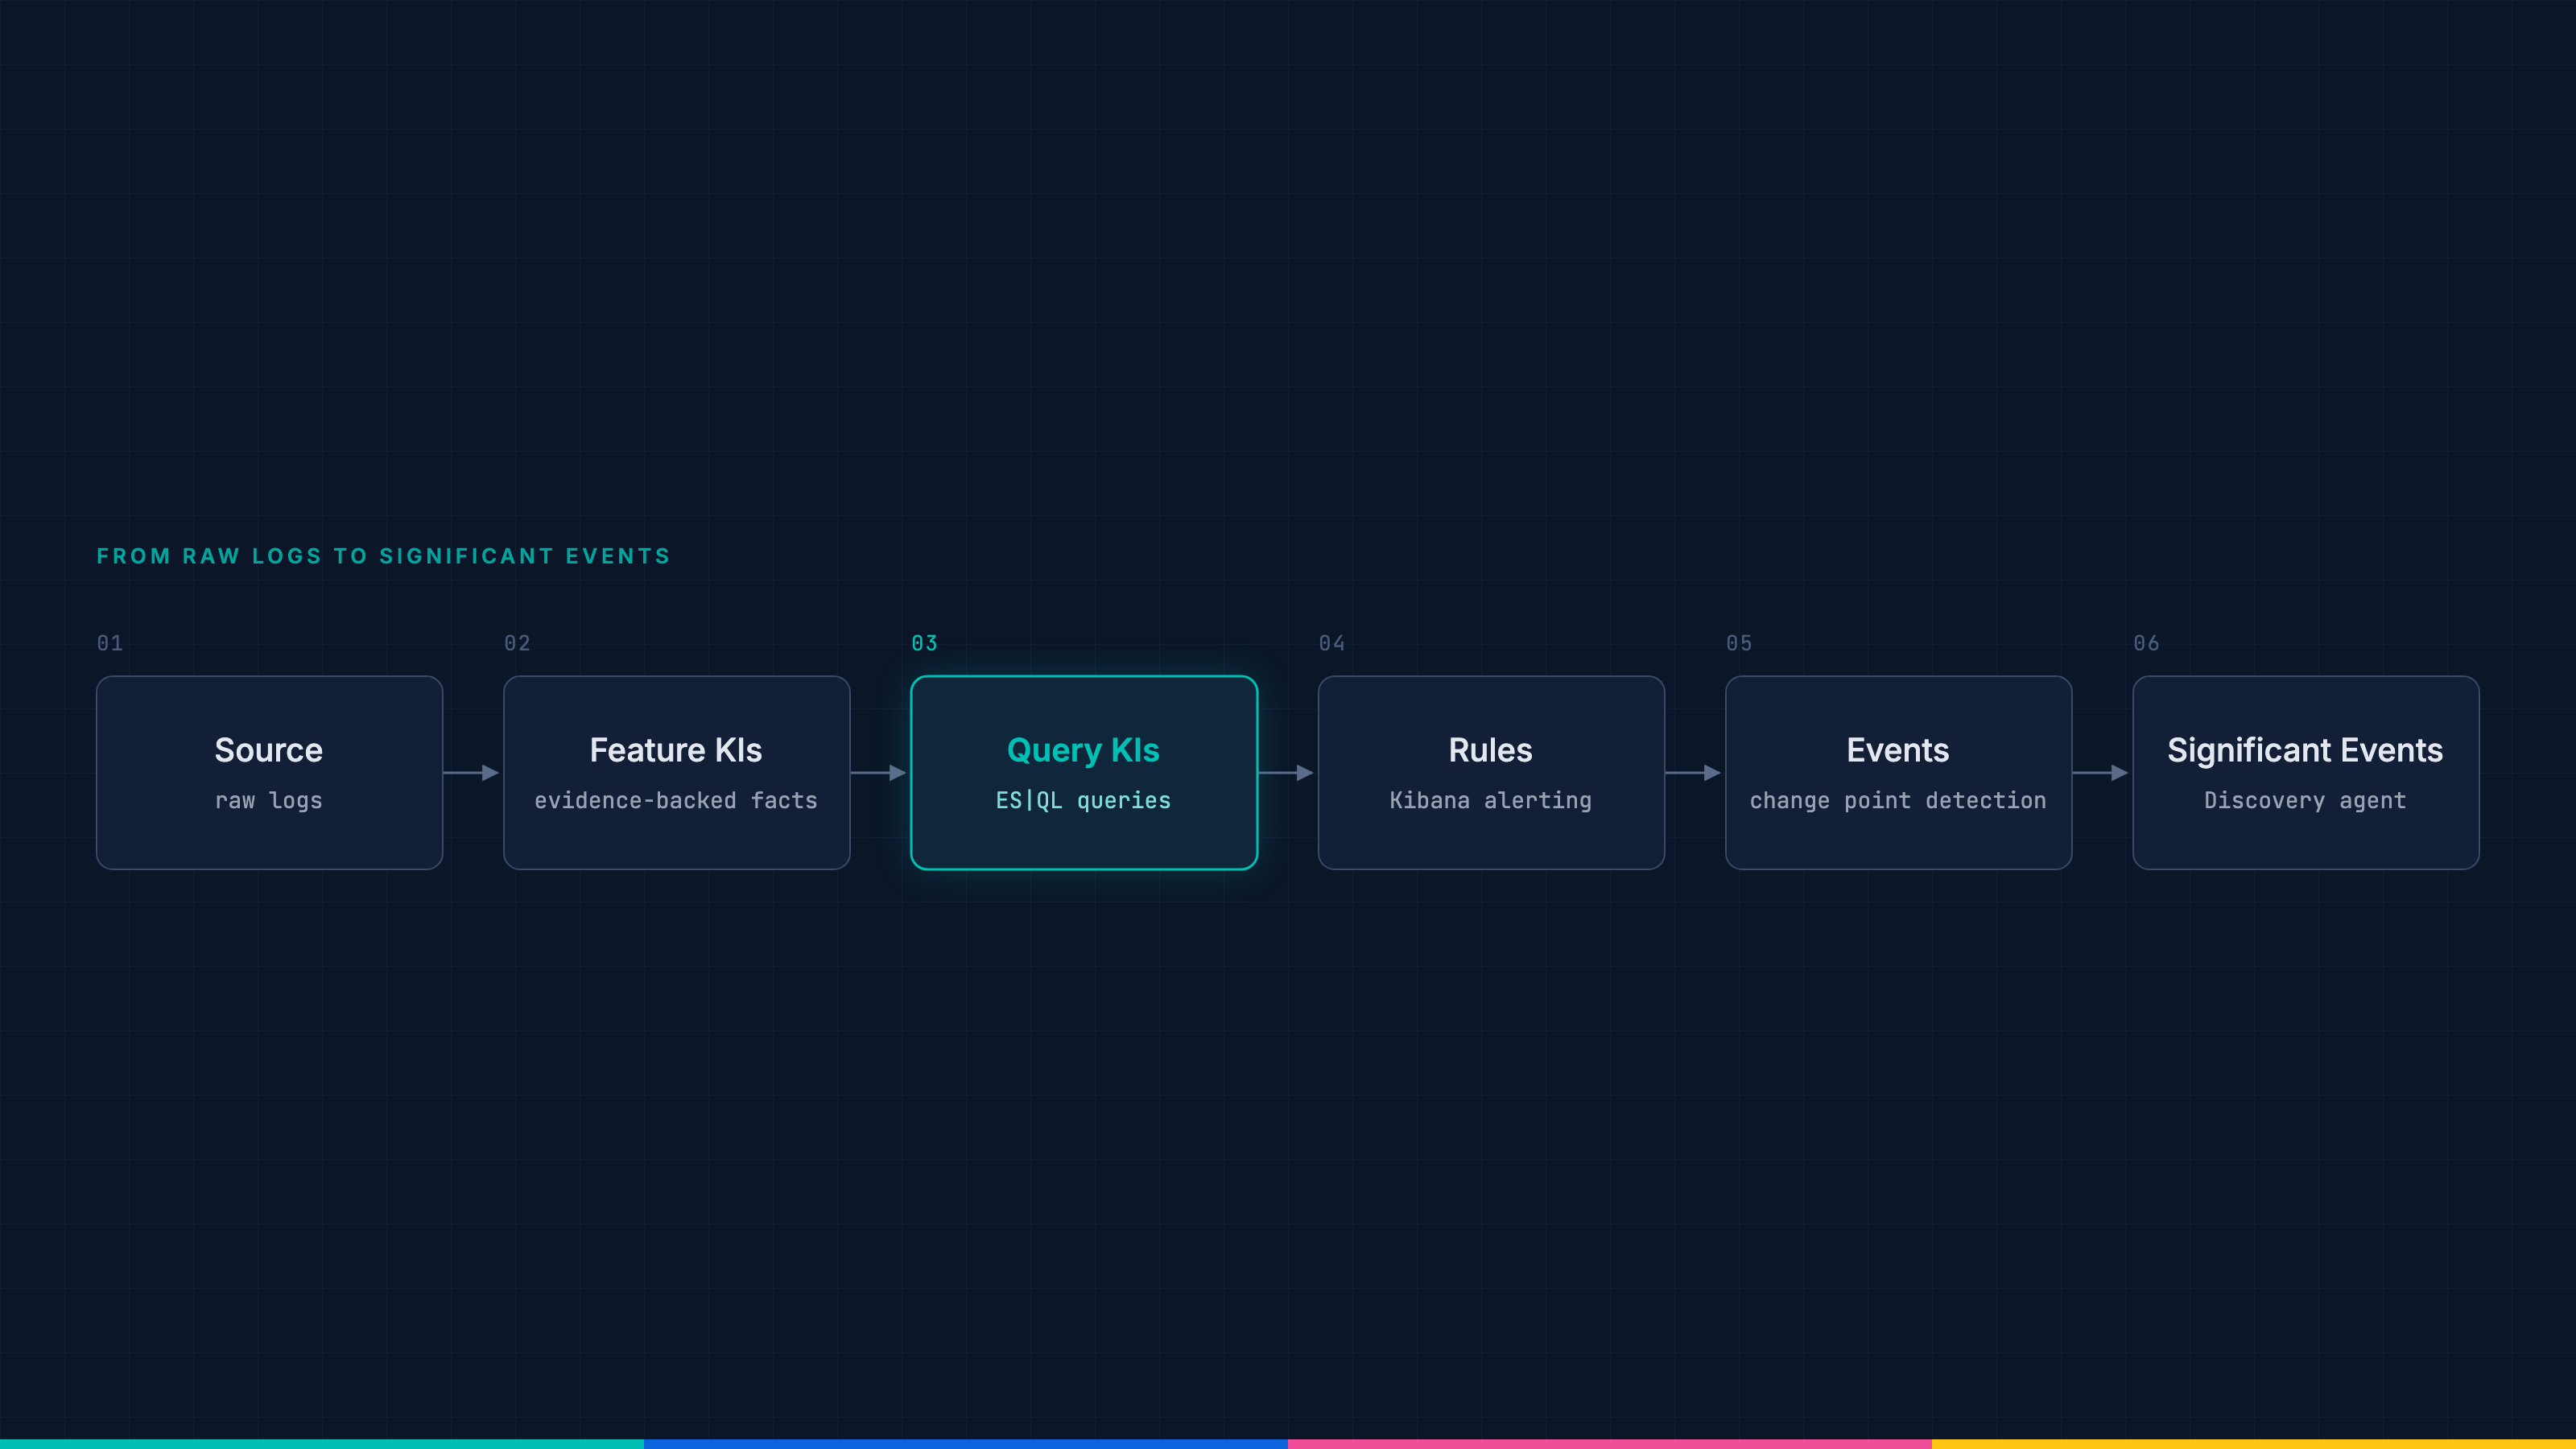
Your logs already wrote the alert: Generating ES|QL detection queries in Elasticsearch
On the OpenTelemetry demo, the top generated ES|QL detection query matches 0 documents while the shop is healthy and 676 during a payment outage.
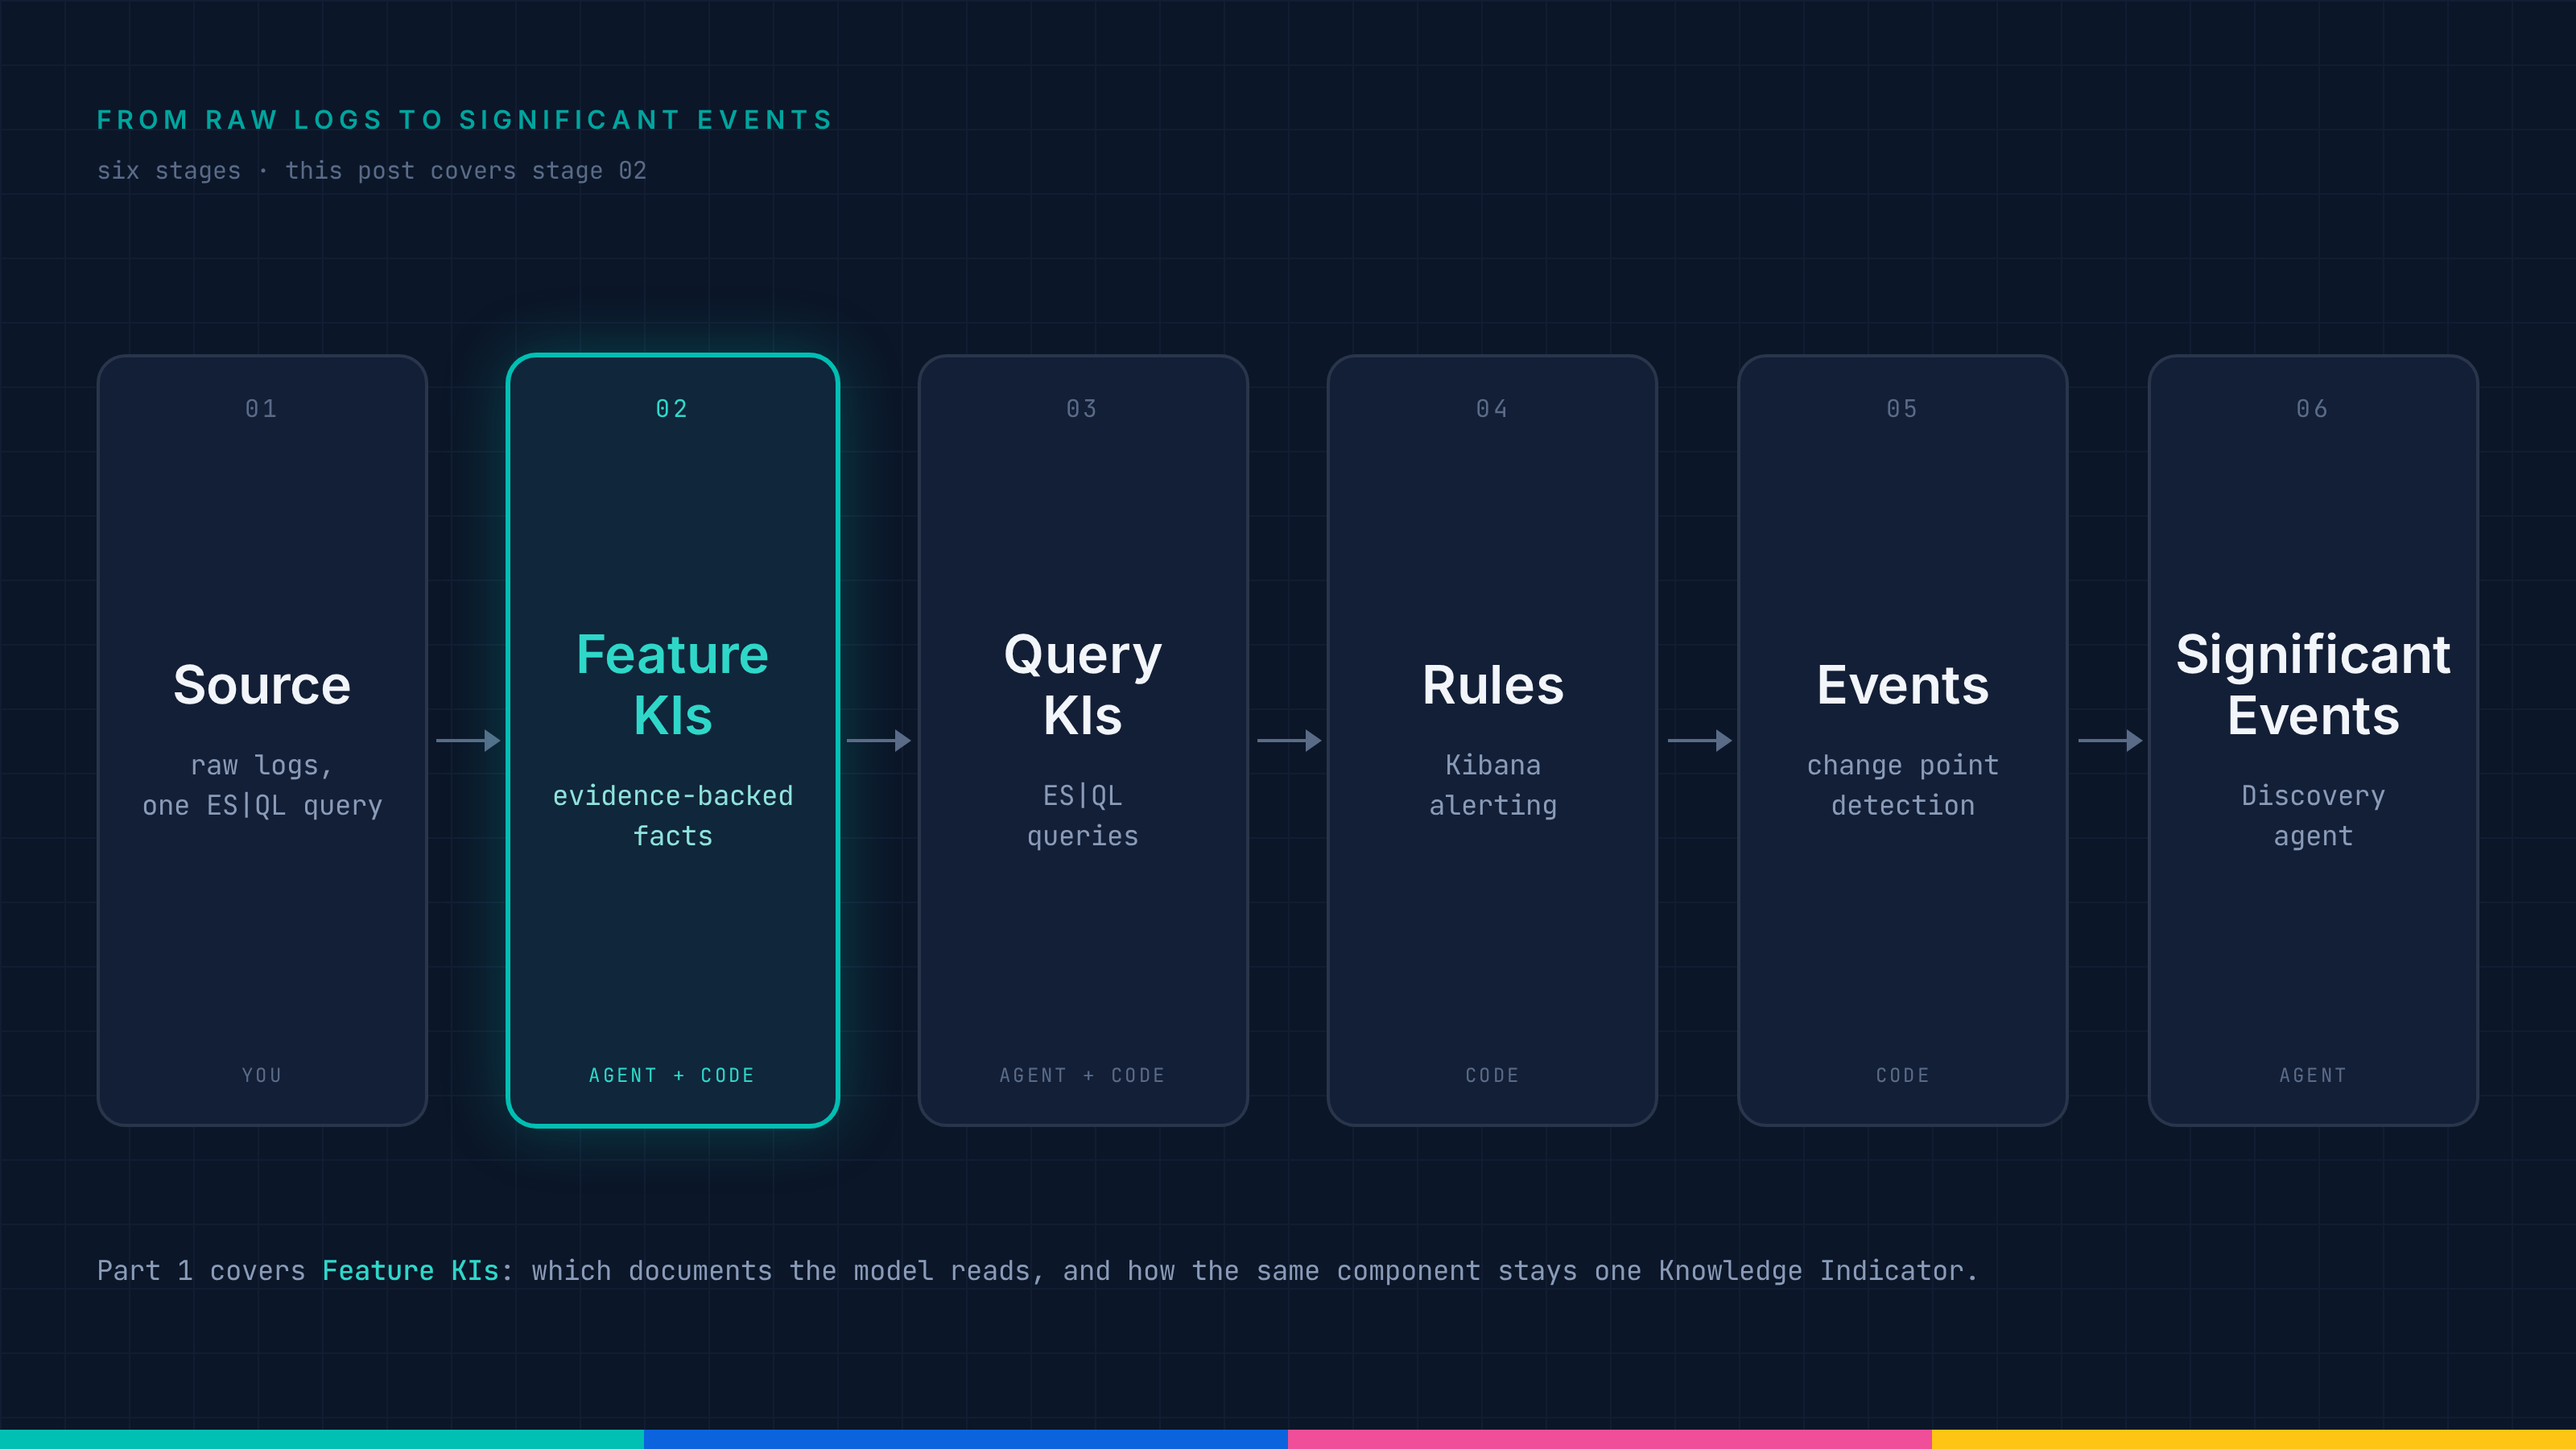
How Elastic Significant Events turns 100 log samples into detection rules
Pick the wrong 100 and you get `log.level: error`, a rule that fires on every request or finds nothing at all, and log sampling is what decides between them.

Three regions, three Kibanas, one view: Cross-cluster search comes to Elastic Synthetics
Monitors from every connected cluster appear in one Kibana, with journey waterfalls, screenshots, errors and certificates. Nothing is replicated, and each cluster still owns its monitors.

How we moved the OpenTelemetry Java agent to invokedynamic in 70+ pull requests
We did the same migration twice, three years apart, and the second time there were a hundred contributors instead of three. What changes when you rebuild how a Java agent instruments code and nothing in production is allowed to break.

Control how alerts activate, recover and notify: Kibana Universal Alerting in Elastic Observability
Turn ES|QL queries into alert data using Kibana Universal Alerting, and triage Classic and external alerts alongside Universal alerts in a single view.

YAML meets IConfiguration: Declarative configuration for the OpenTelemetry .NET SDK
You can change sampling without shipping a new build, because the first declarative configuration package parses YAML into a typed model and projects it into the flat keys the OpenTelemetry .NET SDK already reads.
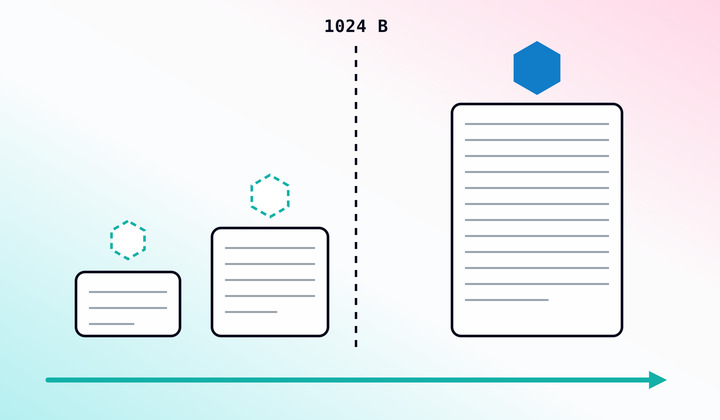
No log file too small: How Elastic Agent tracks files below the 1 KiB threshold
Elastic Agent 9.5 builds a small log file's identity out of the bytes it already has, then re-links it as it grows and crosses 1024 bytes, so it is never re-ingested.

Telemetry Policy: change OpenTelemetry sampling and log levels at runtime, no restart
Telemetry Policy says what you want to happen and leaves each component to work out how. Change an OpenTelemetry Java agent's trace sampling to 1% and the JVM keeps serving traffic.
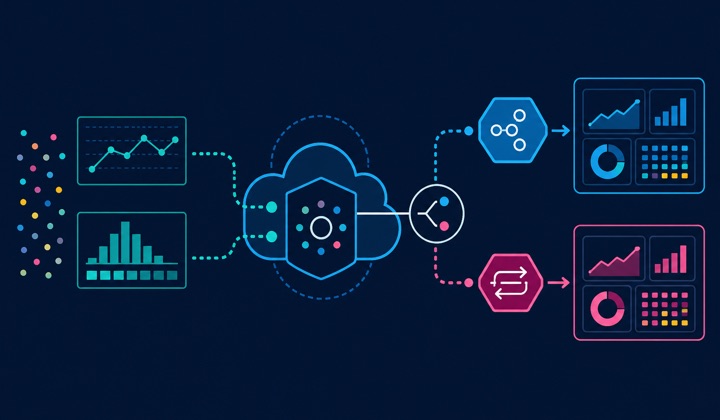
Native OTLP metrics ingestion on Elastic Cloud Hosted
Send an exponential OpenTelemetry histogram and Elasticsearch keeps the scale and buckets you sent. All four type and temporality combinations work now, and your SDK and Collector config stay exactly as they are.