Elastic Observability 8.8: Efficient operations with GitOps-based synthetics monitoring and direct AWS Firehose ingest


 Share on Twitter
Share on Twitter

 Share on LinkedIn
Share on LinkedIn

 Share on Facebook
Share on Facebook

 Share by Email
Share by Email

 Print this page
Print
Elastic Observability 8.8 introduces the general availability release of synthetic monitoring with GitOps integration, the ability to ingest data directly to Elastic Cloud from Amazon Kinesis Firehose without an agent, and new beta capabilities for managing service level objectives to help improve customer experiences and drive efficient operations.
These new features allow customers to:
- Manage their customers’ web experience with a global managed synthetics monitoring test service
- Manage synthetics tests using CI/CD and GitOps optimized workflows
- Simplify log aggregation by collecting AWS logs via a direct ingest from Kinesis Data Firehose without deploying an Elastic agent
- Set and manage clear and measurable targets for application service levels
Elastic Observability 8.8 is available now on Elastic Cloud — the only hosted Elasticsearch offering to include all of the new features in this latest release. You can also download the Elastic Stack and our cloud orchestration products, Elastic Cloud Enterprise and Elastic Cloud for Kubernetes, for a self-managed experience.
What else is new in Elastic 8.8? Check out the 8.8 announcement post to learn more.
The future of synthetic monitoring is here
We are thrilled to announce the general availability of our reimagined synthetic monitoring solution, now incorporated into the Elastic Observability suite. Our cutting-edge product combines traditional features with innovative new tools, radically improving the way you design and manage your synthetic monitors.
As you read through the next few sections, you can also look at these additional resources:
- Intro to synthetic monitoring on Elastic
- How to create a CI/CD pipeline with GitHub actions and Elastic synthetic monitoring tests
- Creating end to end synthetics monitoring tests
- Playwright (what Elastic uses for synthetic monitoring tests)
- Elastic’s NPM library for synthetics monitoring test development
GitOps-based synthetics monitoring
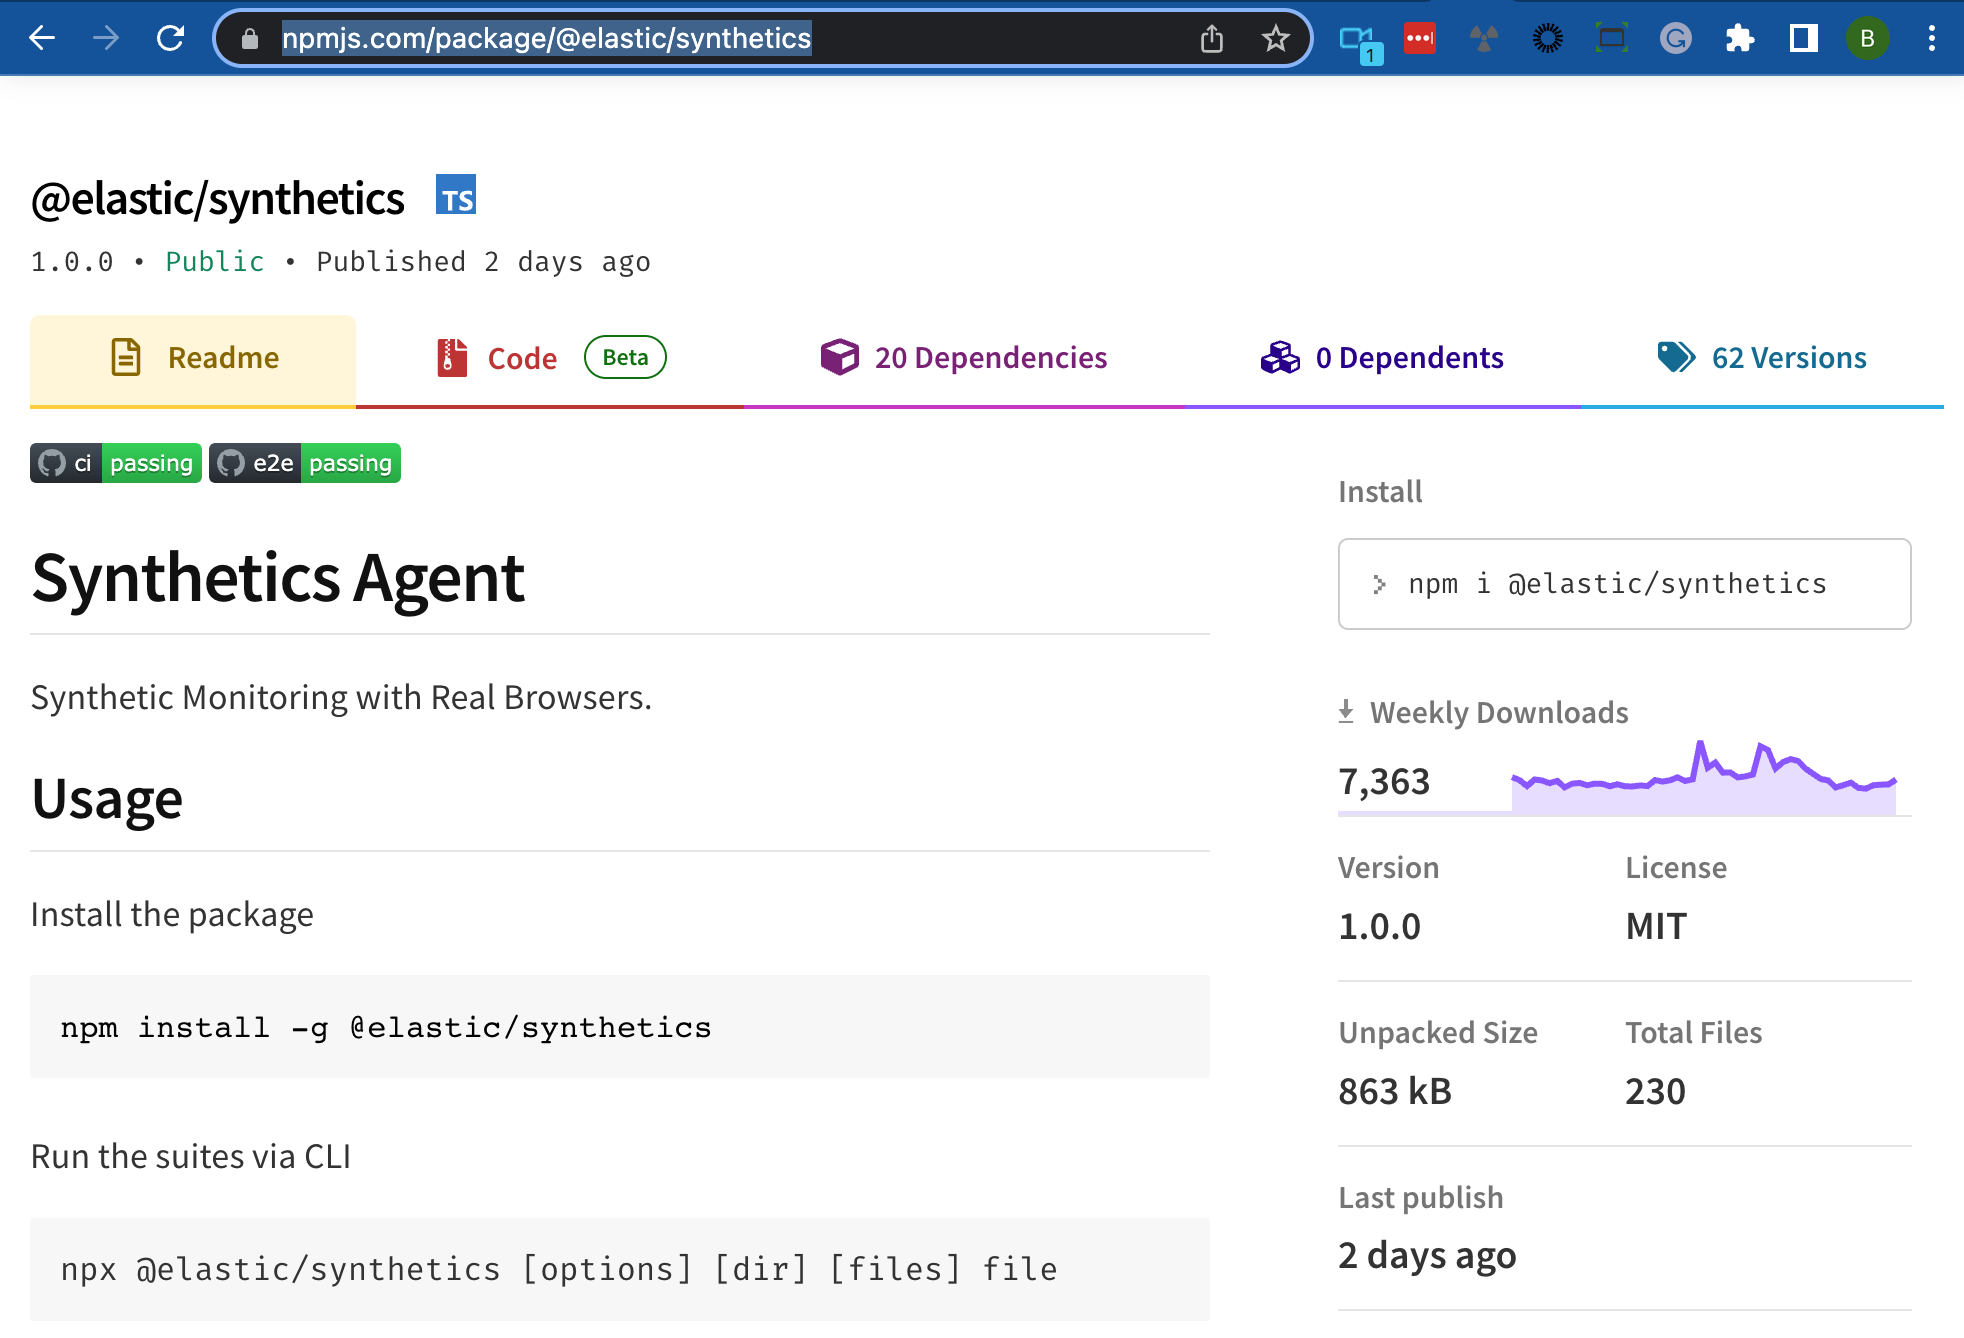
With the availability of @elastic/synthetics, we've revolutionized synthetic monitoring for developers with our CI/CD and GitOps optimization, allowing functional tests, which use Playwright, to be transformed into monitors when releasing to production. See how to manage your website with git in our latest blog.
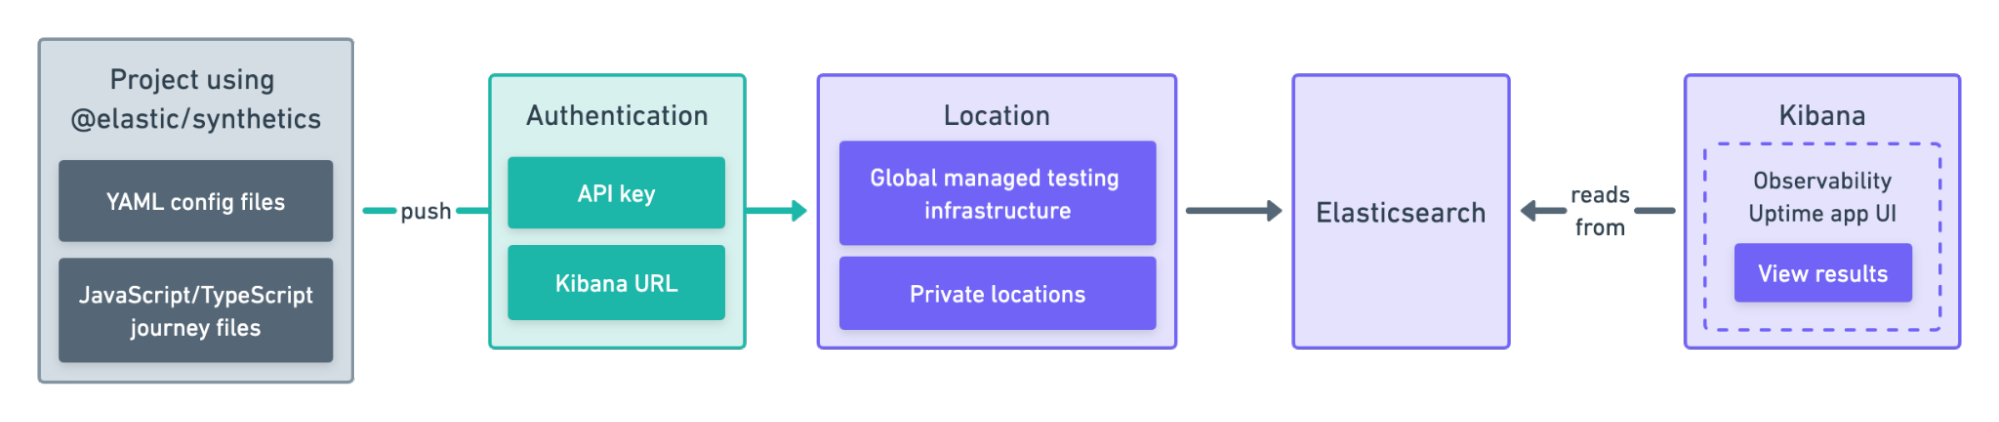
Global managed testing infrastructure
A newly available global managed testing infrastructure, you can schedule tests from a network of agents worldwide, providing a clear perspective on regional discrepancies, all while we handle the management of your synthetic monitoring testing infrastructure.
Building tests for Elastic synthetic monitoring
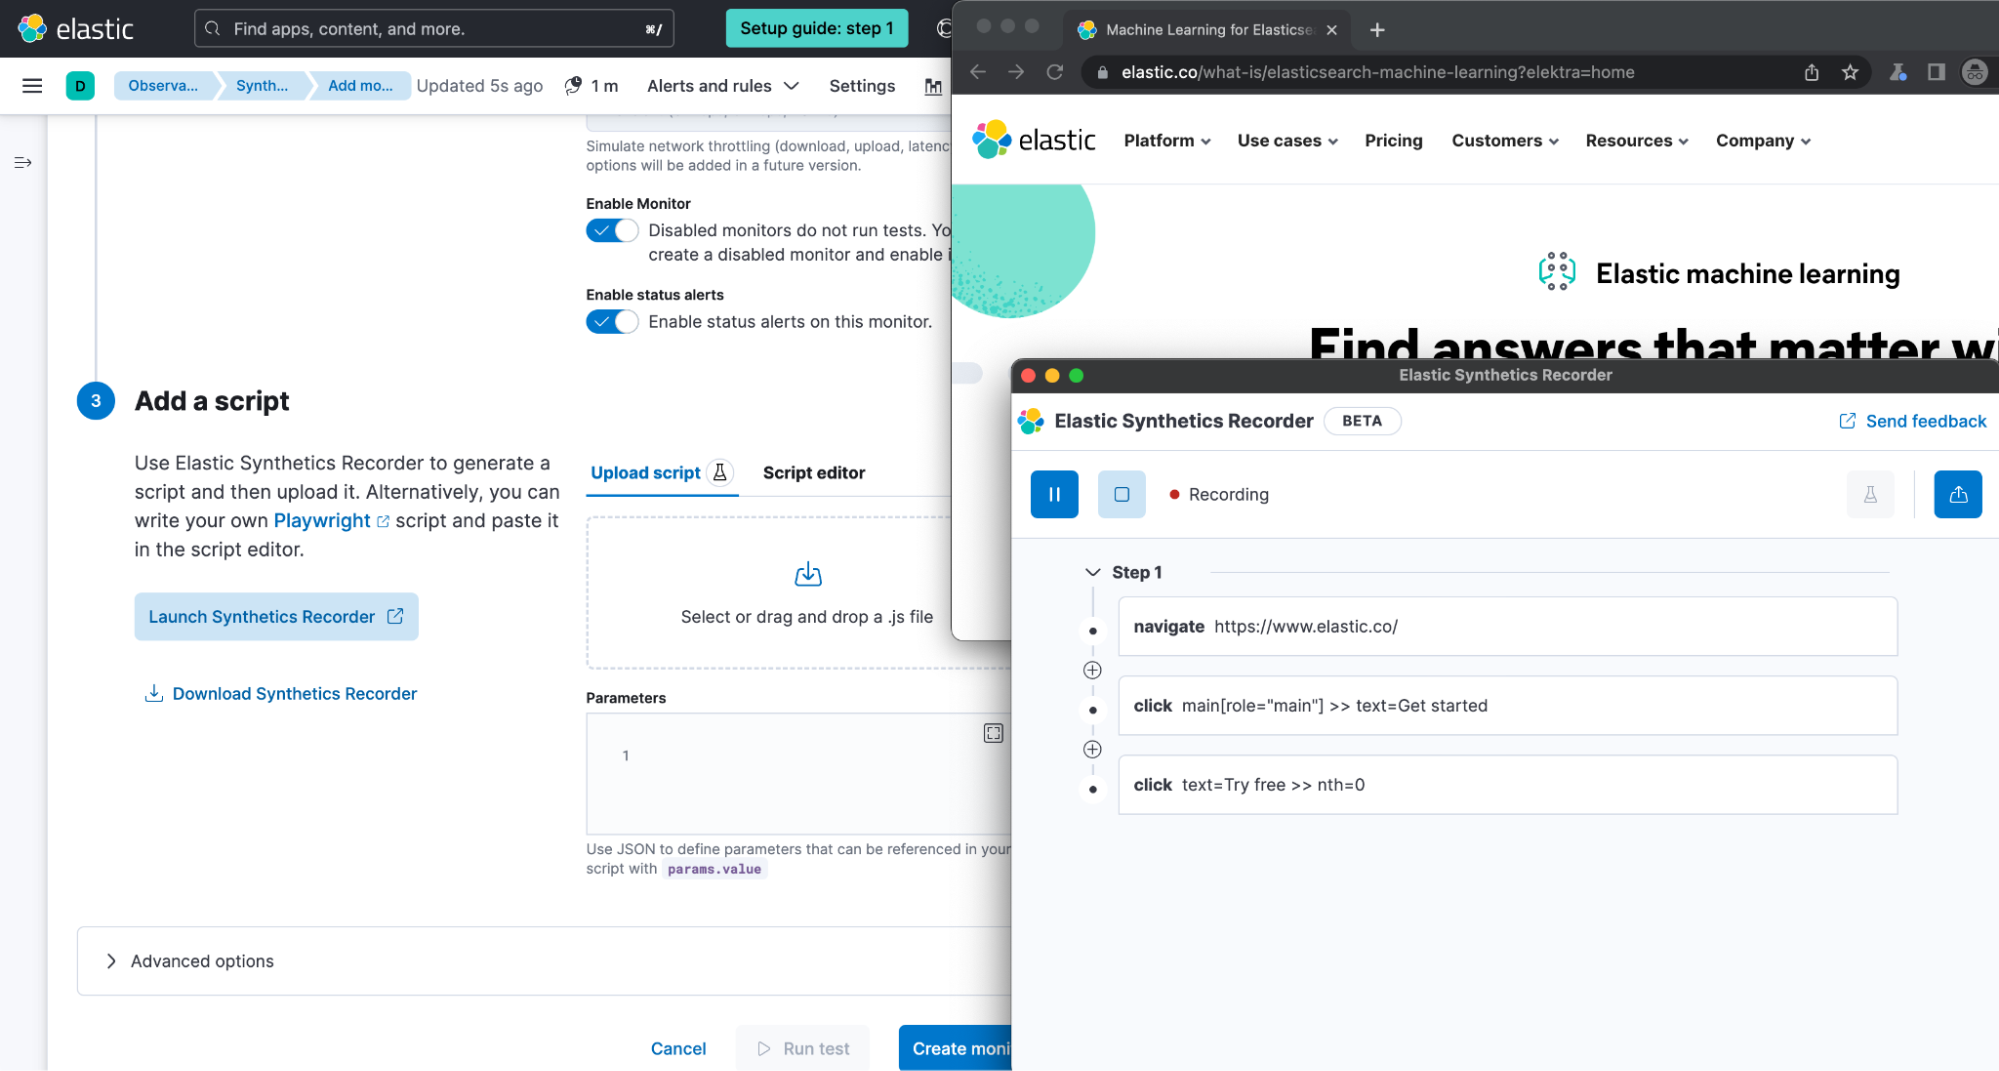
With Elastic 8.8, you have two options to build out test scripts.
1. Use Playwright to build scripts and manage with git.
import { journey, step, monitor, expect, before } from '@elastic/synthetics';

journey('Replicator Order Journey', ({ page, params }) => {
  // Only relevant for the push command to create
  // monitors in Kibana
  monitor.use({
    id: 'synthetics-replicator-monitor',
    schedule: 10,
});2. Use the available point-and-click script recorder — even non-technical users can create a synthetic monitor easily and quickly, while also providing developers with a framework to expedite the creation of monitoring scripts.
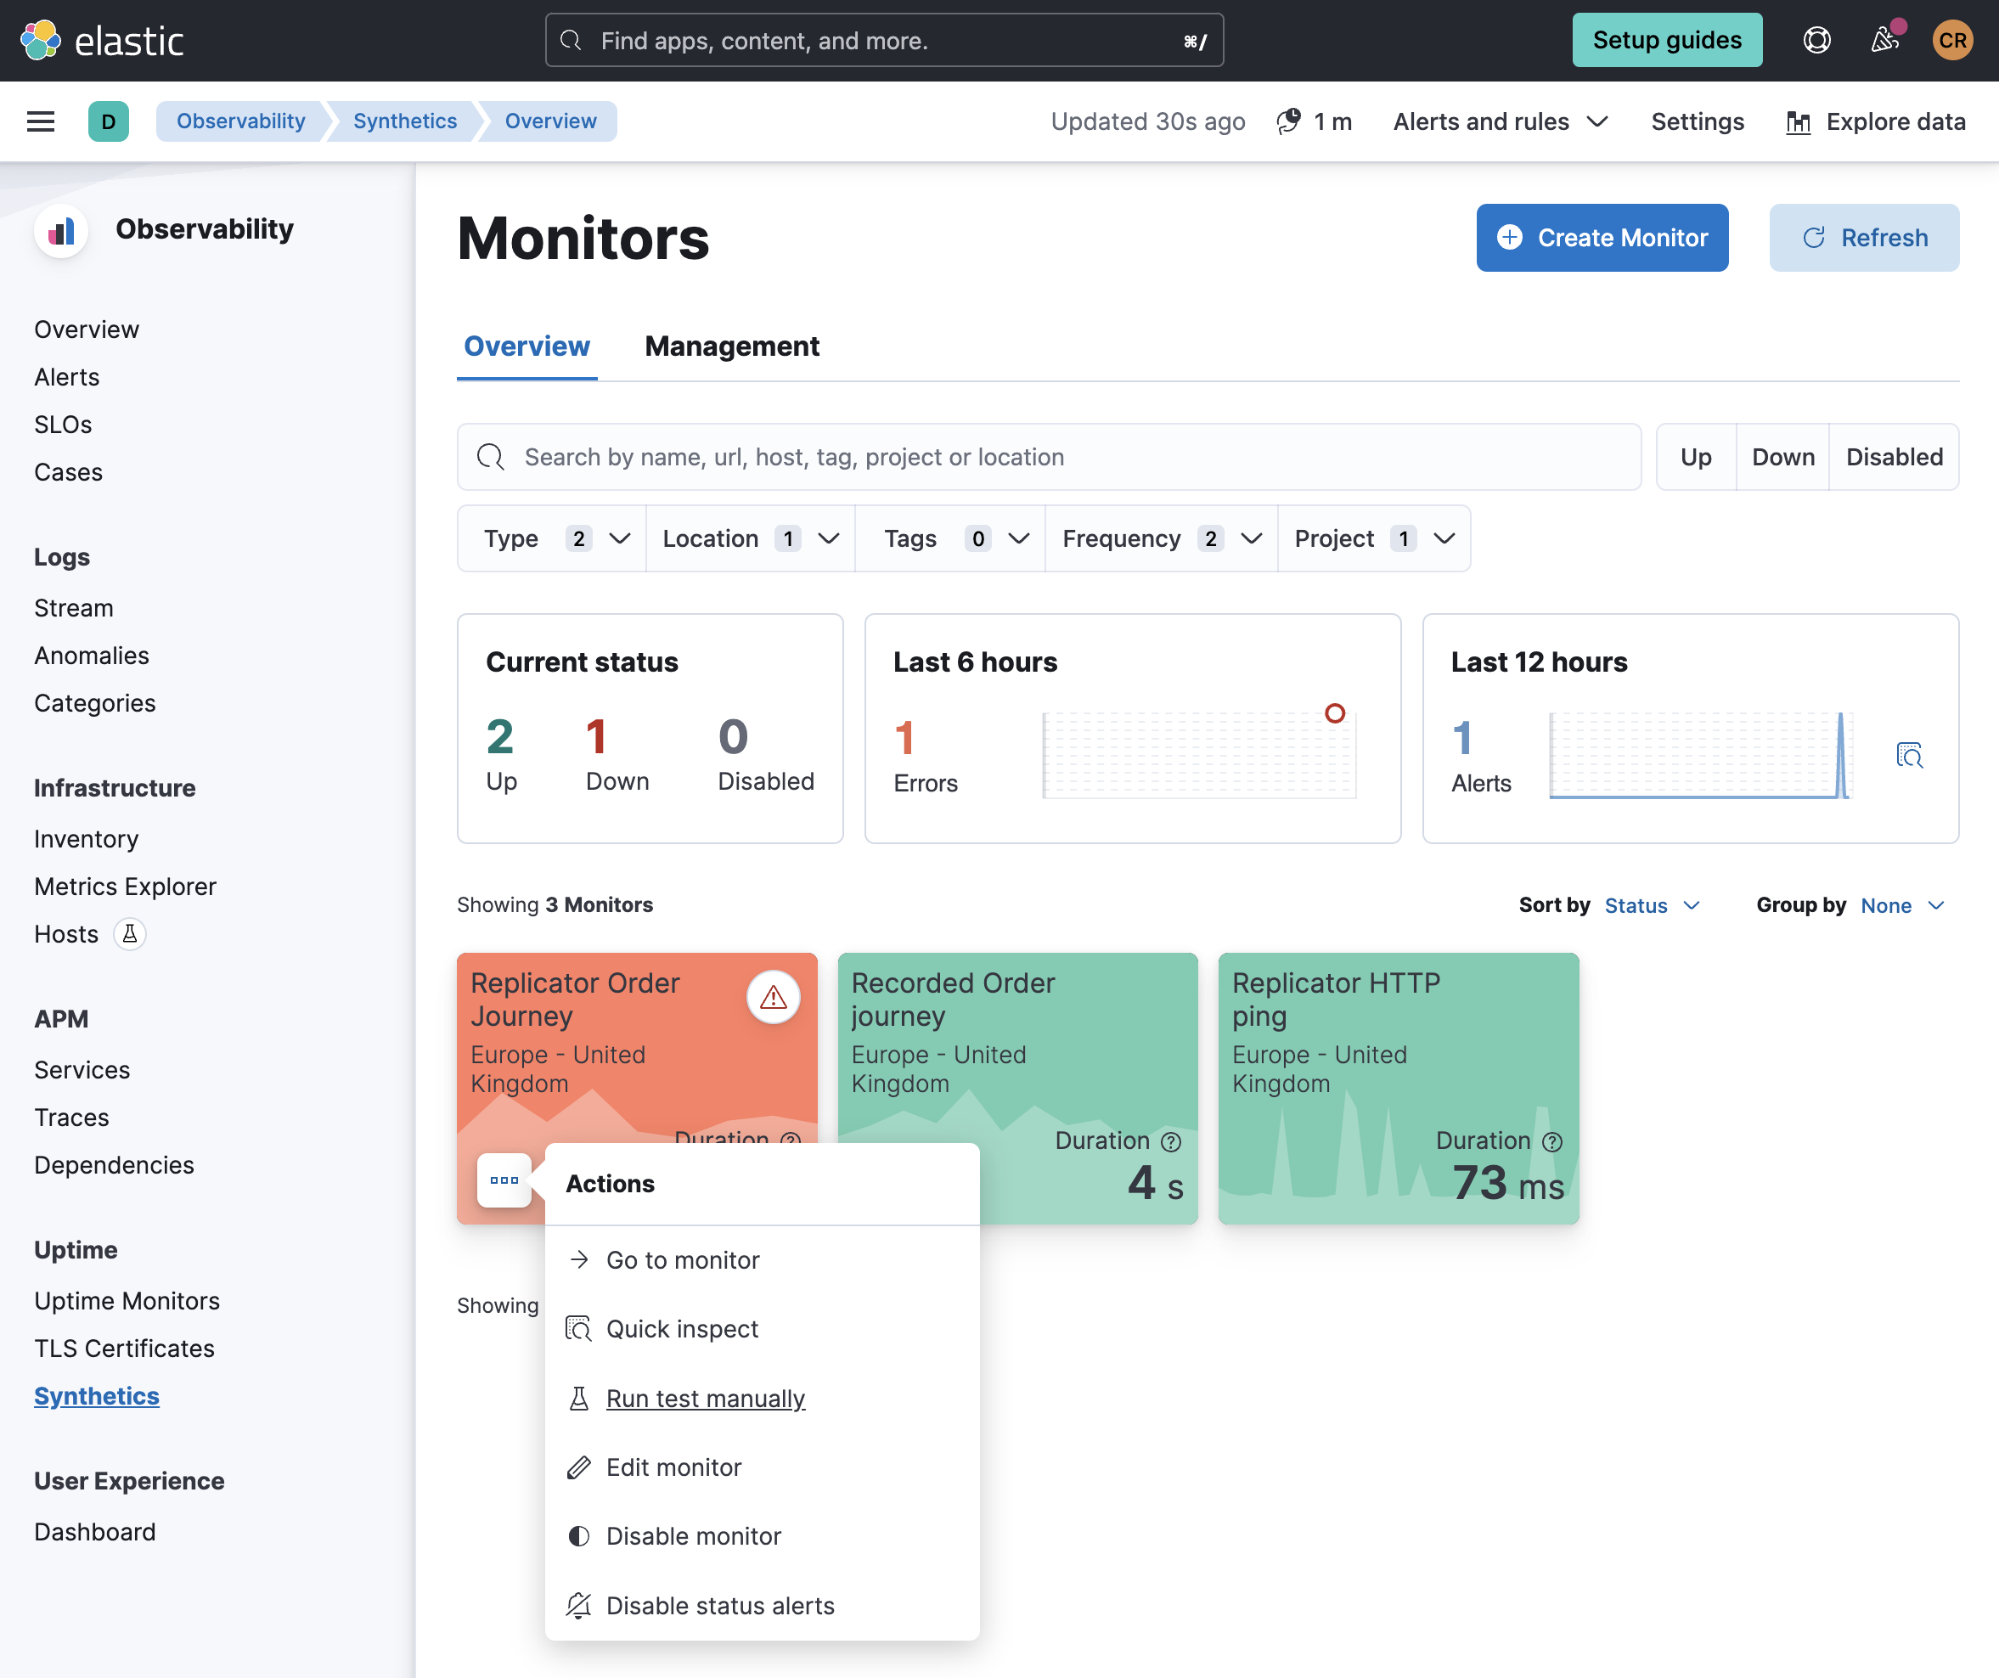
Easy to use UI
Our redefined synthetic monitoring experience includes a brand new user interface (UI), optimized for swift answers to support SREs and developers in spotting and troubleshooting production issues.
All these features aim to provide a comprehensive and seamless synthetic monitoring experience. We're excited to see how these capabilities will transform your application performance monitoring endeavors.
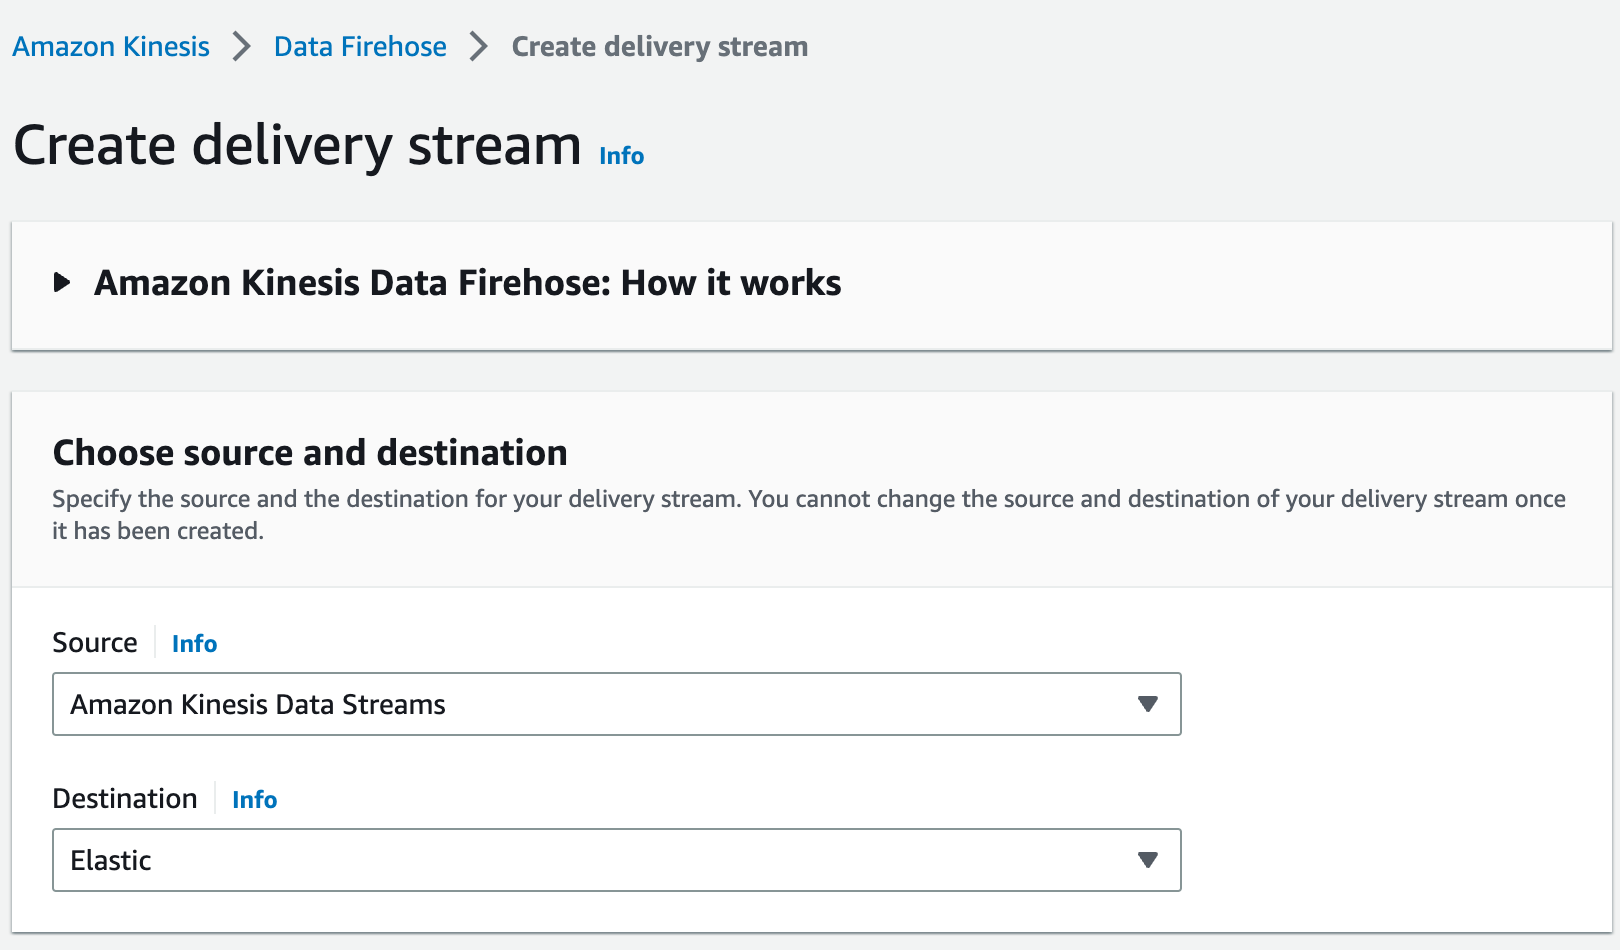
Accelerate data analytics with Elastic and Amazon Kinesis Data Firehose
Amazon Kinesis Data Firehose is a fully managed AWS service for delivering real-time streaming data to destinations such as Elastic.
Amazon Kinesis Data Firehose now supports direct streaming into Elastic in the AWS console.
As you read through the details, you can also look at these additional resources:
- Managing VPC Flow logs from AWS via AWS Firehose into Elastic cloud (AWS Blog version)
- Elastic documentation on setting up
- AWS documentation on Amazon Kinesis Data Firehose’s Elastic destination option
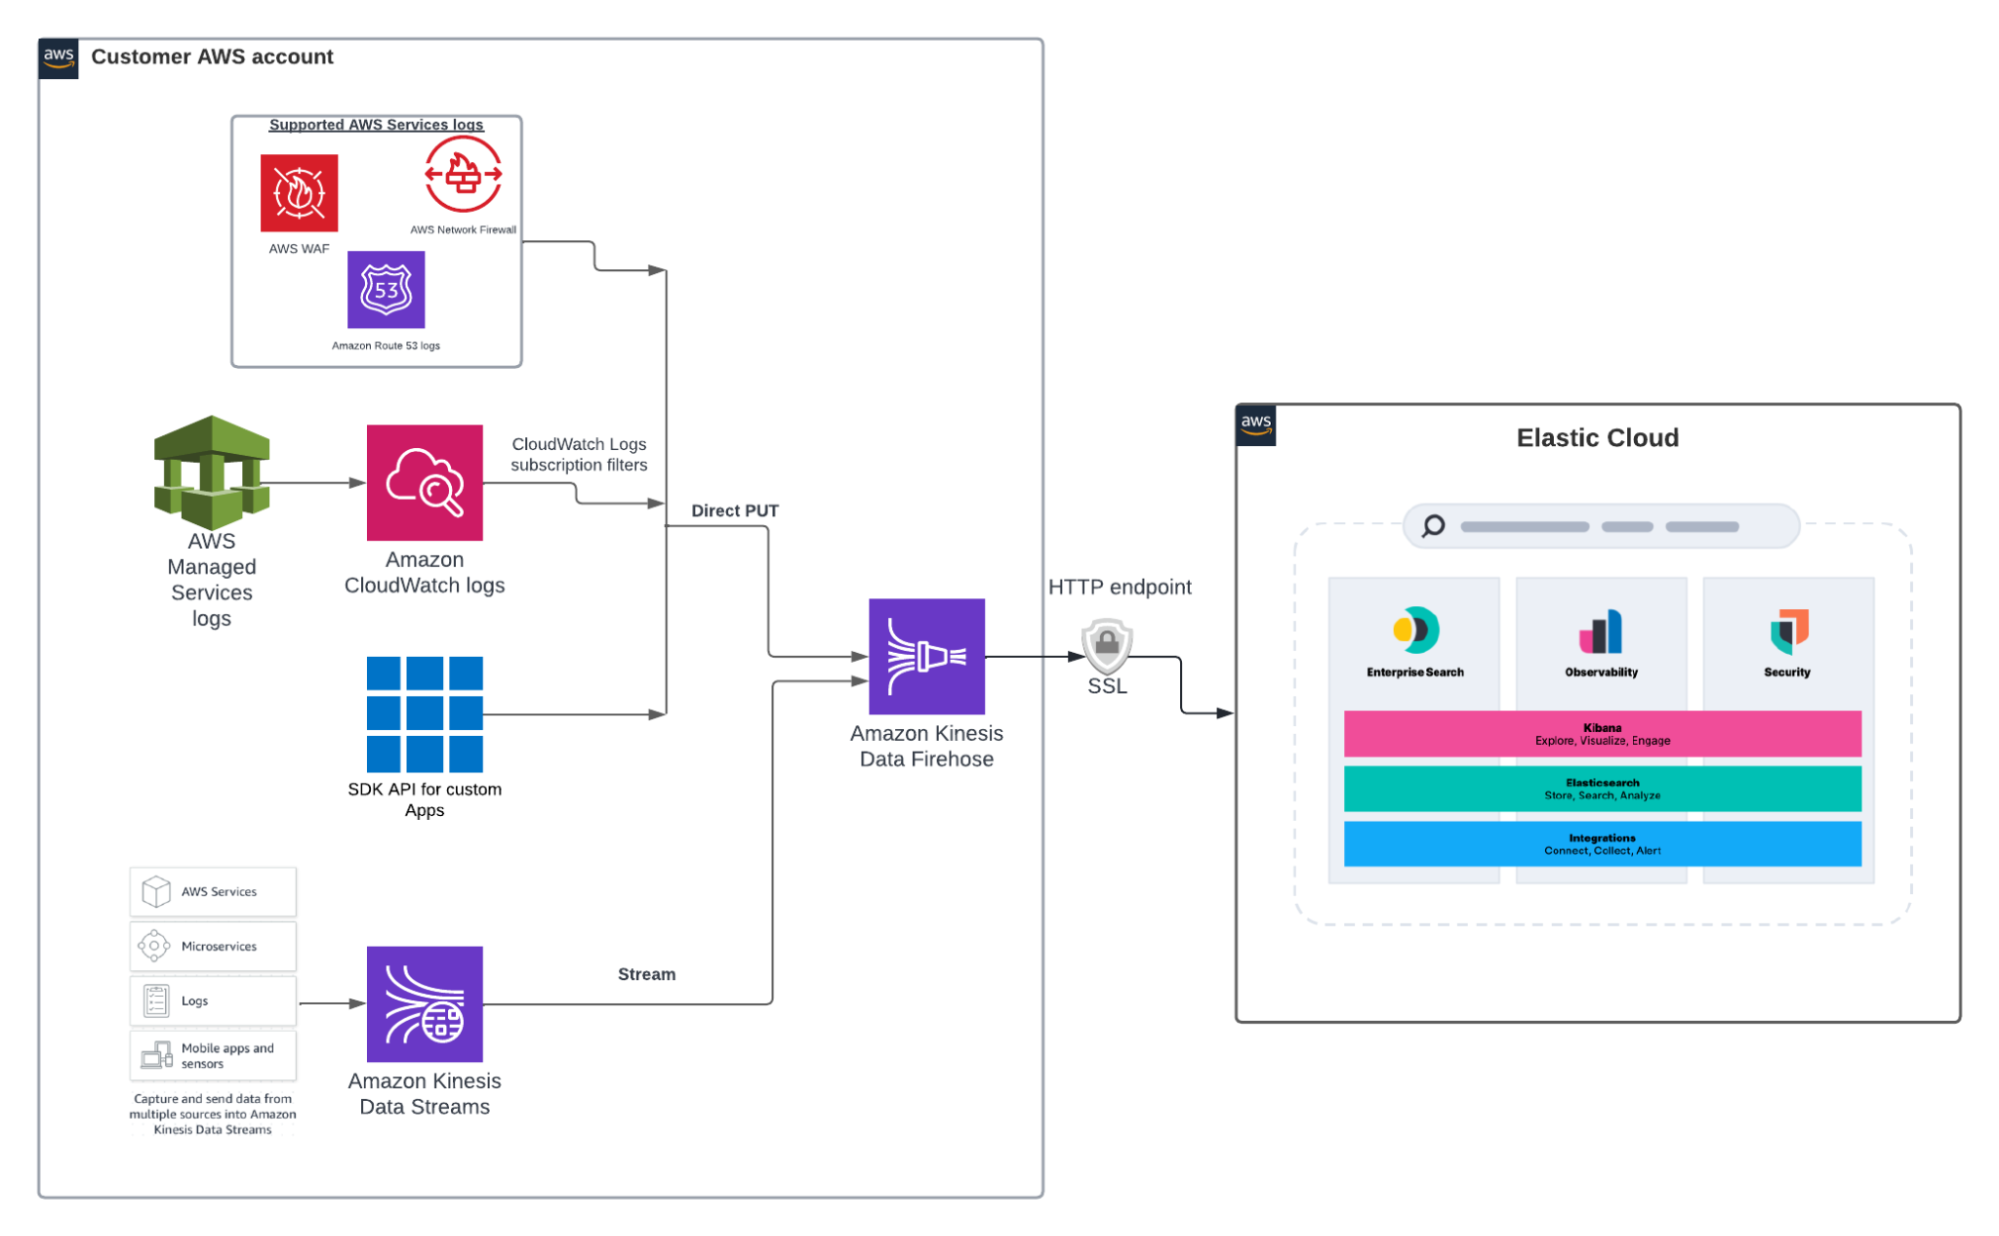
The direct, easy integration with AWS Kinesis Firehose is made possible via choosing the “Elastic” dropdown for destination when creating the delivery stream for Kinesis Data Firehose in AWS cloud console. Pre-filled default values for configuration settings make the setup a breeze.
Read more about it here (Elastic blog) and the AWS Blog.
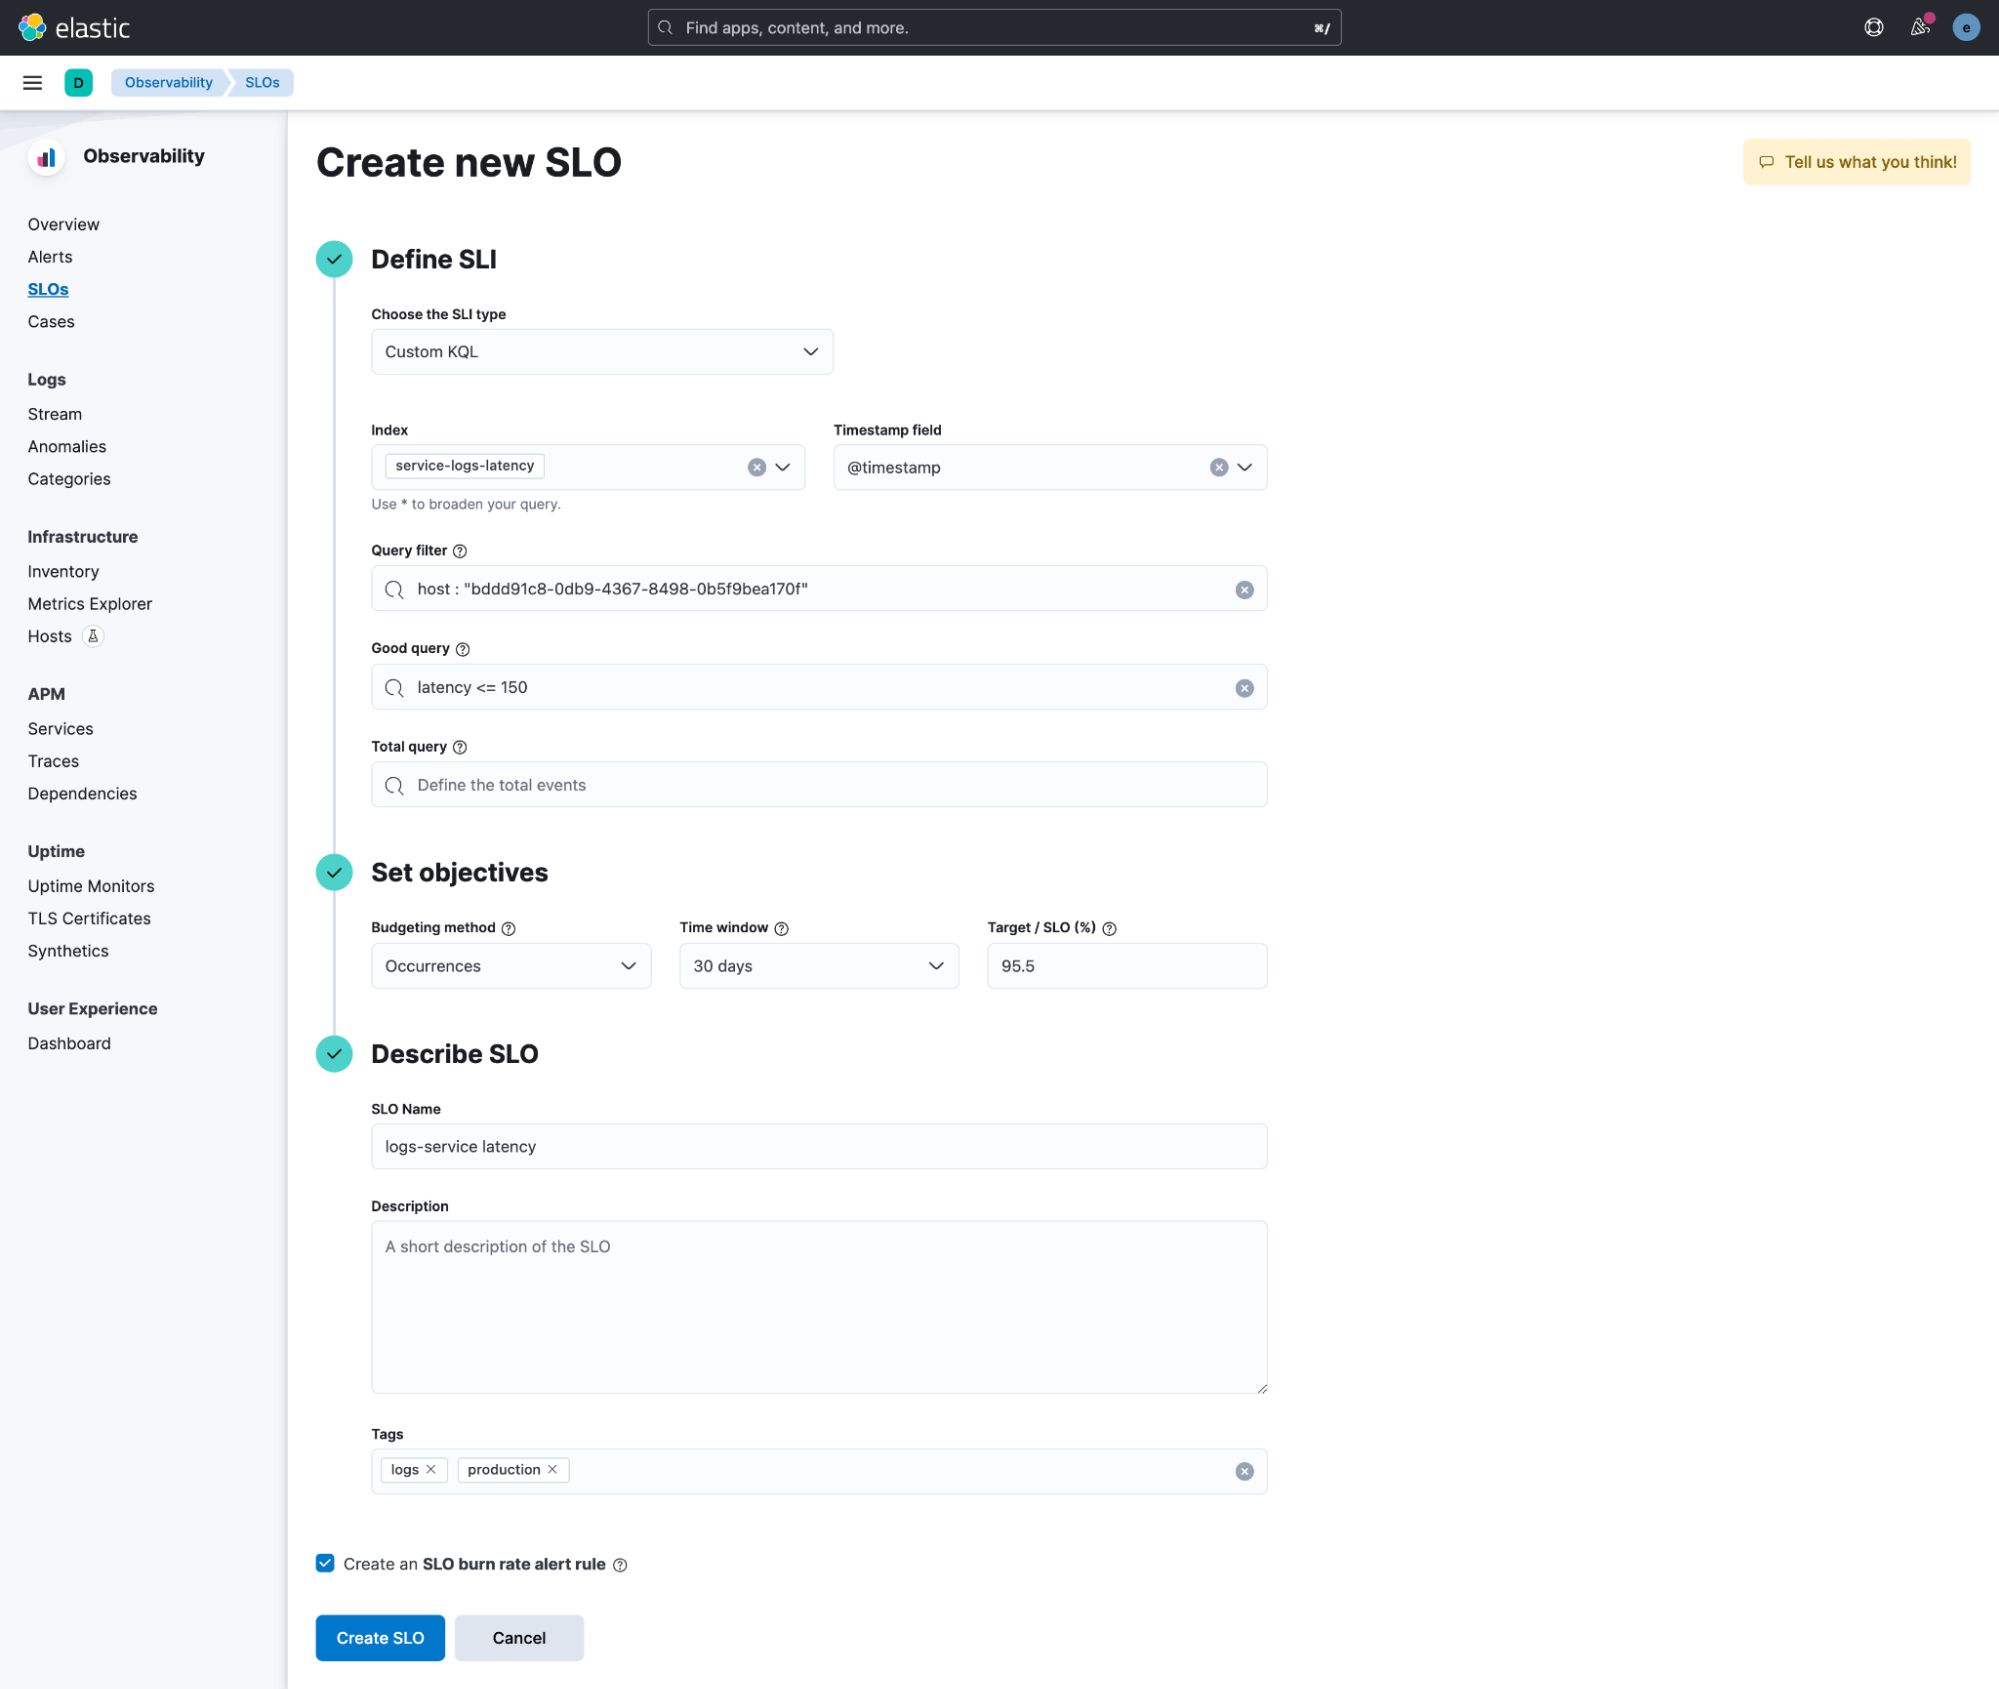
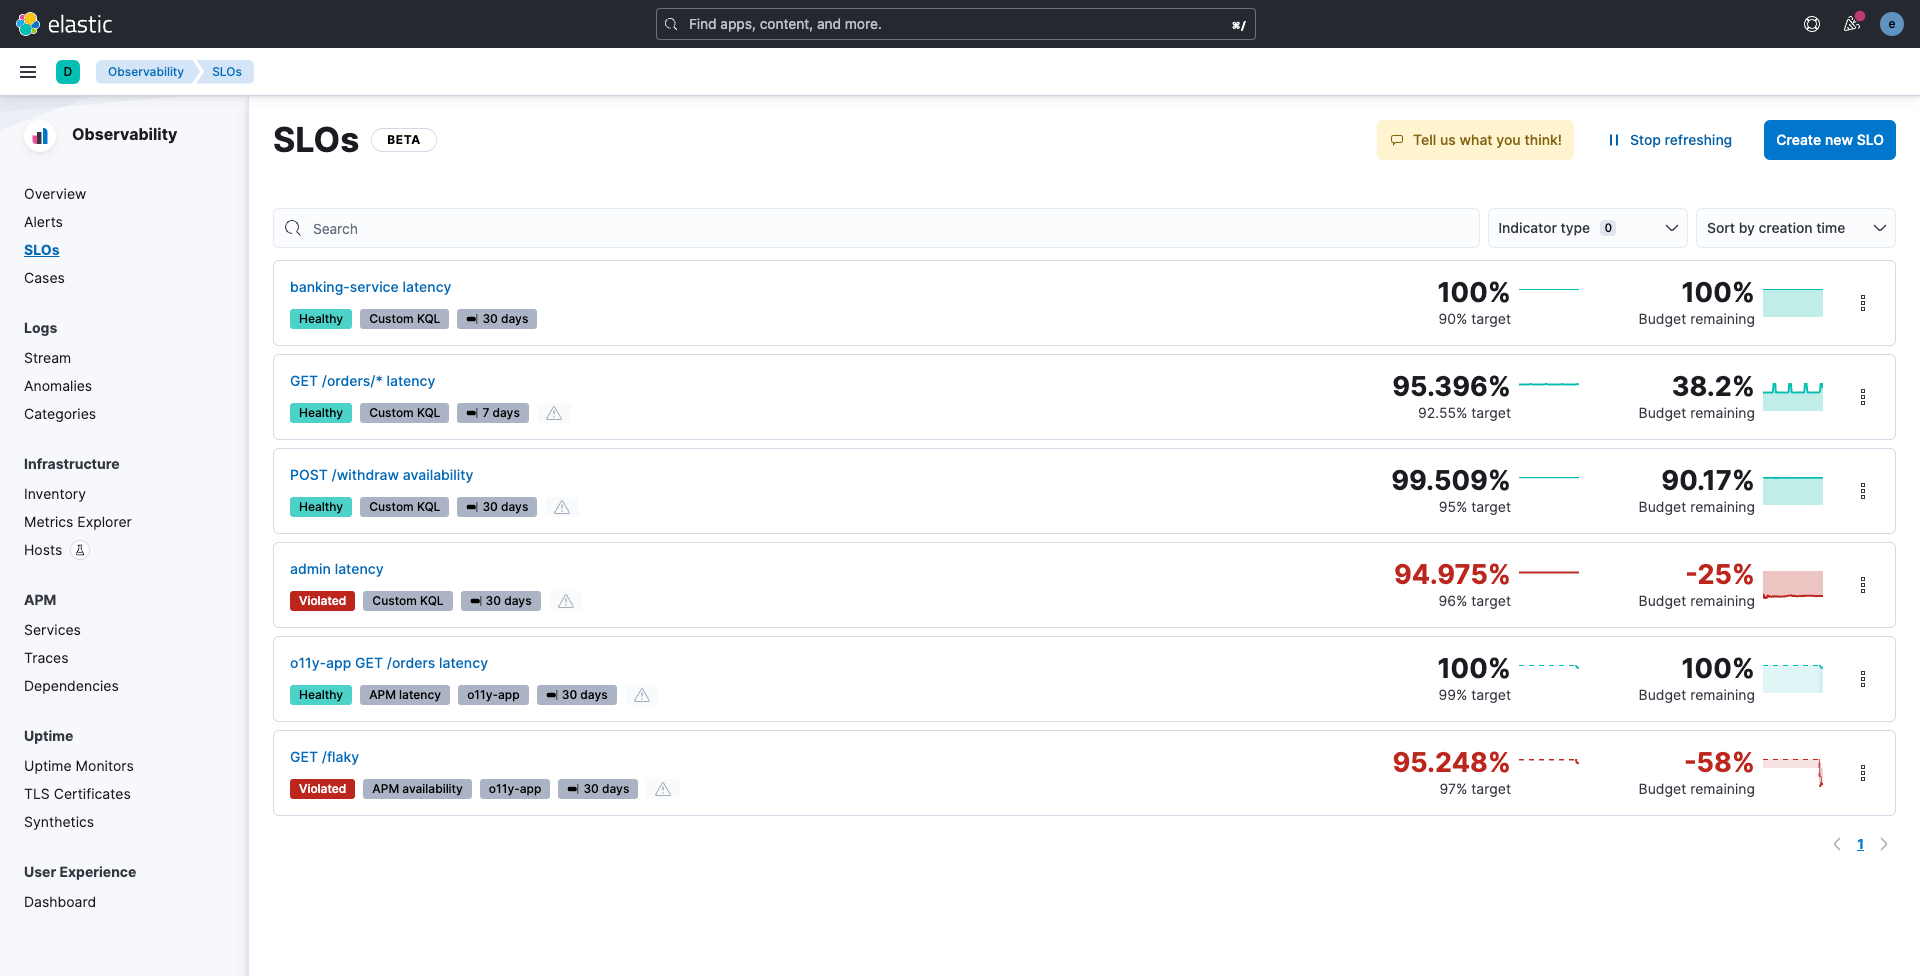
Business and operations efficiency with SLO management in Elastic
Most organizations have business and operations level goals that are tied to specific metrics. You can now generate SLOs and track them with the metrics Elastic Observability collects.
This beta capability is now available in 8.8.
Introducing the new Service Level Objectives (SLOs) feature, which provides a powerful new way to measure and monitor your service quality over time.
SLOs allow you to set clear, measurable targets for your service performance, based on factors like availability, response times, error rates, and other key metrics. You can define SLOs based on different types of data sources, such as custom KQL queries, APM latency, or availability data to start with, and more to come.
Create SLOs
View your SLO status
Drill into SLO detail
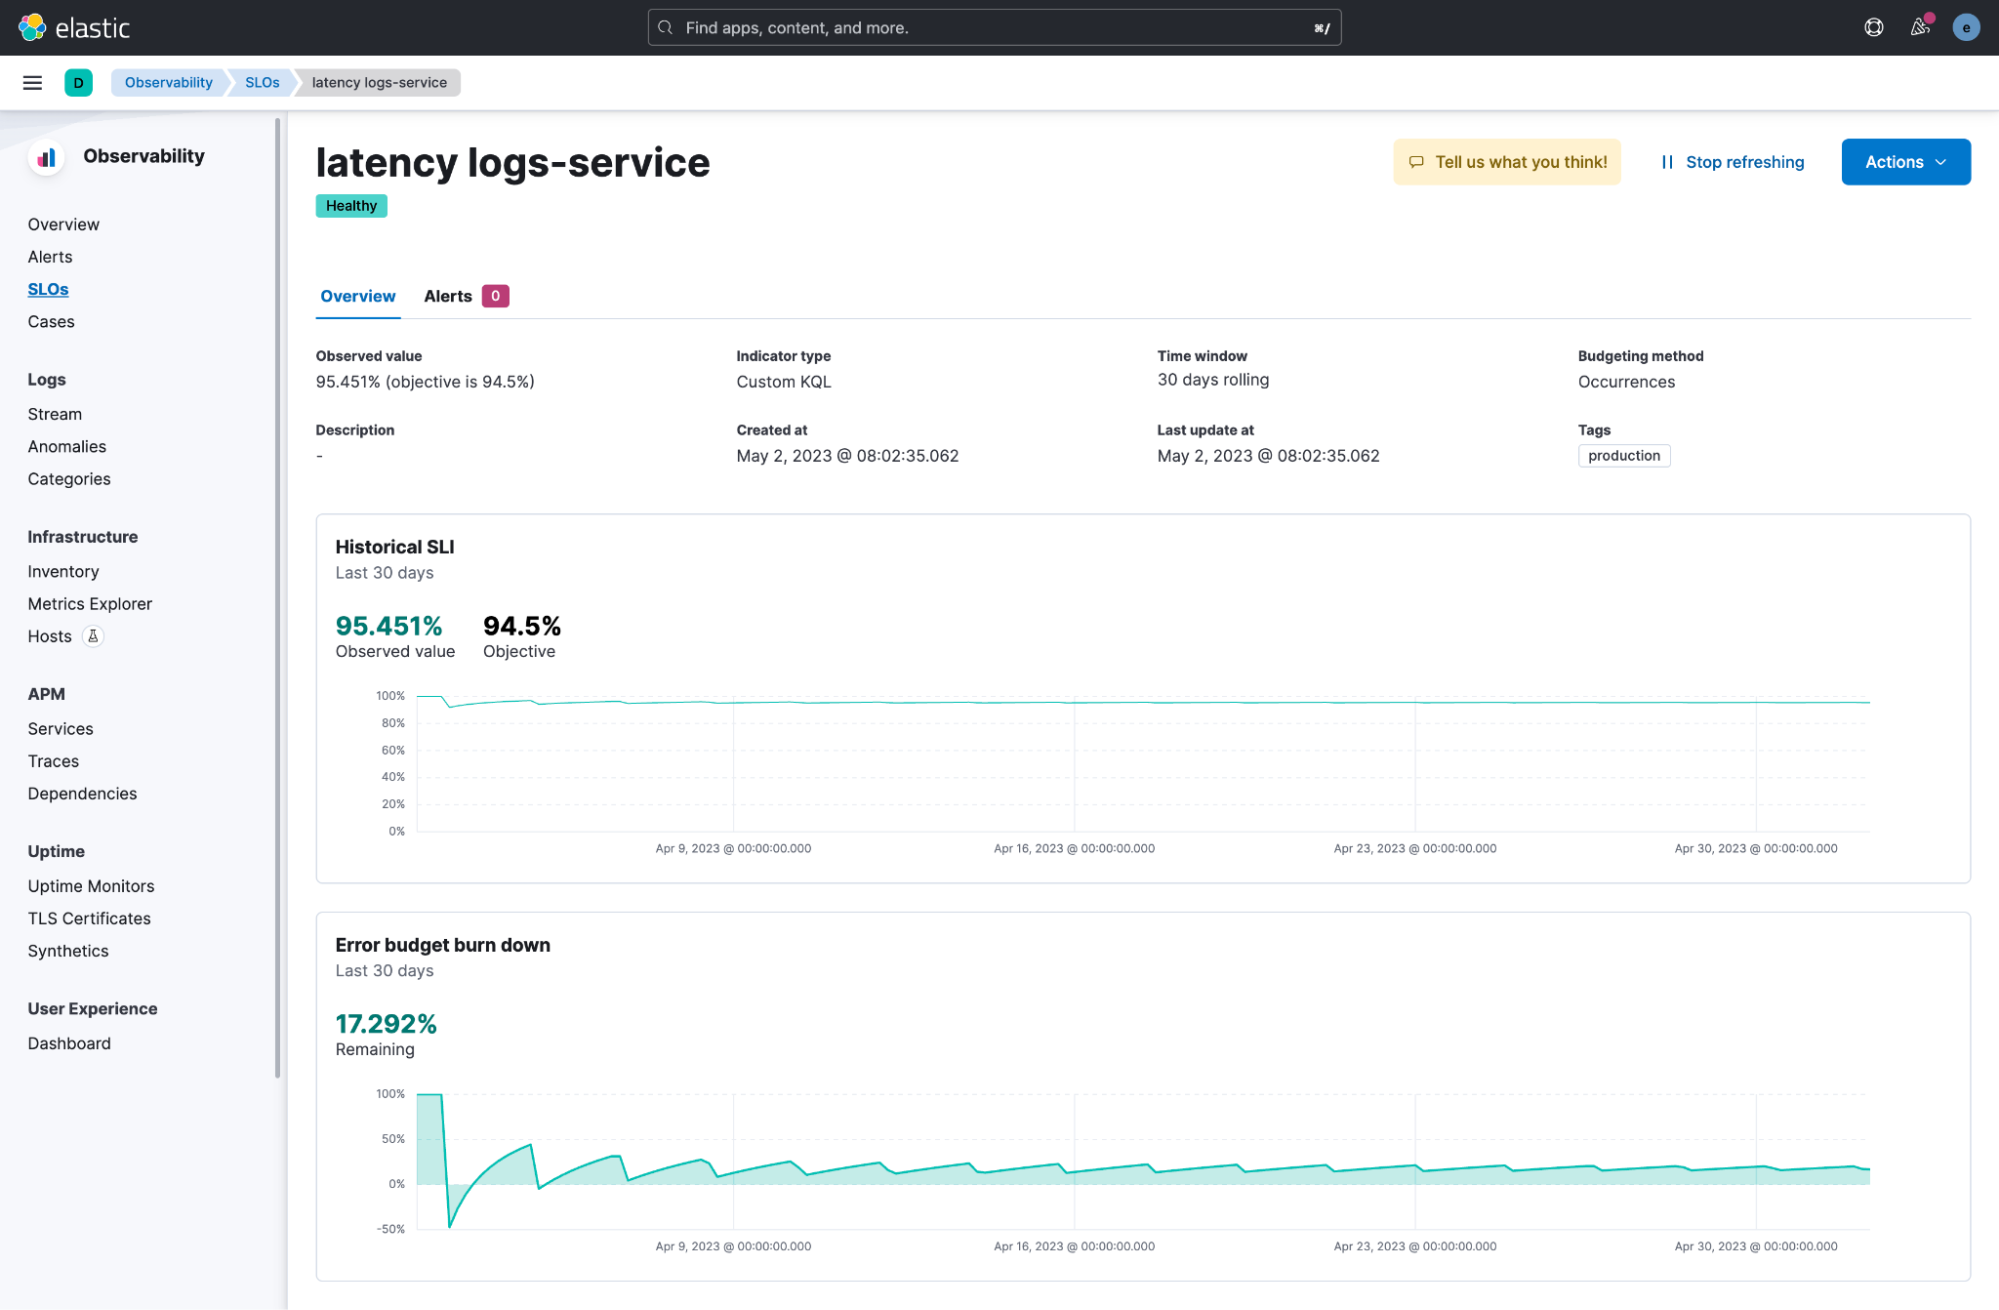
Once you've defined your SLOs, you can monitor them in real time with detailed dashboards and alerts that help you quickly identify and troubleshoot any issues that may arise. You can also track your progress against your SLO targets over time, with a clear view of your error budgets and burn rates.
Once you have played with the beta version, we would love to get your feedback.
Improve data categorization for more efficient operations
As a large variety and volume of data are brought into Elastic, whether from AWS, Kubernetes, or applications, operations teams spend a large amount of time sorting the data for analysis. For example, using Amazon Kinesis Data Firehose to ingest all AWS logs means everything will come into a single data stream.
Elastic has now added a new reroute processor that allows users to organize their signal data into dedicated data streams using custom attributes from the documents, such as the team name, the path of the log file, or other parameters. Structuring data according to the best practices for the data stream naming scheme enables the following use cases:
- Process and structure the data differently using dedicated ingest pipelines (AWS VPC flow logs versus AWS RDS logs).
- Create index-level access rules based on custom attributes, such as the team name.
- Set up different retention policies.
- Leverage stronger isolation so that mapping issues in one area doesn’t affect others.
Currently, the reroute processor is in technical preview and we’re soliciting feedback from early adopters. We’re in the process of adding routing rules into sink-type logging integrations that contain data from multiple sources.
Try it out
Read about these capabilities and more in the release notes.
Existing Elastic Cloud customers can access many of these features directly from the Elastic Cloud console. Not taking advantage of Elastic on cloud? Start a free trial.
The release and timing of any features or functionality described in this post remain at Elastic's sole discretion. Any features or functionality not currently available may not be delivered on time or at all.
Share
- Share on Twitter
Share on Twitter
- Share on LinkedIn
Share on LinkedIn
- Share on Facebook
Share on Facebook
- Share by Email
Share by Email
- Print this page
Print