SLOs
editSLOs
editThis functionality is in beta and is subject to change. The design and code is less mature than official GA features and is being provided as-is with no warranties. Beta features are not subject to the support SLA of official GA features.
SLOs allow you to set clear, measurable targets for your service performance, based on factors like availability, response times, error rates, and other key metrics. You can define SLOs based on different types of data sources, such as custom KQL queries and APM latency or availability data.
Once you’ve defined your SLOs, you can monitor them in real time, with detailed dashboards and alerts that help you quickly identify and troubleshoot any issues that may arise. You can also track your progress against your SLO targets over time, with a clear view of your error budgets and burn rates.
Important concepts
editThe following table lists some important concepts related to SLOs:
|
Service-level indicator (SLI) |
The measurement of your service’s performance, such as service latency or availability. |
|
SLO |
The target you set for your SLI. It specifies the level of performance you expect from your service over a period of time. |
|
Error budget |
The amount of time that your SLI can not meet the SLO target before it violates your SLO. |
|
Burn rate |
The rate at which your service consumes your error budget. |
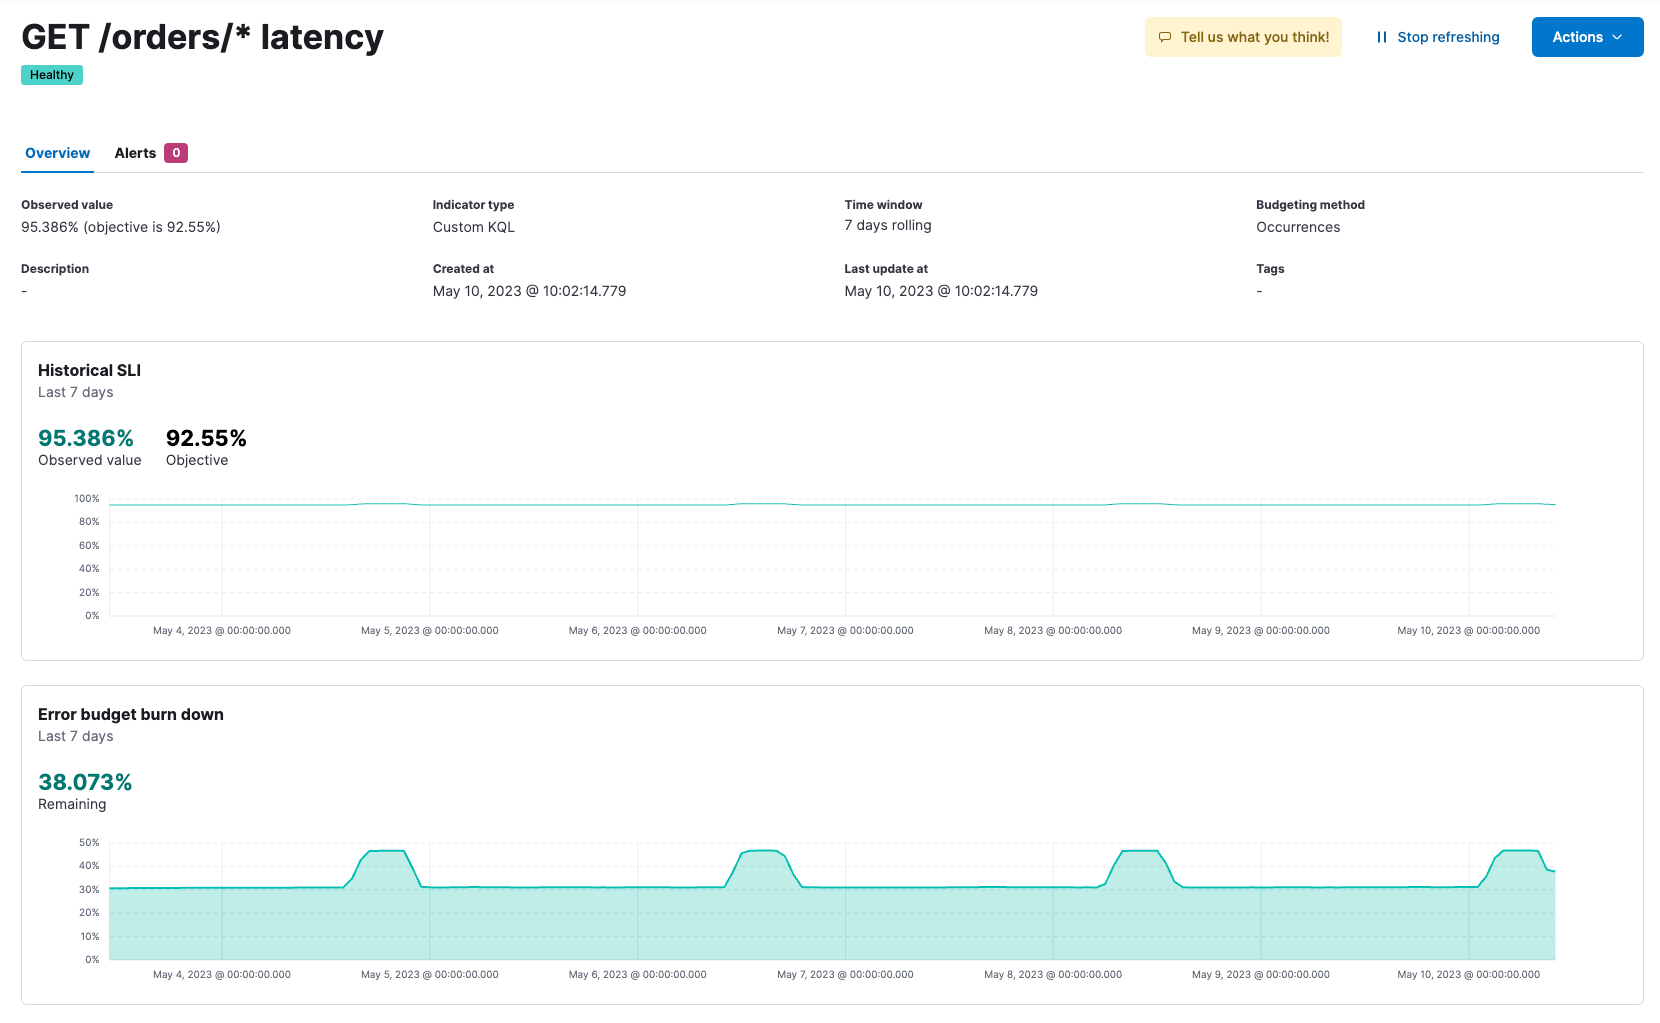
SLO Dashboard
editFrom the SLO dashboard list, you can see all of your SLOs and a quick summary of what’s happening in each one:
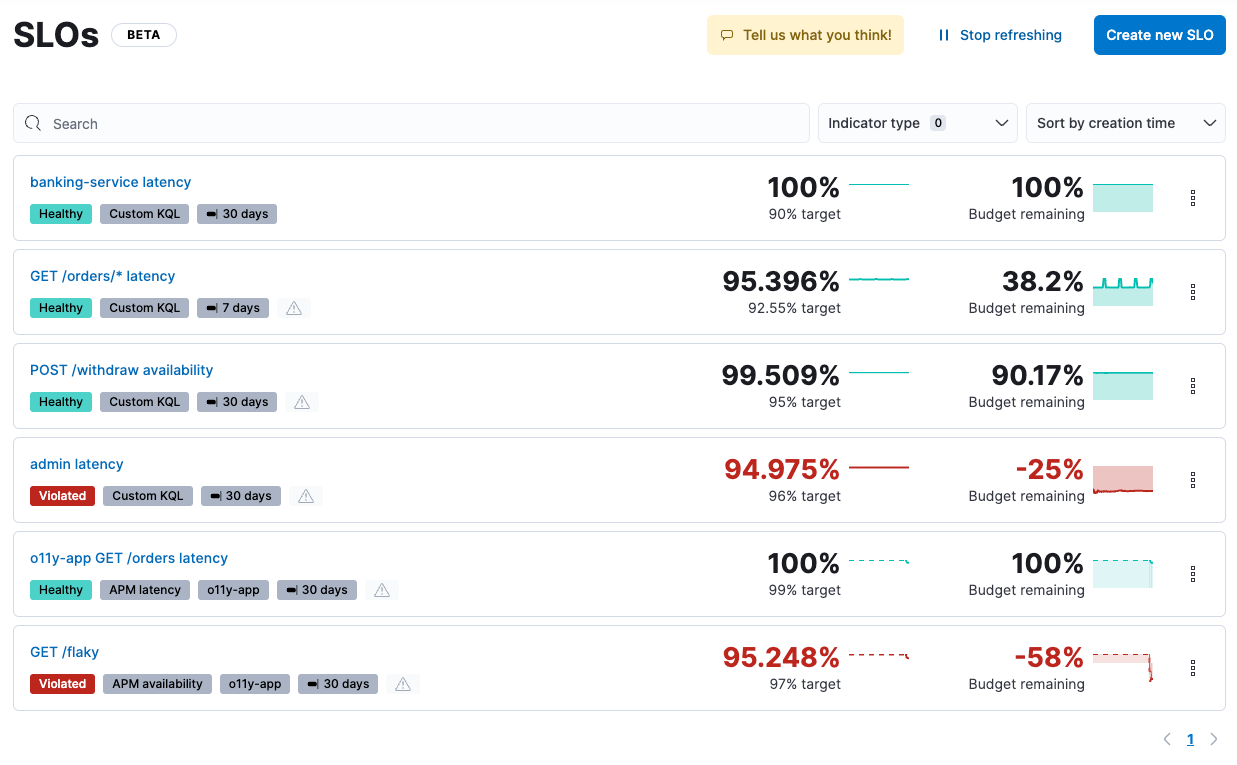
Click an SLO from the dashboard to see a detailed view. This view includes SLI history, error budget burn down charts, and current active alerts if you’ve set any SLO burn rate alert rules for the SLO.
Next steps
editTo get started using SLOs to measure your service performance, see the following pages: