What’s new in Elastic Security 7.13: Equip analysts with vital context
We are excited to share Elastic Security 7.13, which connects analysts to the information they need to make smart decisions. The release is a major step forward in our support for osquery, streamlining access to host data from across your environment. Threat intelligence is surfaced in new ways and new detection content spots concerning events. Last but not least, the release shares some developments in the endpoint area and support for new data sources.
Osquery for everybody
Elastic Security 7.13 substantially broadens our support for osquery, the open source host instrumentation framework. Osquery is the not-so-secret weapon of many sophisticated security teams, augmenting numerous security, compliance, and operations use cases, such as:
- Unexpected changes in disk free space or memory usage
- Improving visibility into active accounts and processes
- Validating use of encrypted storage to support compliance requirements
Osquery is incredibly powerful, built by a worldwide open source community, and popular with Elastic users. But implementing it can be cumbersome and usually requires significant DevOps investment, hampering adoption. That’s why Elastic is working to make it easier for security teams to operationalize osquery at scale, starting with the capabilities in our 7.13 release.
Central osquery management
The osquery management integration for Elastic Agent is new to Elastic Security, providing the power of osquery without the complexities of a separate management layer. With one click, you can install osquery across any or all of your Windows, macOS, and Linux hosts — no scripts or provisioning tools required. Without any configuration, data is ingested in Elasticsearch and shown in Kibana. Practitioners can run live queries with one or more agents or user-defined sets of agents, and define scheduled queries to capture state changes.
Need to collect logs from an existing osquery deployment? That’s a job for the Osquery Log Collection integration for Elastic Agent.
Unified analysis of osquery host data
Elastic Security 7.13 and osquery deliver key hosts insights, with an interface that analysts use every day. Analysts write queries in SQL, rather than face the unforgiving command lines of various operating systems. Pre-canned queries are published in various community GitHub repos, further lowering the learning curve. And with Elastic Security 7.13, Kibana guides query writers with code completion, code hinting, and content assistance.
Analyzing osquery data in Elastic Security enables unified data analysis. From a single pane of glass, view all log/event results, security analytics, and osquery context — from historical view of queries that have been run, to the results of each query. Centralize security analytics to contextualize osquery results against other log/event data, anomalies, and threats, leveraging that context to improve monitoring.
As a combined solution, Elastic Security and osquery deliver invaluable host visibility and analytical power. Together, the combined solution enables unified analysis of all host data — osquery results, logs, events, you name it — to address cyber threats and related issues. Search hosts for information that would be unavailable otherwise. Ingest results right into Elasticsearch and visualize them in the Security app in Kibana. Then analyze it alongside data from other sources, using machine learning, the SIEM detection engine, dashboards, and more.
Surface threat intelligence within analyst workflows
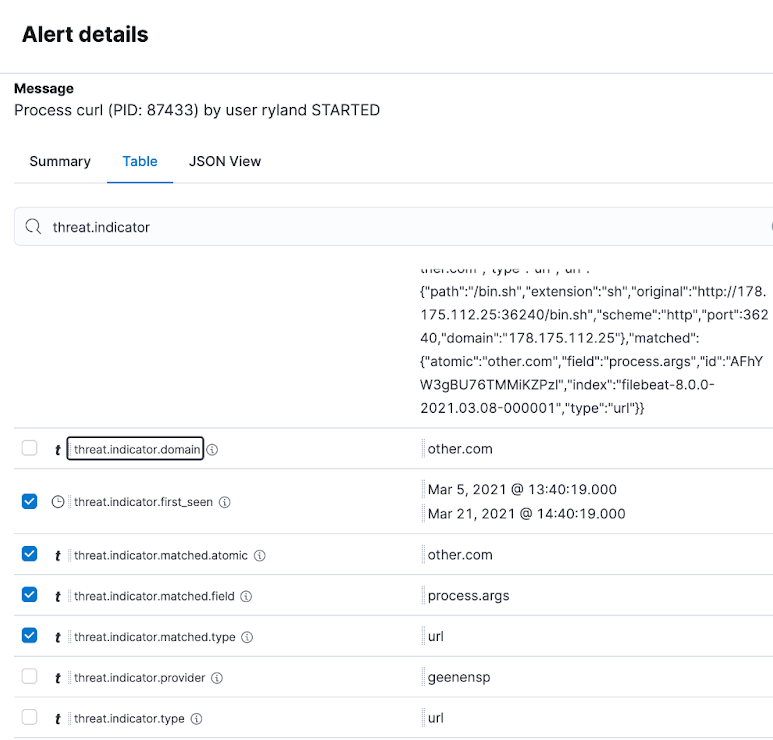
Threat intelligence shown in Alert details panel
The Alert details panel for alerts generated by indicator match rules now shows relevant threat intelligence details, potentially sparing analysts from needing to pursue that context in a new browser tab.
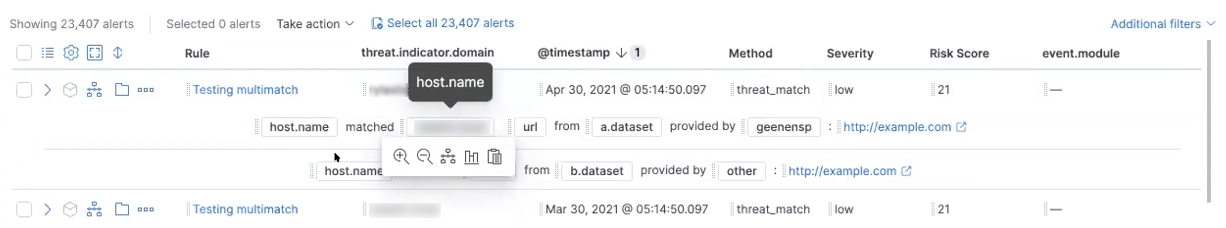
Row renderer summarizes threat intel matches
Elastic Security 7.13 adds a row renderer for alerts generated by indicator match rules, presenting details about the matched IoC in a semantic format for quick analyst comprehension.
Timeline template for detection alerts generated by indicator match rule type
7.13 adds a timeline template for alerts generated by indicator match rules, accelerating investigations by surfacing the most relevant details on the Timeline workspace.
Support for MalwareBazaar threat feed from abuse.ch
7.13 expands the Threat Intel module for Filebeat to support ingestion of the MalwareBazaar feed from abuse.ch. MalwareBazaar facilitates the sharing of malware samples across the security community, helping practitioners make the modern world a safer place. In Elastic Security, this contextual data can be applied to automated detection use cases via the indicator match rule type, as well as give analysts direct access to information valuable to various hunting and incident response use cases.
Advanced detection techniques for advanced threats
Detect advanced threats with ML jobs in Network Module
Security research engineers at Elastic have developed a new set of machine learning jobs that spot anomalies in network behavior that could reveal an advanced threat by spotting command-and-control connections, attempted data exfiltration, and other suspicious or malicious activity:
- high_count_by_destination_country looks for an unusually large spike in network activity to one destination country in the network logs, potentially spotting reconnaissance or enumeration traffic
- high_count_network_denies looks for an unusually large spike in network traffic that was denied by network ACLs or firewall rules, typically revealing either a misconfigured device or suspicious/malicious activity
- high_count_network_events looks for an unusually large spike in network traffic, which could reveal a burst of traffic can be due to suspicious or malicious activity
- rare_destination_country looks for an unusual destination country name in the network logs, which can be due to initial access, persistence, command-and-control, or exfiltration activity
Additional prebuilt detection rules
Elastic 7.13 introduces another new set of prebuilt detection rules, protecting O365, macOS, and other areas. The detection rules cover a wide range of attack techniques and are shipped with corresponding timeline templates.
The release also enables admins to configure indicator match rules to fire on matches with data from six sources of threat intelligence: Abuse.ch MalwareBazaar, Abuse.ch URLhaus, Anomali Limo; AlienVault OTX, MalwareBazaar, and MISP.
Anomalous parent-child ML model
Security research engineers at Elastic recently detailed a way to use both supervised and unsupervised ML to detect living-off-the-land binaries (what the cool kids call LOLBins) that would otherwise escape detection by blending into the noise of other system programs.
Out-of-band rule updates
New and updated detection rules can now be delivered outside Elastic’s regular release cycle, enabling our security research engineers to respond more quickly to trending security events. All rules are version-controlled and updated individually. Administrators are notified about updates and can approve them with a click.
Endpoint security enhancements
Process tampering detection
Elastic now enables the detection of process tampering, including attacks like Process Doppelgänging and Process Herpaderping. Whether you’re using Elastic Agent or Winlogbeat, you can automate the detection of process tampering.
EICAR detection
Elastic Security 7.13 simplifies operations by adding the EICAR signature to the default diagnostic malware signatures used for Elastic Agent, supporting automated testing for malware systems on Windows, macOS, and Linux.
Fleet Server
Version 7.13 introduces Fleet Server, a dedicated infrastructure component (take a load off, Kibana) for managing agents and administering agent integrations. It was written in Go, purpose-built to handle tens or hundreds of thousands of Agents. Learn more in the Elastic Cloud release blog.
More (and more) data integrations
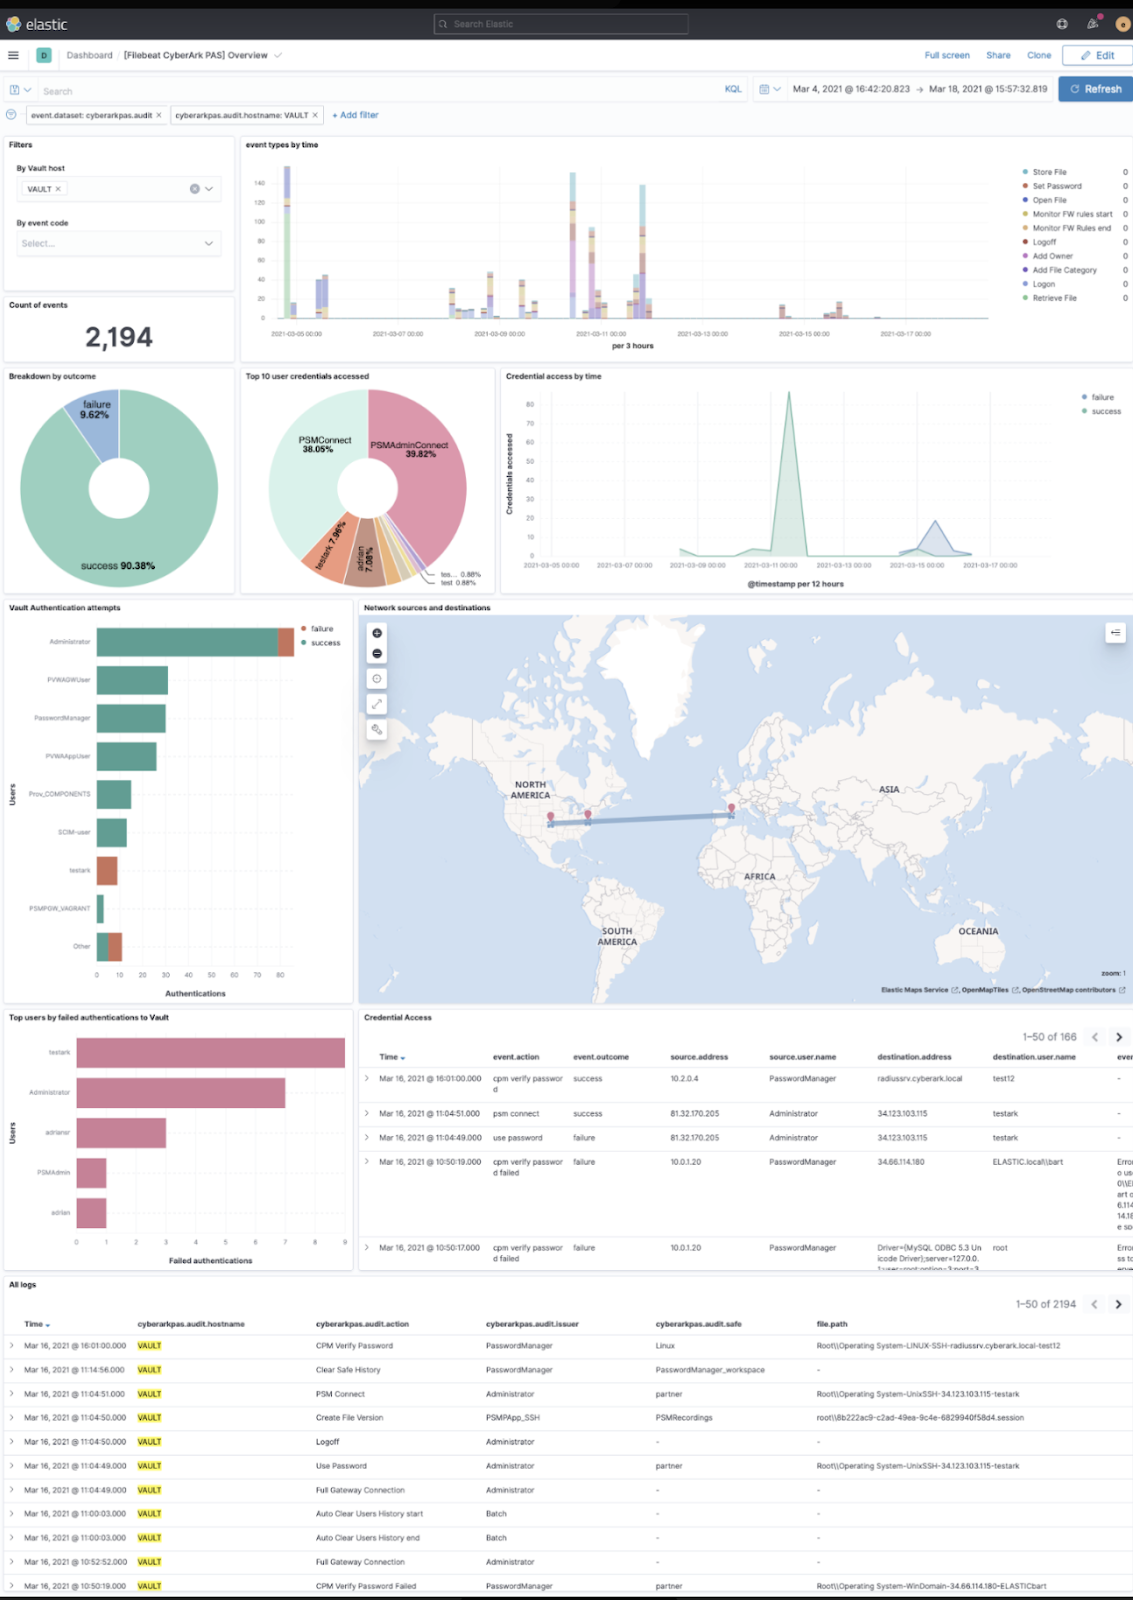
CyberArk Privileged Access Security integration
CyberArk worked with Elastic to build a robust integration with their Privileged Access Security (PAS) solution, providing optimal ingestion and parsing of this valuable data source. Analyzing these events alongside other environmental data enables analysts to spot threats employing misused privileged accounts to advance along the cyber kill chain. The integration also includes the mighty sharp dashboard pictured below.
Standalone XML processor for Windows events
Elastic Security now offers a new way to parse and ingest Windows events in XML format residing in a non-Windows system.
Forward Windows events from legacy SIEM
Version 7.13 now supports the ingestion of Windows events via the third-party and legacy SIEM connector.
Sysmon event collection update
The Sysmon module for Winlogbeat has been updated in a small but important way: it now supports Event 24 (clipboard change) and Event 25 (process tampering). Whether you’re using Agent or Winlogbeat, you can collect events revealing process tampering.
Support for ECS 1.9
All Agent and Beats data integration modules have been updated to ECS 1.9.
Give Elastic Security 7.13 a spin
Want to try out all this goodness in Elastic Security? Experience all that 7.13 has to offer on Elastic Cloud, or check out an Elastic Security demo. Already have ECS-formatted data in Elasticsearch? Just upgrade to 7.13 of the Elastic Stack to start detecting and responding.