Elastic Observability 8.9: Introducing AI Assistant and up to 70% cost savings on metrics storage!


 Share on Twitter
Share on Twitter

 Share on LinkedIn
Share on LinkedIn

 Share on Facebook
Share on Facebook

 Share by Email
Share by Email

 Print this page
Print
Elastic Observability 8.9 introduces several GA and tech preview capabilities. Most notable are the following two capabilities:
- Observability use cases for the Elastic AI Assistant: Now in technical preview, the Elastic AI Assistant improves understanding and context for the following use cases: APM errors, log messages, host processes, alerts details, and Universal Profiling.
- Cost savings from integrations leveraging time series data streams (TSDS): Cost savings from more integrations beyond infrastructure integrations (K8S, etc.) leveraging TSDS can help realize up to a 70% reduction in storage for Elastic® indices.
Elastic Observability 8.9 is available now on Elastic Cloud — the only hosted Elasticsearch® offering to include all of the new features in this latest release. You can also download the Elastic Stack and our cloud orchestration products, Elastic Cloud Enterprise and Elastic Cloud for Kubernetes, for a self-managed experience.
What else is new in Elastic 8.9? Check out the 8.9 announcement post to learn more >>
Introducing Elastic AI Assistant use cases for Observability
Elastic Observability is excited to announce the initial (technical preview) release of the Elastic AI Assistant for Observability. Key observability workflows have been enhanced with generative AI (GAI) to help improve troubleshooting processes and provide automated explanations for information that is not easily understood. This will lead to better root cause analysis and improved MTTx.
Elastic AI Assistant for Observability is incorporating generative AI in the following user workflows:
- Elastic AI Assistant for log message: Provides the ability to use generative AI to look up the meaning of the log message details and help you find related messages

- Elastic AI Assistant for APM errors: Provides the ability to explain an error or stack trace in APM and suggest remediations

- Elastic AI Assistant for log alerts: Provides the ability to use machine learning (ML) to explain what caused the spike in log messages and to use that information with generative AI to provide potential root cause and remediation steps

- Elastic AI Assistant for host processes: Provides the ability to get details on a process and how to optimize the process for resources like CPU or memory

- Elastic AI Assistant for profiling: Provides the ability to explain the most expensive processes/functions in your organization and suggest optimizations — the AI assistant can use generative AI to explain any function and provide details on how to optimize the function.

All of the Elastic AI Assistant use cases mentioned above will be provided in 8.9 as a technical preview.
This feature is available by configuring the Elastic AI Assistant, selecting the model, and entering in your credentials. Initially we will be supporting Azure OpenAI and OpenAI.
Follow the details in our documentation. Here is a quick overview.
- Ensure you have an API key for OpenAI or Azure OpenAI Service.
- Edit your kibana.yaml file (either for self-managed or Elastic Cloud deployments) with one of the following configurations:
OpenAI:
xpack.observability.aiAssistant.enabled: true
xpack.observability.aiAssistant.provider.openAI.apiKey: <insert API key>
xpack.observability.aiAssistant.provider.openAI.model: <insert model name, e.g. gpt-4>Azure OpenAIService:
xpack.observability.aiAssistant.enabled: true
xpack.observability.aiAssistant.provider.azureOpenAI.deploymentId: <insert deployment ID>
xpack.observability.aiAssistant.provider.azureOpenAI.resourceName: <insert resource name>
xpack.observability.aiAssistant.provider.azureOpenAI.apiKey: <insert API key>Read more about Elastic Observability GAI support in the following blogs:
Unlock up to 70% metrics storage efficiency with time series enabled integrations
We are thrilled to announce that the latest version of the most popular Elastic Observability integrations for Elastic Agent now integrate our time series index mode functionality by default.
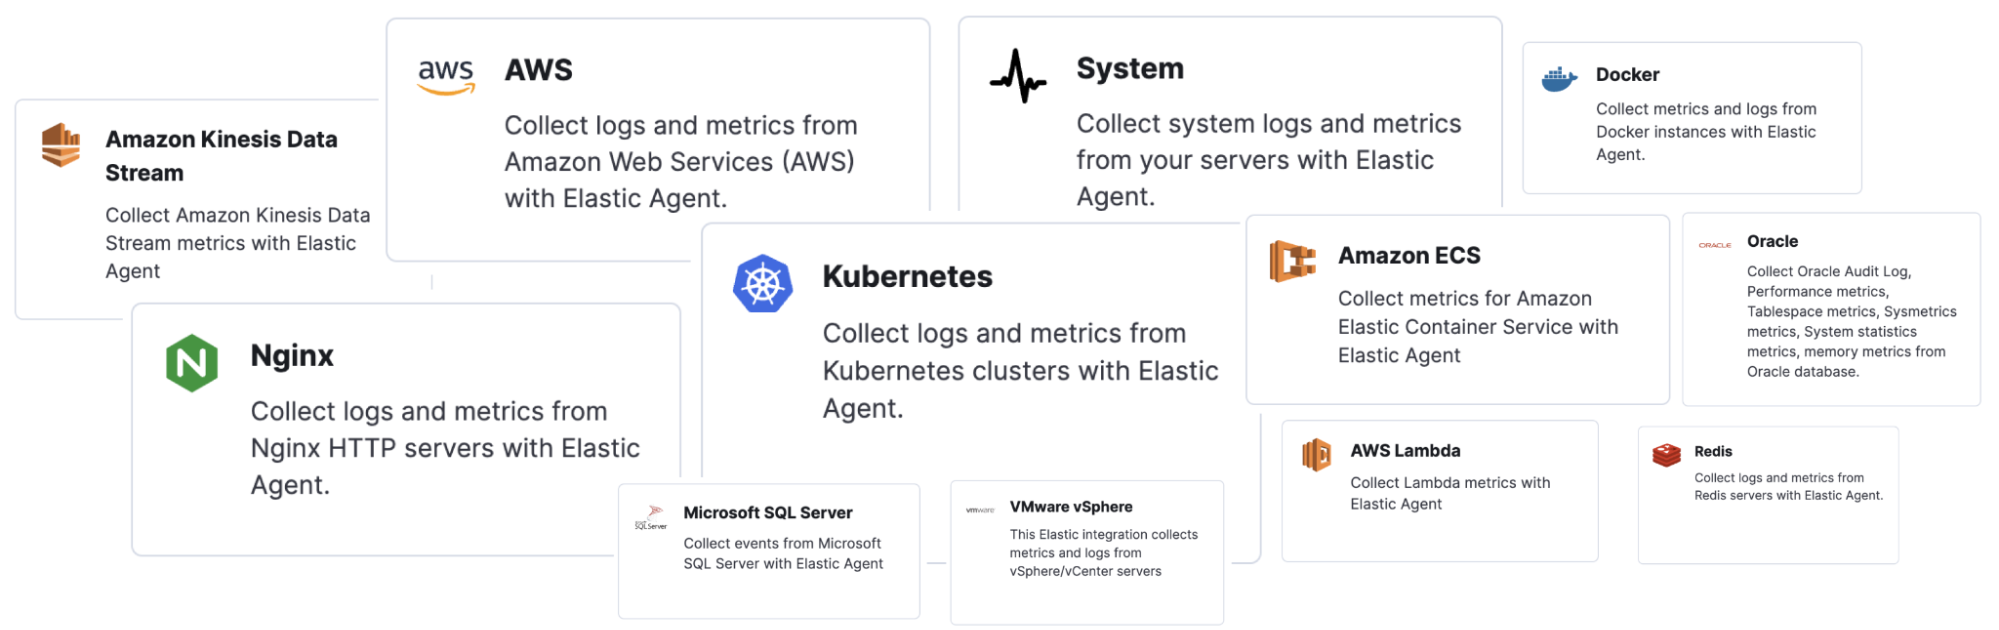
Kubernetes, Nginx, System, AWS, Kinesis, Lambda, and most of the integrations that collect large numbers of metrics have time series index mode enabled out of the box.
By harnessing the power of Elasticsearch’s Time Series Data Stream (TSDS) in these integrations, Elastic can help you realize the following benefits:
- 70% less disk space: With TSDS seamlessly enabled in the integration for your platforms, you can enjoy a significant 70% reduction in disk storage for your metrics data. This reduction translates to cost savings and increased scalability for your infrastructure.
- Streamlined data management: TSDS simplifies the storage and retrieval of your time-stamped metrics data, making it effortless to organize and analyze your valuable insights.
- Out-of-the-box functionality: Thanks to the native integration of TSDS, you can leverage its powerful features without any user input or additional configuration. The integration automatically optimizes storage efficiency for your metrics data, allowing you to focus on deriving meaningful insights.
How to use this in Kibana
To determine if a time series enabled version of an Elastic Agent metrics integration is available, use the integrations documentation to locate the integration, then scroll down to the changelog in its description page.
If a time series enabled version has been released, there will be a release note like shown in the example below.
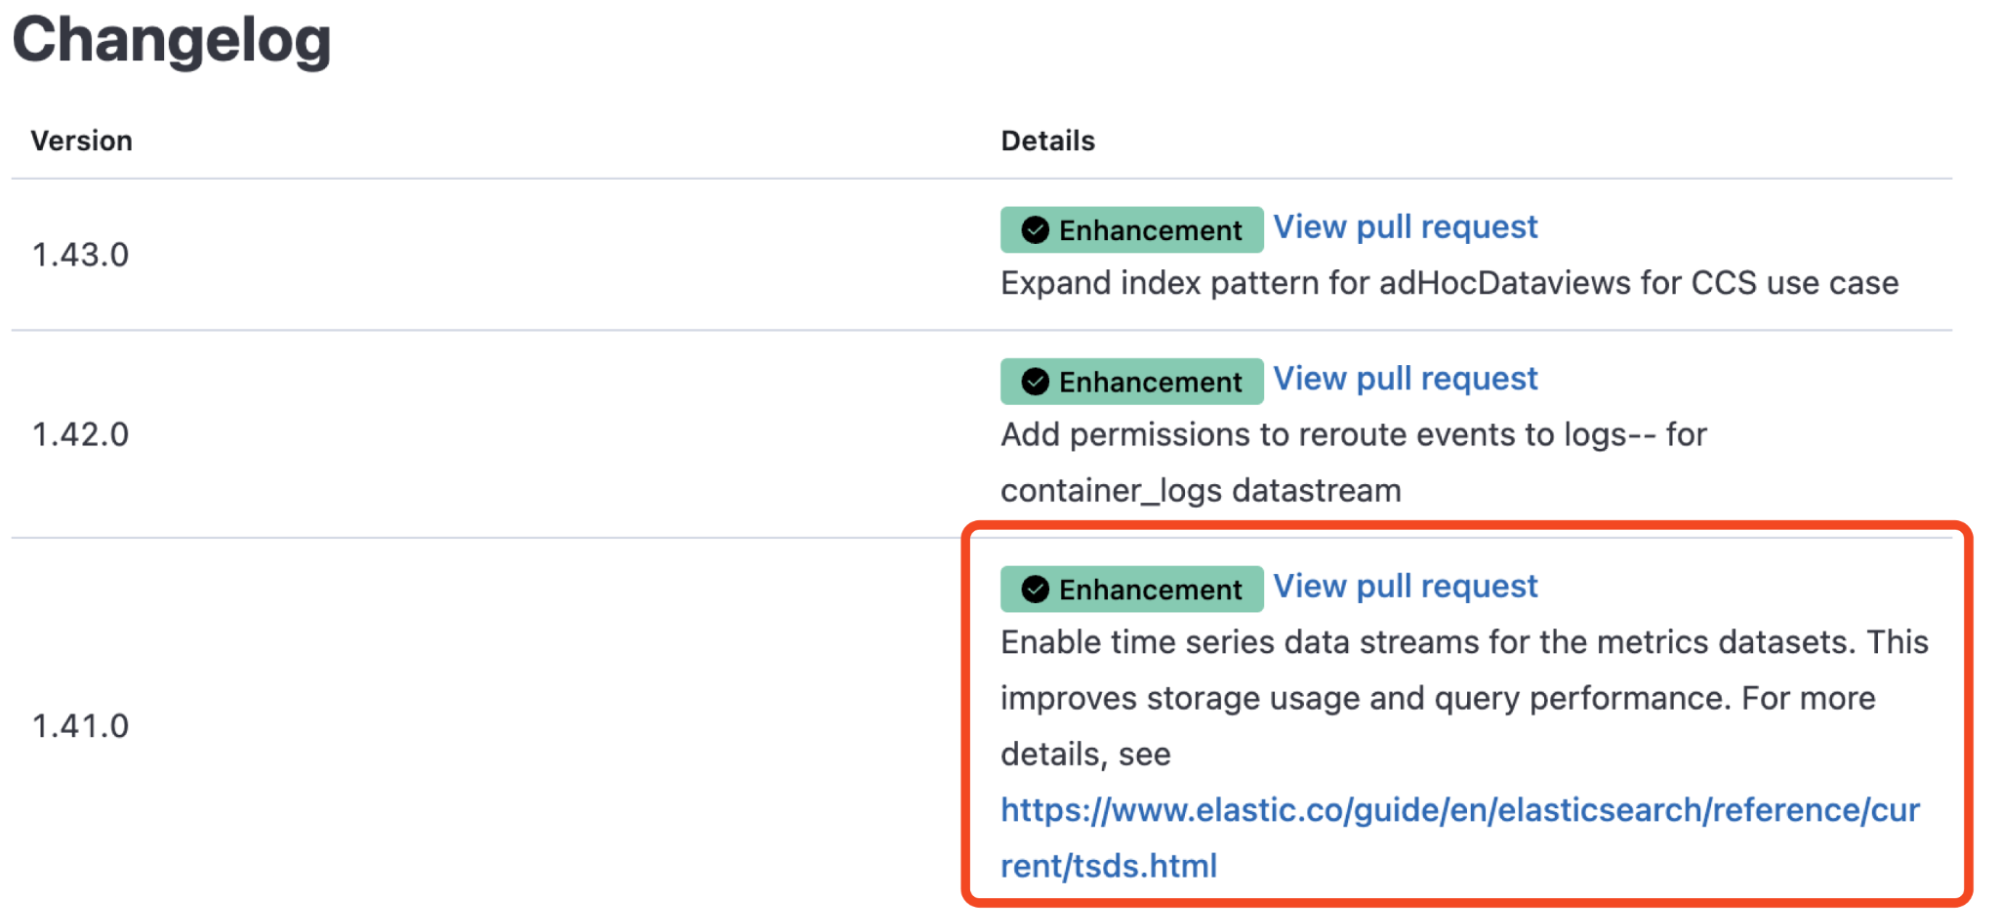
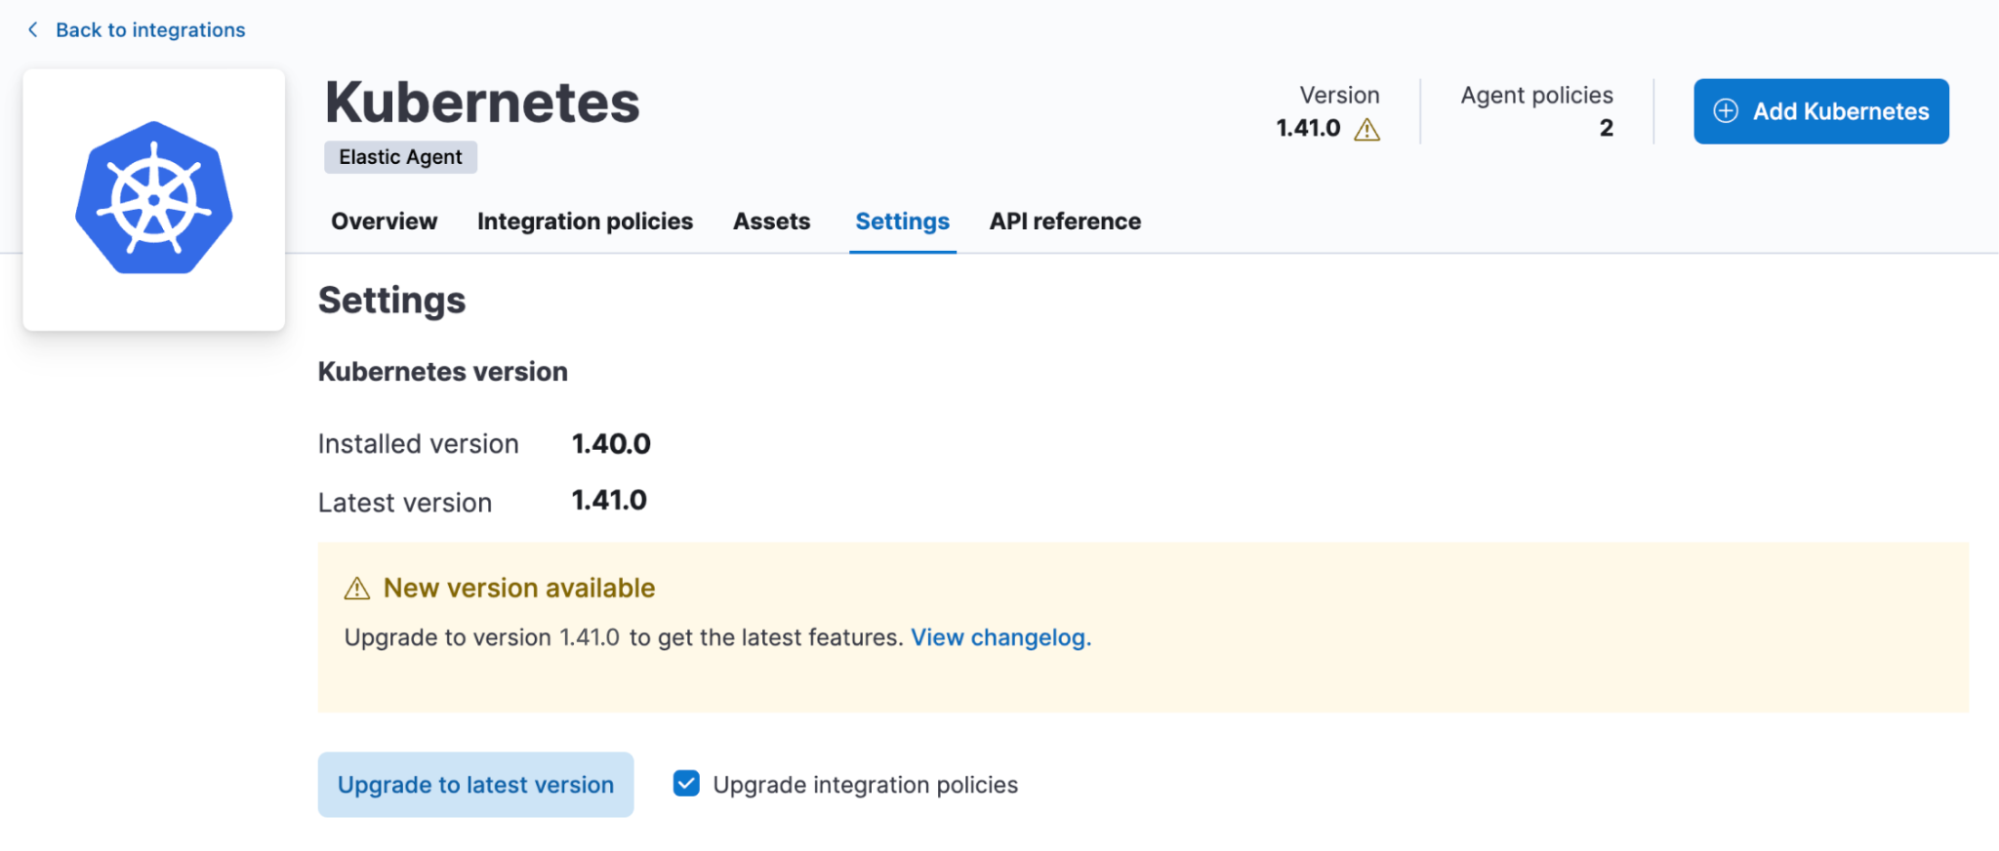
All you have to do is upgrade the integration version (with the upgrade integration policies selected) to the time series enabled version. This will unlock the time series indexing mode going forward!
The latest versions of the following integrations are now TSDB enabled:
- ActiveMQ
- Apache
- AWS
- Billing, Dynamod, EBS, ECS, ELB, Firewall, Kinesis, Lambda, Nat Gateway, RDS, Redshift, S3, SNS, SQS, Transit Gateway, Usage, VPN, S3 Storage Lens
- Couchdb
- Docker
- Elasticsearch
- IBM MQ
- IIS
- Influxdb
- Kafka
- Kubernetes
- Microsoft SQL server
- Nginx
- Oracle
- RabbitMQ
- Redis
- System
- Vsphere
Get started today and experience the benefits of storing your metrics in time series mode in the most popular and powerful store for logs!
For more insights, including a benchmark comparison for storing metrics using time series versus standard data stream, visit this article.
Try it out
Read about these capabilities and more in the release notes.
Existing Elastic Cloud customers can access many of these features directly from the Elastic Cloud console. Not taking advantage of Elastic on cloud? Start a free trial.
The release and timing of any features or functionality described in this post remain at Elastic's sole discretion. Any features or functionality not currently available may not be delivered on time or at all.
Share
- Share on Twitter
Share on Twitter
- Share on LinkedIn
Share on LinkedIn
- Share on Facebook
Share on Facebook
- Share by Email
Share by Email
- Print this page
Print