What's new in Elastic Observability 7.13: Native Azure console integration, Fleet Server, and enhanced APM workflows
We are excited to announce the release of Elastic Observability 7.13. An expanded partnership with Microsoft allows seamless integration between Elastic Observability and your Azure workloads, directly from the Azure console, the new Fleet Server paves the way for better scalability and flexibility, new workflows in APM help speed up root-cause analysis, and more. Let's dive in!
Expanded Microsoft partnership enables seamless onboarding to Elastic Cloud via a native Azure console integration
Through our strategic partnership with Microsoft, we are excited to announce that Elastic Cloud is now available as a native, first-class service, available directly from the Azure console. Now, users can easily discover, procure, and create Elastic deployments directly from the Azure console, just as they would with any native Azure service. While this integration brings several operational benefits and significantly simplifies the Elastic on Azure experience (read more in the Getting started with the Azure integration announcement), we wanted to highlight the benefits specifically for the Azure monitoring use cases.
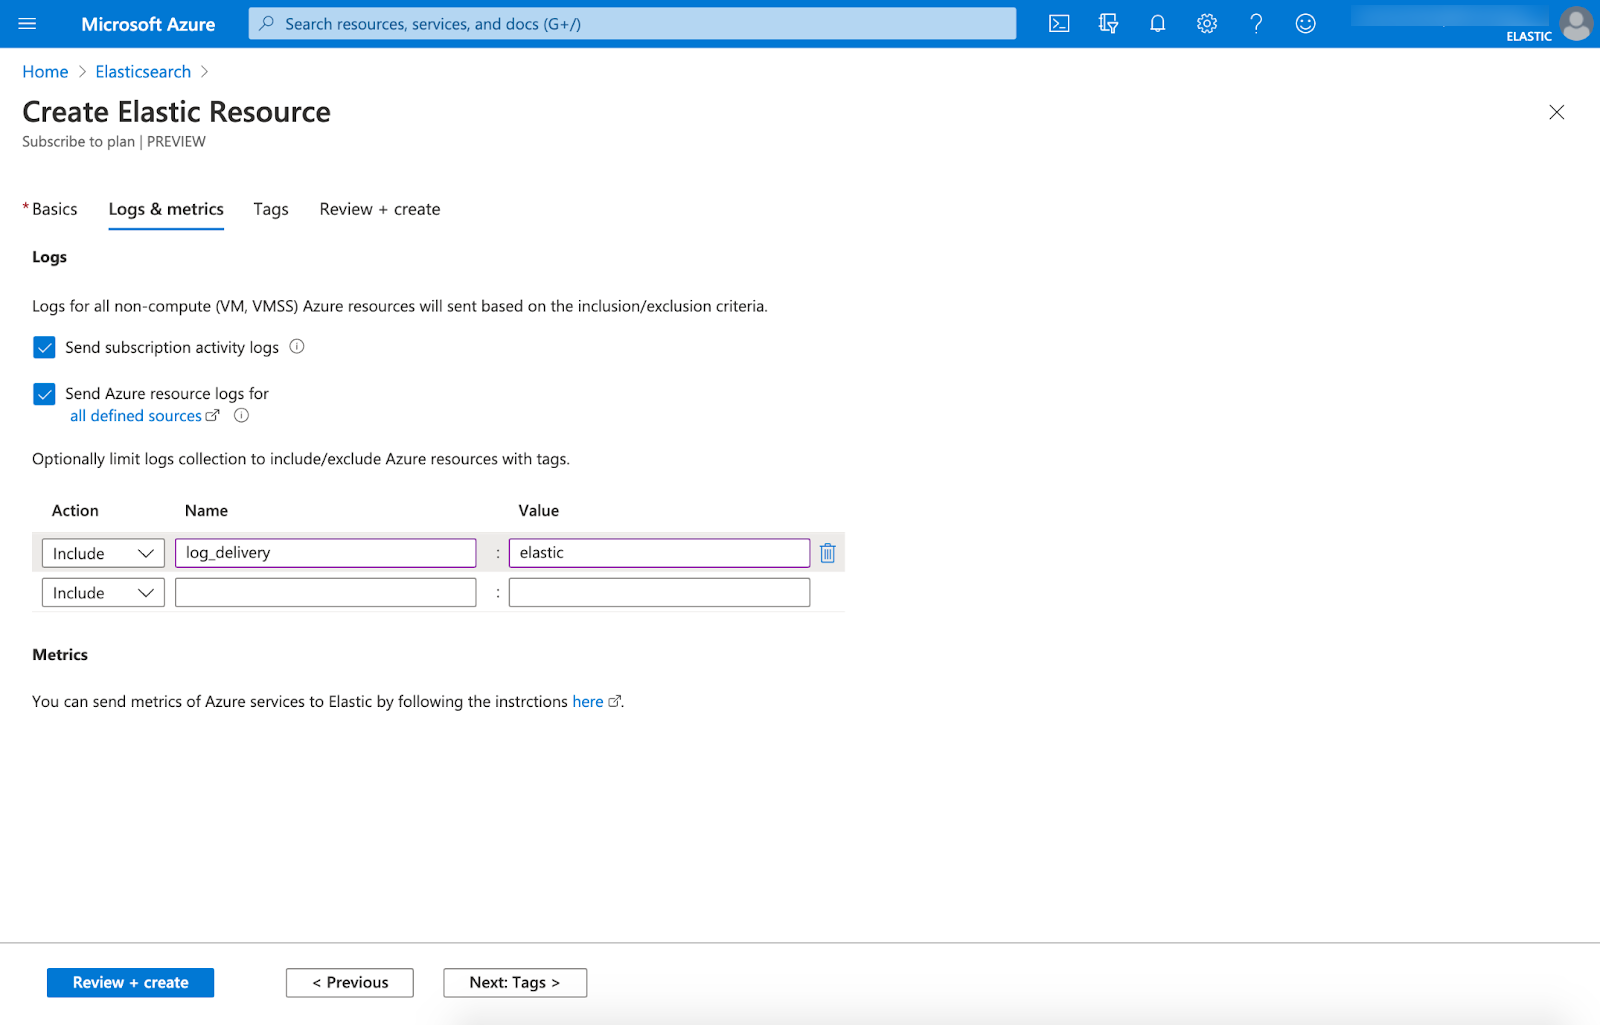
With this native integration, users can now onboard logs and metrics from their Azure services to Elastic Observability with just a few clicks. This includes both compute services, like VMs and containers, and non-compute services, like Azure SQL Database and Azure Data Factory. Tag-based filters allow you to easily configure your setup to limit data collection to only specific resources. Finally, logs and metrics are automatically written in the Elastic Common Schema (ECS) format, making it easy to correlate data not just from your Azure infrastructure, but also data from non-Azure sources.
Fleet Server enables additional scalability and flexibility of ingest architectures
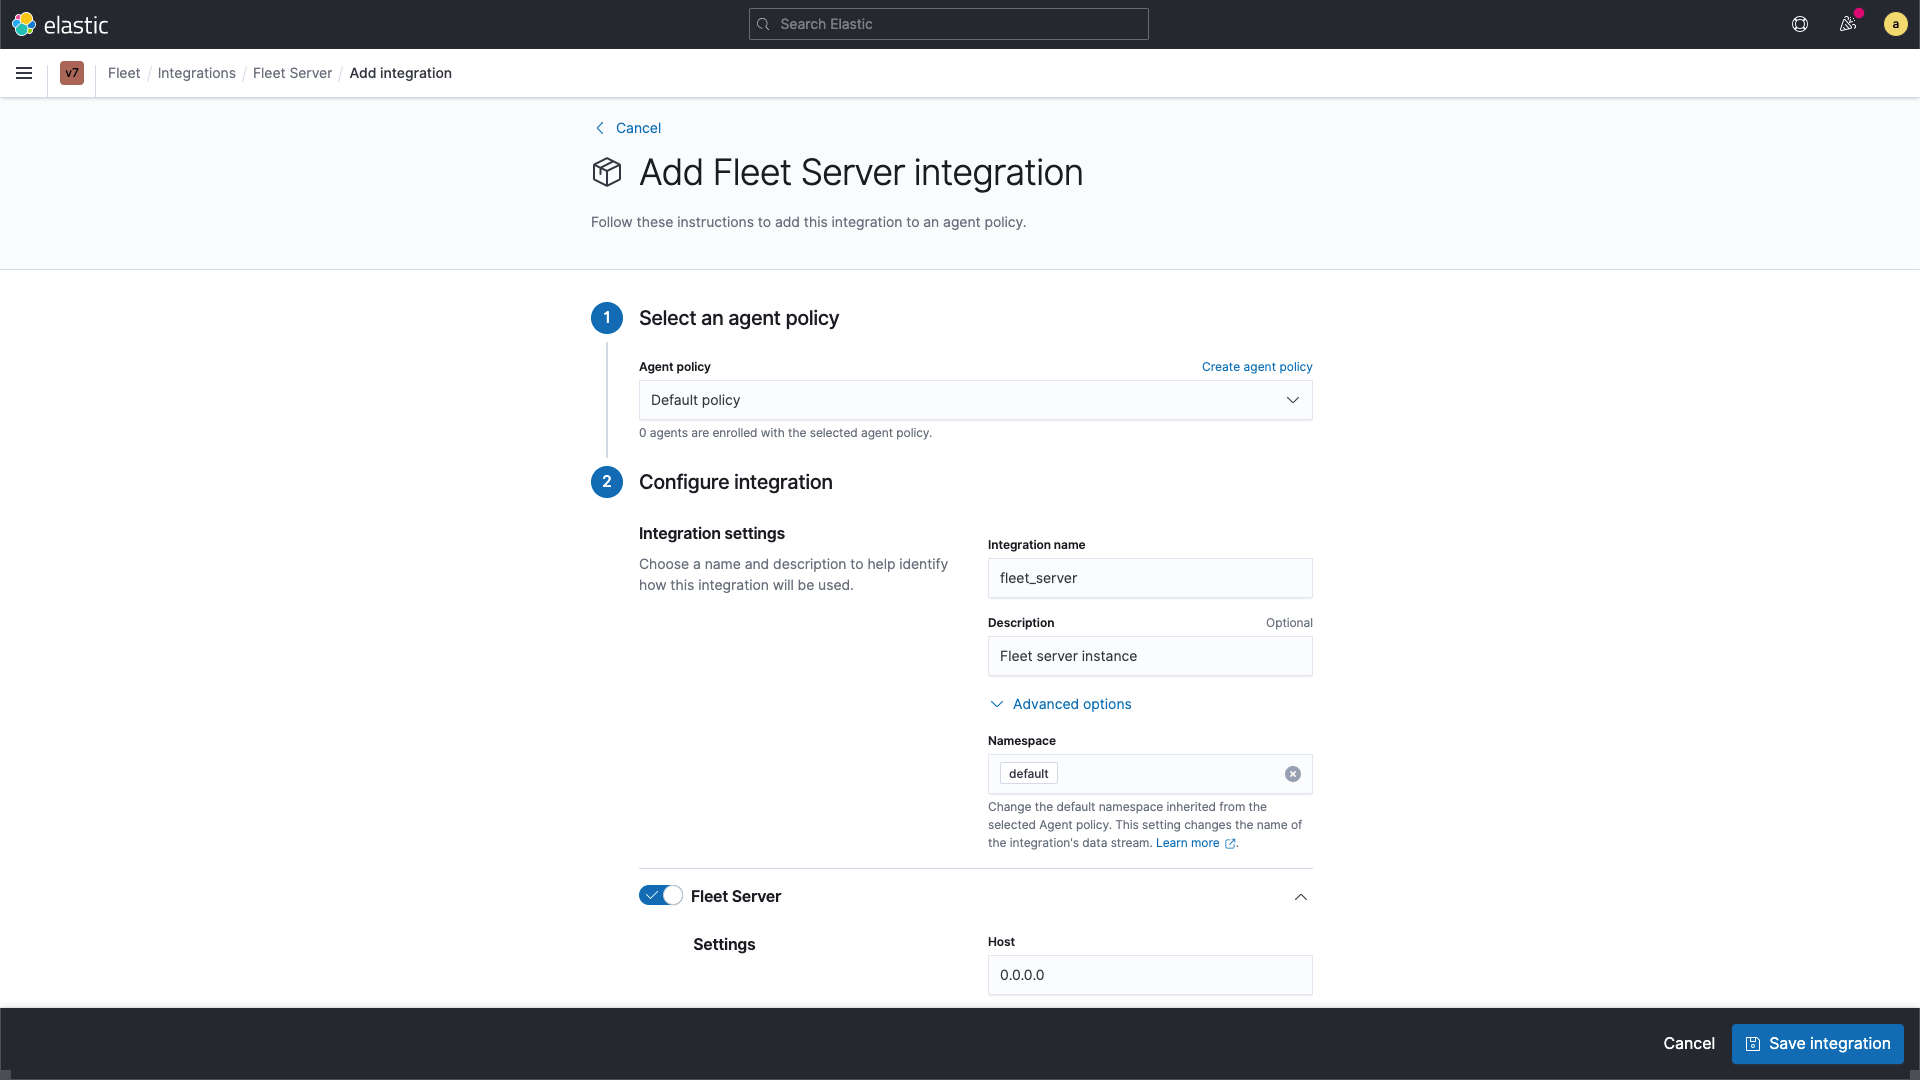
Elastic Agent is a single agent that unifies the collection of security and observability data, making the installation and management of data integrations easier. Fleet is a new app in Kibana that lets you centrally manage an entire fleet of Elastic Agents. Together, these improvements dramatically lower total cost of ownership and time-to-value for platform owners and users of Elastic Observability and Security.
Elastic Observability 7.13 features
- A new component, Fleet Server, which can be deployed centrally or at the edge, improving scalability and flexibility of supported ingest architectures.
- Auto-discovery support for Kubernetes, improving ease of deployment in highly dynamic orchestrated environments.
- Support for APM server, allowing users to centrally manage APM Server via Fleet.
- Support for Heartbeat, our uptime monitoring engine, enabling users to enable proactive HTTP, TCP, and ICMP (ping) checks via a graphical interface.
All of these functionalities are available with Elastic Stack 7.13 in Elastic Cloud, with the fully managed and hosted Fleet Server functionality as part of your deployment.
Note: This is a beta release and is not recommended for production deployments. Early version testers should review the release notes for breaking changes.
Time comparison and enhanced APM service instance views speed up root cause analysis
The improved APM Service Overview page introduced in version 7.12 streamlined troubleshooting workflows by presenting all relevant information about service performance in a single, comprehensive view, with a clear purpose: faster root cause analysis to lower MTTR. We are excited to introduce several new enhancements to the Service Overview page to further this goal.
- Time comparison view allows users to quickly do a direct comparison of current and historical behavior. For instance, they could overlay today’s performance with yesterday’s performance, or last week's performance to the week prior. Such time comparisons are a common stop in an investigative workflow, and can help users quickly spot deviations from past behavior.
- Scatterplot view visually shows instances by latency and load distribution, and can reveal which instances are behaving differently under load.
- Enhanced instance panel now breaks down services by instance, providing per-instance metrics and trends so you can quickly identify which instances might be contributing to service issues without leaving the Service Overview page.
In addition to the Service Overview page improvements, we are also improving the APM agents to better support cloud frameworks, which means that agents will be able to automatically pick up application dependencies on common cloud services like DynamoDB, Amazon S3, SNS, SQS, CosmosDB, Azure Storage, Azure Queue, Azure ServiceBus, etc.
But wait, there's more
Native OpenTelemetry support in APM Server is now GA, Elastic Agent can output to Logstash in standalone mode, a new exploratory data view based on Lens provides a user-friendly, low friction way to work with front-end user experience and RUM data, and the synthetics agent enters beta.
Read about these capabilities and more in the Elastic Observability 7.13 release notes, and other Elastic Stack highlights in the Elastic 7.13 announcement post.