What's new in Elastic Observability 7.12: APM correlations and native support for OpenTelemetry
Version 7.12 of Elastic Observability is here! Speed up root cause analysis with correlations in Elastic APM. Monitor low-power devices with ease with ARM support in Beats and Agent. Simplify ingest architectures with native OpenTelemetry support — now for traces and metrics — in Elastic Observability. Lower your total cost of ownership with autoscaling in Elastic Cloud and searchable snapshots in the frozen tier. These are only a few of the things you can look forward to enjoying in 7.12.
Experience the latest version of Elastic Observability on the official Elasticsearch Service on Elastic Cloud (a free 14-day trial is available). Or install the latest version of the Elastic Stack for a self-managed experience, and use many of these features in the free and open tier.
And now, without further ado, let's dig into a few of the highlights.
Automatically surface the top contributors to slow applications and errors with correlations in APM
Elastic APM introduces correlations — a new capability that analyzes application transactions with high latencies or errors, and automatically surfaces factors (like service version, infrastructure metadata, etc.) that are highly correlated with those underperforming transactions. With this capability, users can instantly zero in on the root cause of poor performance during reactive troubleshooting workflows, helping reduce their mean time to resolution. It also aids in proactive workflows, helping application owners identify areas of improvement to continually improve the end-user experience.
For example, it might surface that a particular service version is highly correlated with slow performance. Or that a particular customer is overrepresented in transactions with errors. These insights are highlighted in the APM UI and help engineers narrow down next steps of their investigation.
Built on the significant terms aggregation in Elasticsearch, APM correlations compare the tags on those transactions with high latencies and errors to the full transaction set, and automatically identifies tags and metadata that are “uncommonly common” in the suboptimal transactions — in other words, elements that are significantly more common in suboptimal transactions than in the full transaction set. The default threshold for slow is the 75th percentile, but can be customized. Tags included in the analysis are custom labels, infrastructure, and service version for backend services, and custom labels, OS, and client type for frontend services.
Read more about this and other APM updates in the documentation.
Keep up with dynamic demands — automagically — with autoscaling on Elastic Cloud
Many Elastic customers like Audi choose Elastic Cloud to run and manage their Elastic deployments because it significantly simplifies operations with features like one-click upgrades, deployment templates, and more. We are excited to introduce autoscaling to Elastic Cloud, making it an even more attractive choice for organizations. Autoscaling was one of the most requested features from the observability community, who were looking for easy ways to keep up with dynamic demands, without overpaying for max capacity.
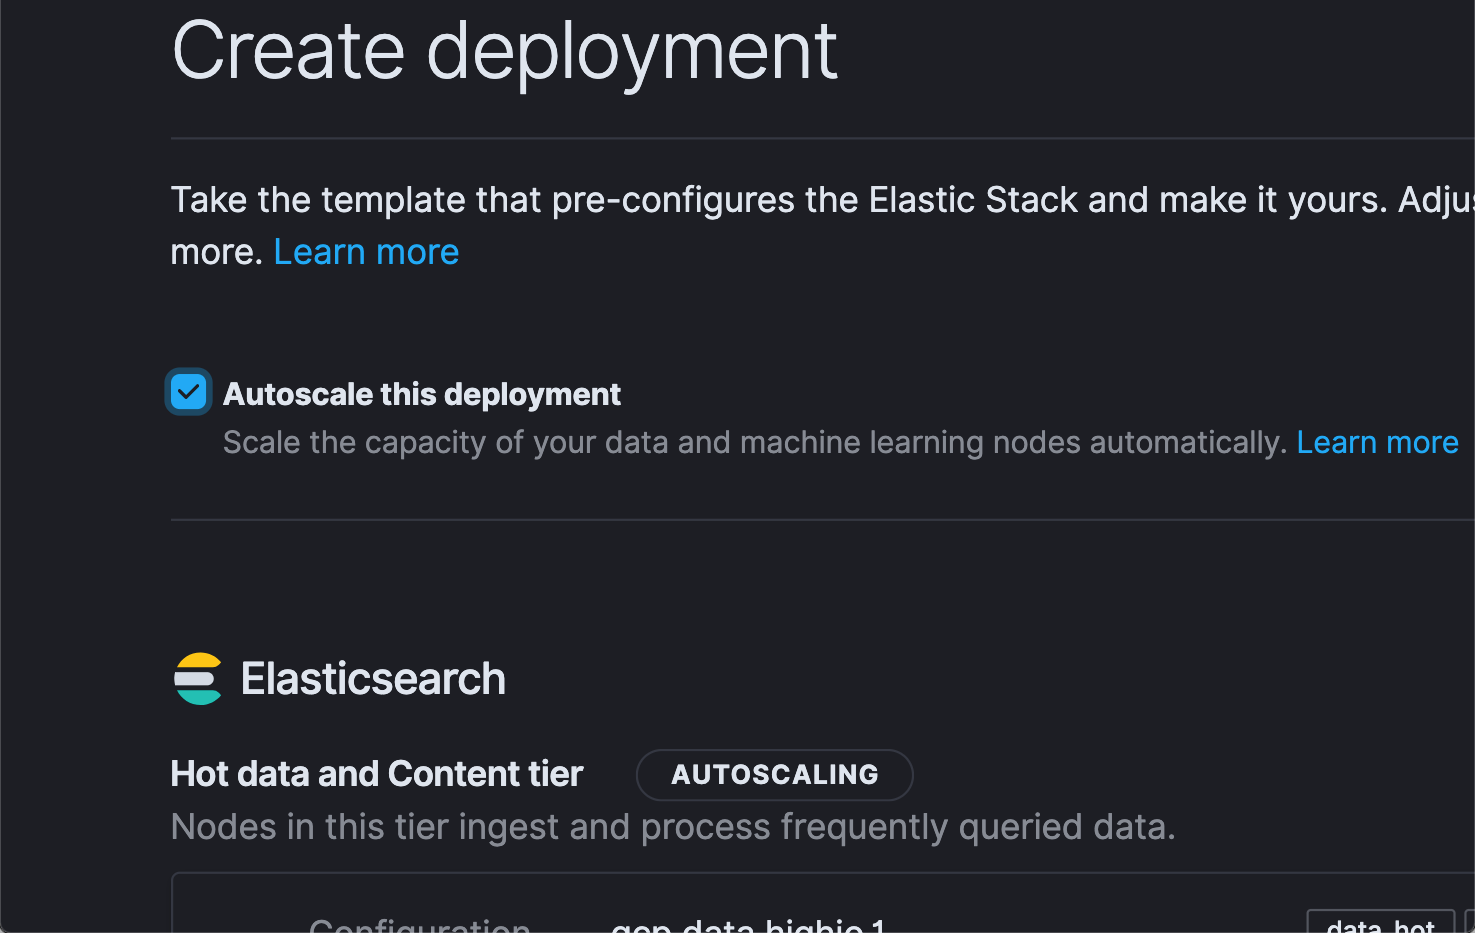
Scaling your cluster up and down has always been easy on Elastic Cloud — just move a slider or make an API call. With autoscaling, we are making it even simpler. Turn on autoscaling (via a check box in the UI or programmatically via API/CLI call) and Elastic Cloud will automatically scale capacity to keep up with dynamic demands on the cluster. Users can also set max thresholds to avoid surprises.
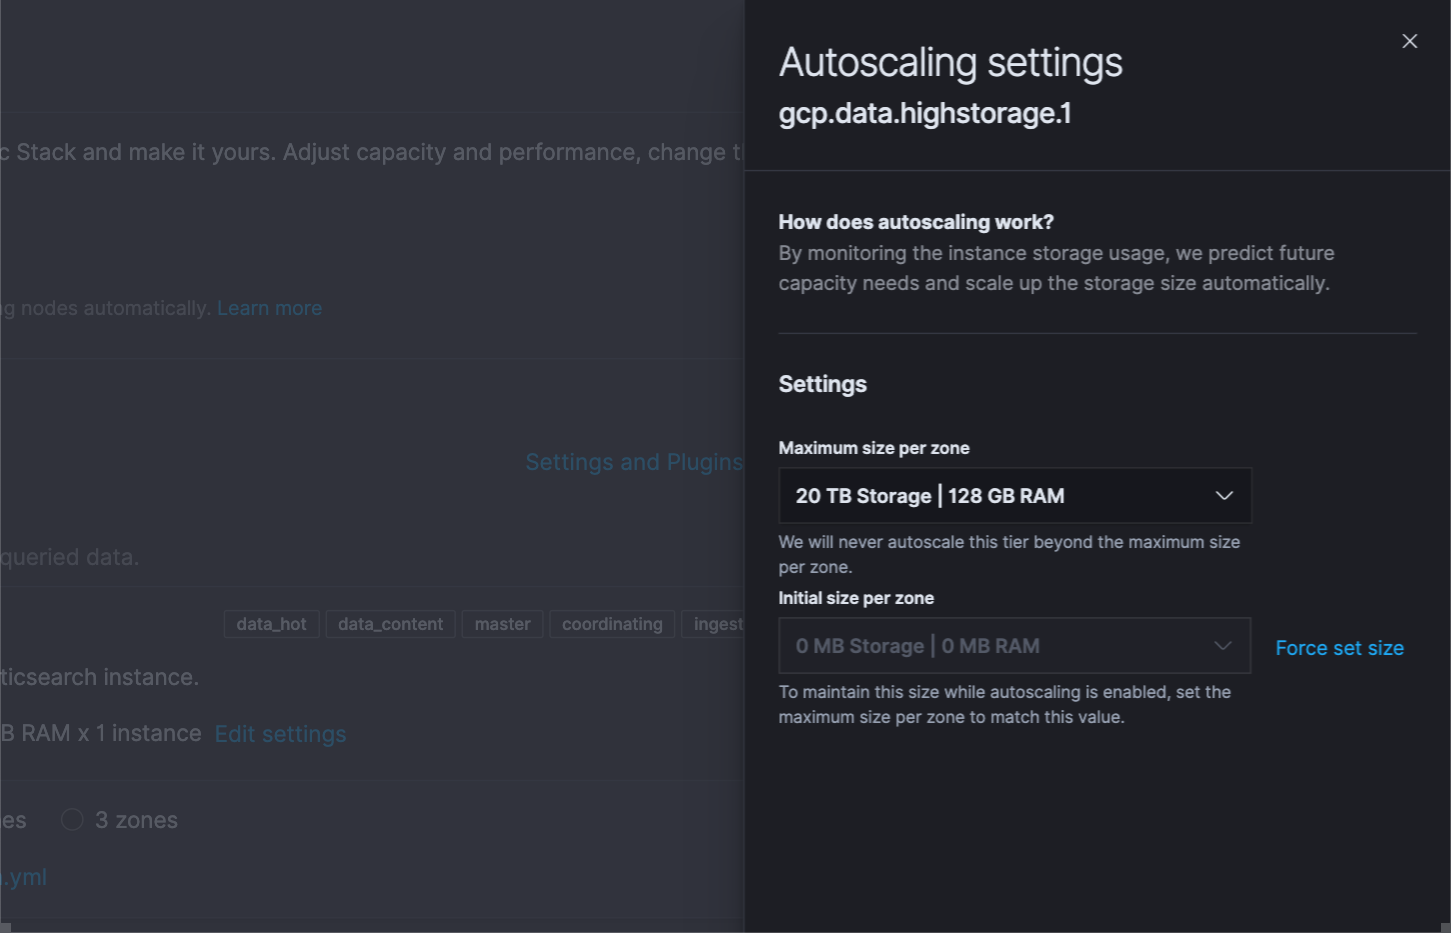
Autoscaling is currently available for data storage and machine learning nodes, and will be expanded to other node types in the future.
Read more about these updates in the what’s new in Elastic Stack post.
Monitor your ARM-based infrastructure with support for ARM in Beats and Agent
ARM architectures have long dominated the mobile and IoT device market because of their power efficiency and portability. In recent years, ARM has been gaining traction in server-side cloud computing as well. AWS has introduced several ARM-based EC2 instances; Microsoft and Google Cloud appear to be joining the trend soon.
Keeping in line with our philosophy of “being where our users are,'' we are excited to launch support for ARM-based architectures across the Elastic Stack, including Beats and the Elastic Agent. Customers with servers or devices running ARM can now use Beats or the Elastic Agent to collect health and performance data to monitor their endpoints. Many users are just dipping their toes into ARM-based compute, and are in hybrid environments. Now these users can monitor their ARM infrastructure alongside the rest of the infrastructure in a unified stack.
Special shout out to the IoT community, which has organically embraced the Elastic Stack as a flexible and scalable platform for edge monitoring. Now these users can run Beats and Agent on the edge, further simplifying their ingest architectures.
Native OpenTelemetry support
OpenTelemetry is emerging as the standardized collection layer for observability data and is designed to enable organizations to instrument their apps in an open and vendor-neutral manner. We are pleased to announce native support for OpenTelemetry to Elastic Observability, enabling organizations to directly send data collected by OpenTelemetry agents to their Elastic deployments. Not only does this lower the effort for users to adopt OpenTelemetry into their existing Elastic architecture, but it also simplifies the architecture.
We’re excited to take another step forward in our support for OpenTelemetry. In July 2020, we released the OpenTelemetry Collector exporter for Elastic, a translation layer between OpenTelemetry agents and Elastic APM. With the addition of native support (marked as an experimental feature in 7.12), we remove the need to install and manage this extra component, and users can now directly send data from their OpenTelemetry agents to Elastic APM server.
Native OpenTelemetry support is currently available for Elastic Observability on self-managed standalone deployments, and will be available on Elastic Cloud and ECE soon.
But, wait there’s more
The frozen tier, now in technical preview, allows users to directly search data stored on low cost object stores like Amazon S3, Google Cloud Storage, and Microsoft Azure Storage. Imagine being able to search years of logs data without needing to rehydrate them from an archive.
And to improve the user experience for executing such long-running tasks in Kibana, we are adding “save search to background”. Now you are free to send your long-running queries to the background, which frees up Kibana for other analysis and exploratory work.
Read about these capabilities and other Elastic Stack highlights in the Elastic 7.12 announcement post.
The release and timing of any features or functionality described in this document remain at Elastic’s sole discretion. Any features or functionality not currently available may not be delivered on time or at all.