What’s new in Elastic Maps: Maps tailored to your geospatial data
Sysadmins, cartographers, and dashboard designers can now personalize Elastic Maps to create richer geodata stories.
The 7.14 release of Elastic Maps has the geo capabilities to highlight points of interest, hide unnecessary details, and help you explore new trends in your data.
Elastic Maps is available now on Elastic Cloud — the only hosted Elasticsearch offering to include all of its latest features. You can also download the Elastic Stack and our cloud orchestration products, Elastic Cloud Enterprise (ECE) and Elastic Cloud for Kubernetes (ECK), for a self-managed experience.
Simpler configuration and scaling in Elastic Maps Server
In case you missed it, the on-prem Elastic Maps Server, an offline version of the Elastic Maps Service to use with secure air-gapped settings or where internet connectivity is limited, has been generally available for a few months now. Since then, here are two improvements to tailor your deployments exactly right.
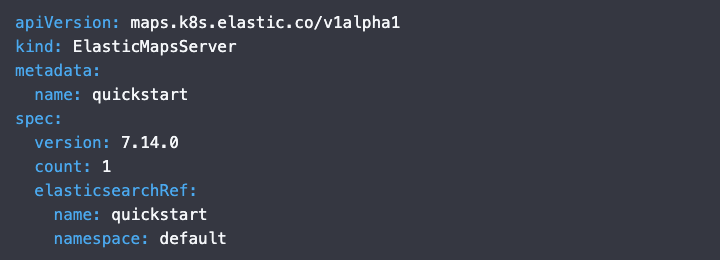
A perfect fit with Kubernetes
Delivering maps to your large Elastic Stack deployments just got easier with the Kubernetes integration of the Elastic Maps Server. Configure an ElasticMapsServer deployment in ECK, and Kubernetes will handle the scaling for you.
Dropping down a size (or two, or three)
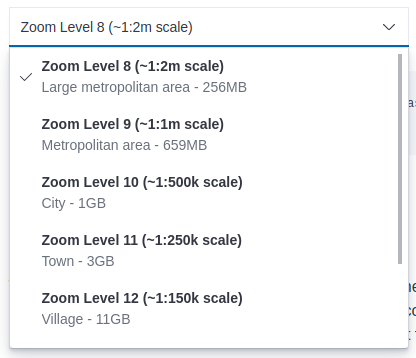
Sysadmins can now balance the Elastic Maps Server deployment size to the required level of detail of the maps. If the users’ maps are generally at smaller scales — for example, just showing regional data — there is no need to host (and download) the full 90GB image, which includes data at the largest building-level scale. Elastic Maps Server now offers multiple scale levels, from metropolitan level all the way to building level.
 |  |
More map adjustments
Accessorize your map with custom drawings
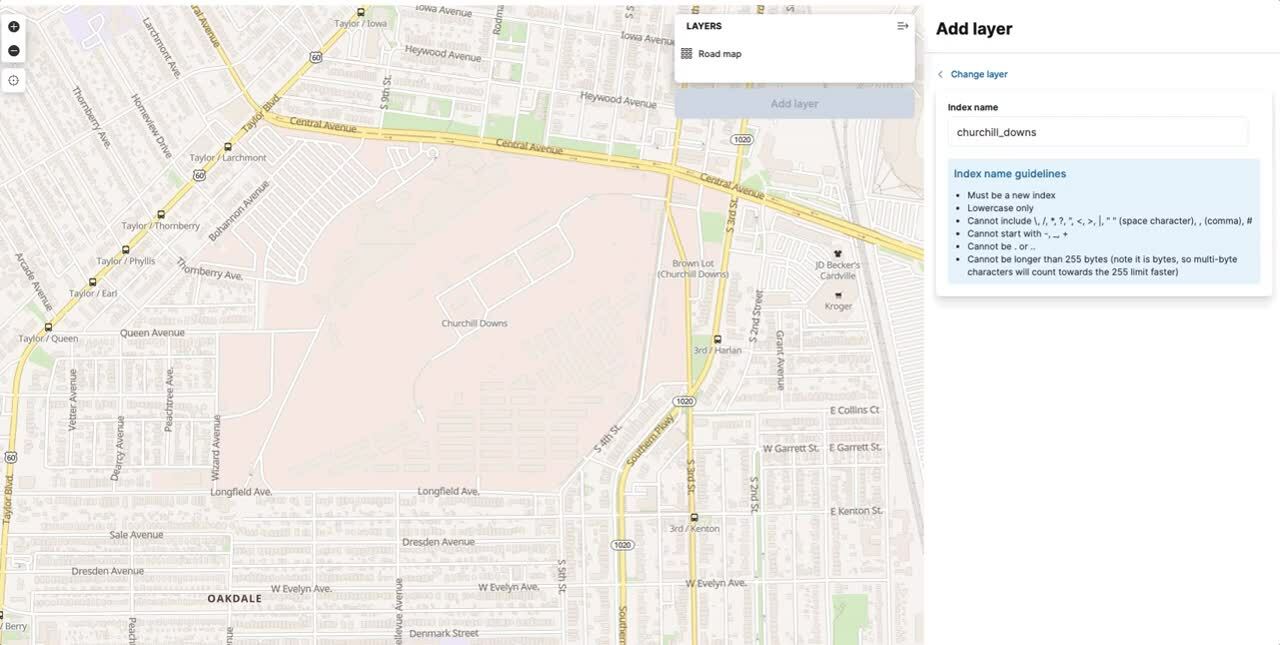
Use new drawing tools to add points, lines, shapes, and other geo-annotations to maps — the perfect way to draw attention to areas of interest or have users place pins on the map. You can also use these drawing tools for setting up geofencing alerts. These annotations are stored in an Elasticsearch index as regular documents, so you can use them as you would any other geo-feature; use them as spatial filters or improve the cartography with custom styling.
Hem in your data on a dashboard
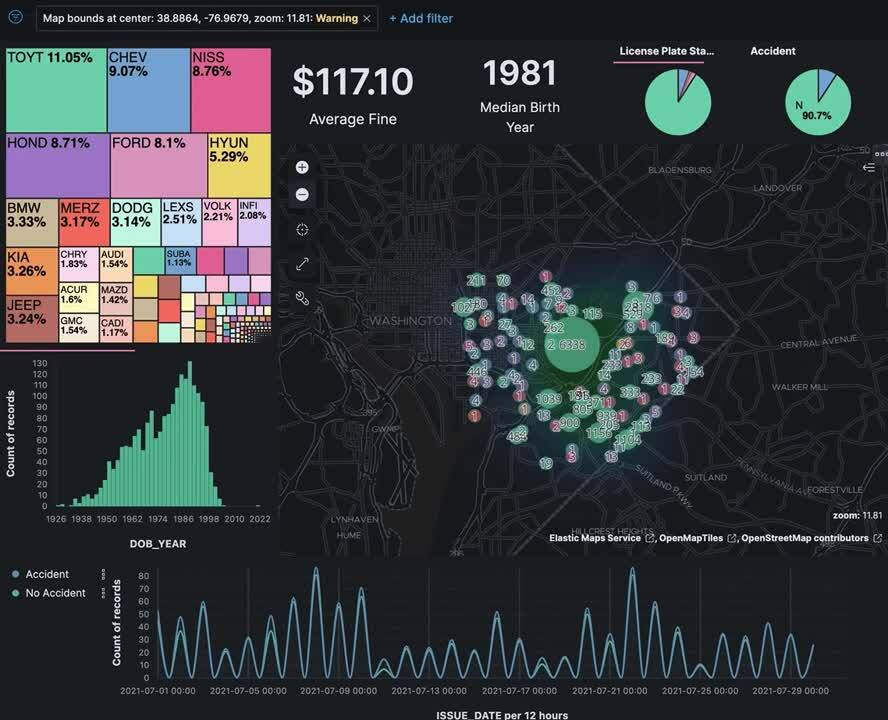
Users can now configure a dashboard to automatically update as users navigate on the map, effectively constraining the data-bounds of the chart to the bounds of the map.
To enable, use the “enable filter by map extent” setting on the map panel in the dashboard.
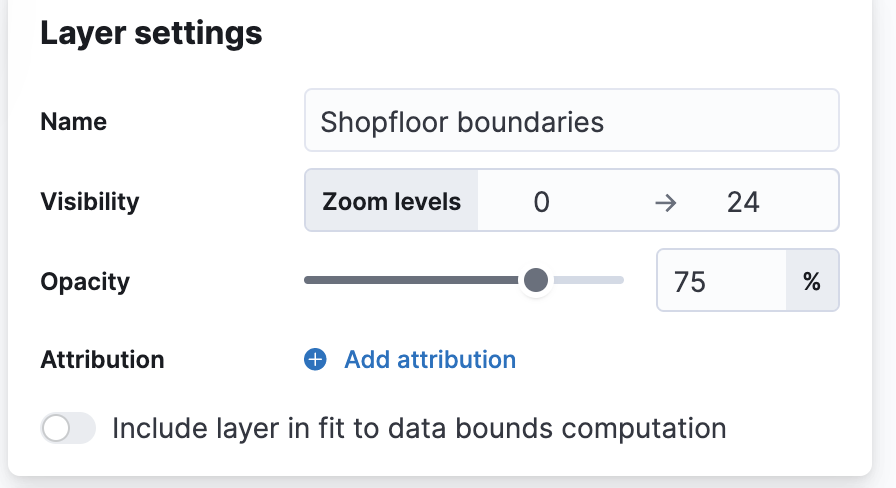
No more loose-fitting maps
There are times when a layer is just contextual background data and not the actual core business data you want a user to focus on.
Turn off the “Include layer in fit to data bounds computation” in the layer settings and the map will no longer include the data-bounds of that layer, only taking into account layers directly relevant to the user instead.
No alterations required: New no-click and one-click maps
The Elastic Maps app is the main tool to plot your geographic data. That’s great. It does require you to know ahead of time that (1) your data has a geographic component to it, and (2) that there is such a thing as the Elastic Maps app in the first place. If you made it this far, the answer to (2) is of course, but as for (1), is your data mappable, does it have a geo-component? This is one of those rare occasions that if you have to ask, the answer might actually be “yes.”
In multiple applications, Kibana now will lead you to the right map, automatically. No additional effort required.
Upload a file and explore an index pattern on a map
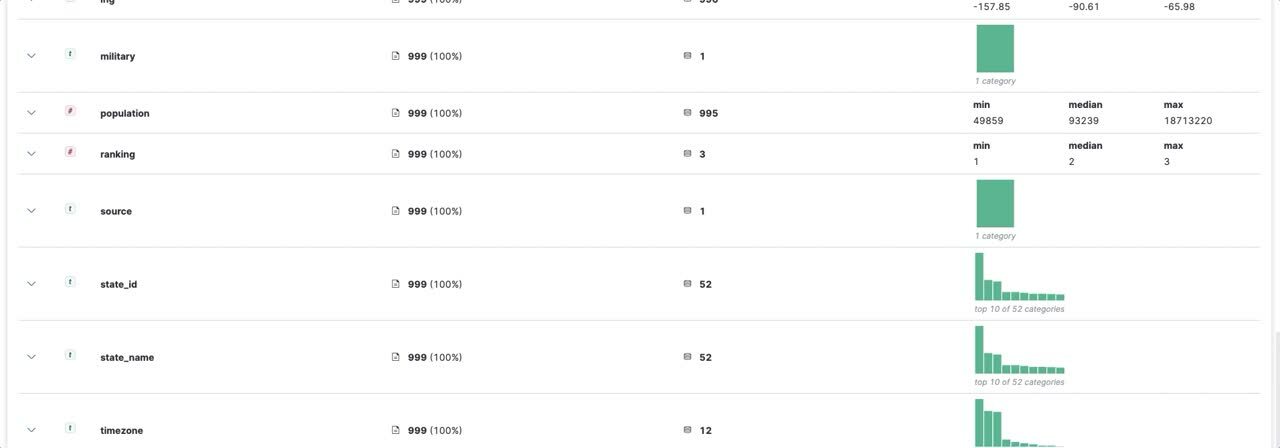
The Data Visualizer and CSV file upload applications will now preview your data on a map for fields that can be linked to known geographic entities of the Elastic Maps Service.
For example, upload a CSV file with state-identifiers as one of the columns and immediately get a map showing the distribution of your data geographically.
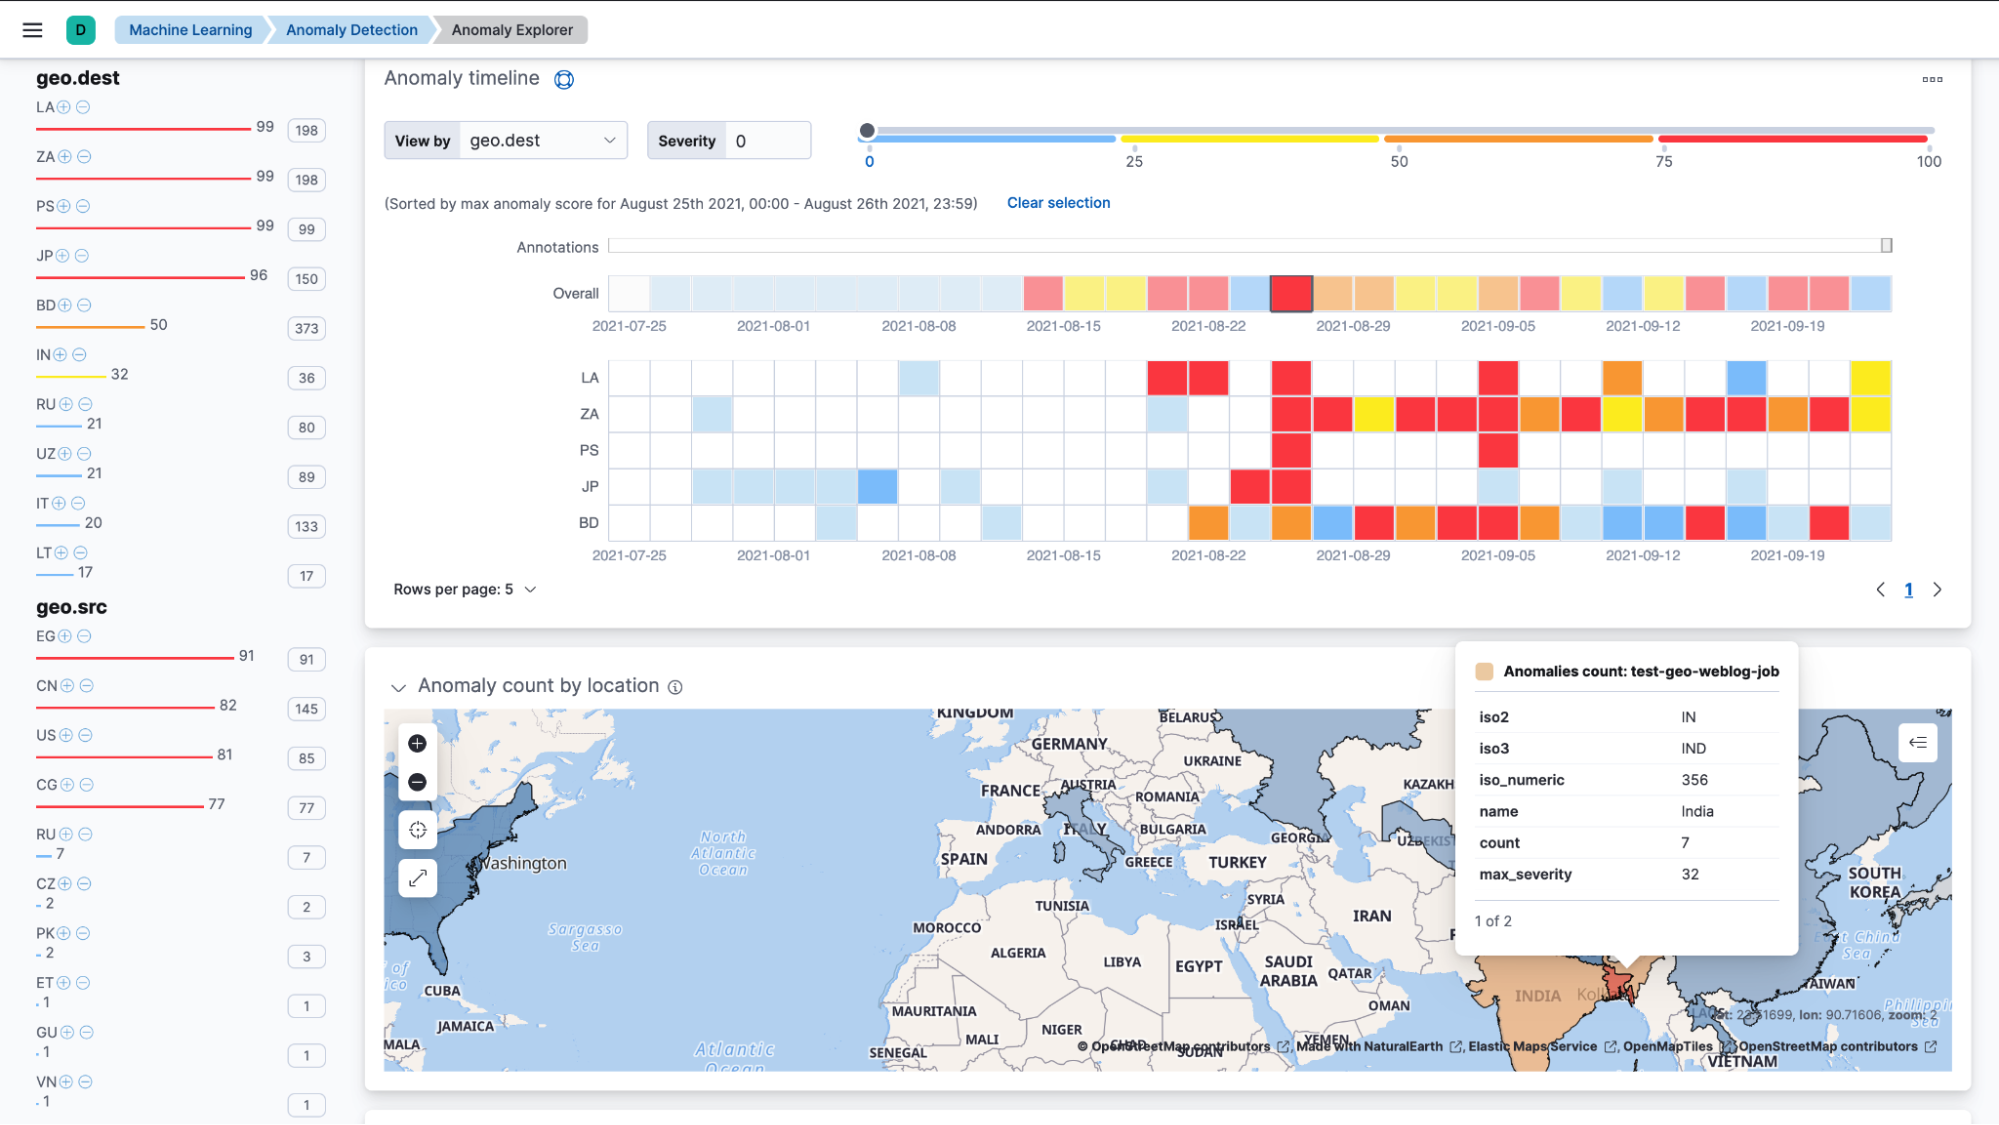
Mapping anomalies
The machine learning anomaly detection feature already had embedded maps, showing the geographic distribution of outliers, and these got even better in 7.14. If your detection job partitions the data by a well-known geographic boundary (such as countries or regional boundaries), a choropleth map will help you see the distribution of results by those partitions.
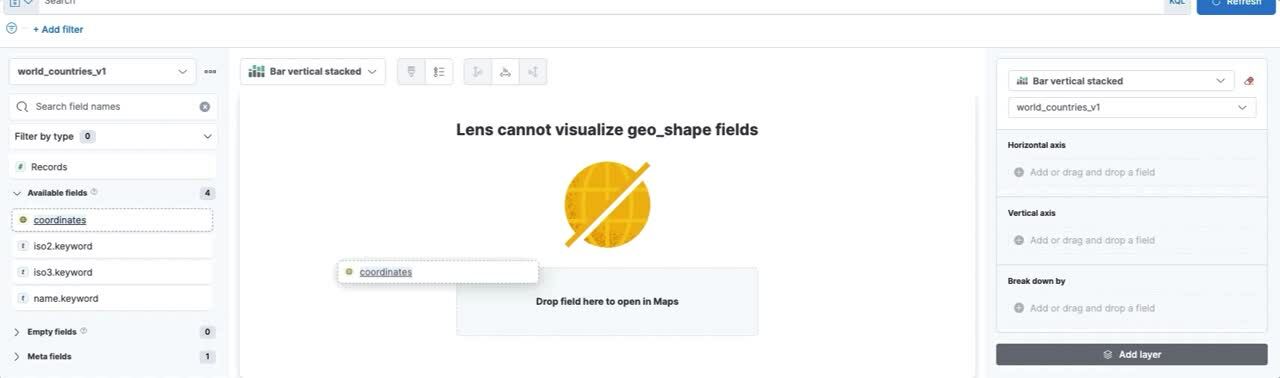
One-click maps with Kibana Lens
Kibana Lens is the quickest way to create a chart for your data — and now, that includes your geo-data as well. Dragging a geo-field immediately takes you to the Elastic Maps app, creating a visualization. All it takes is one click.
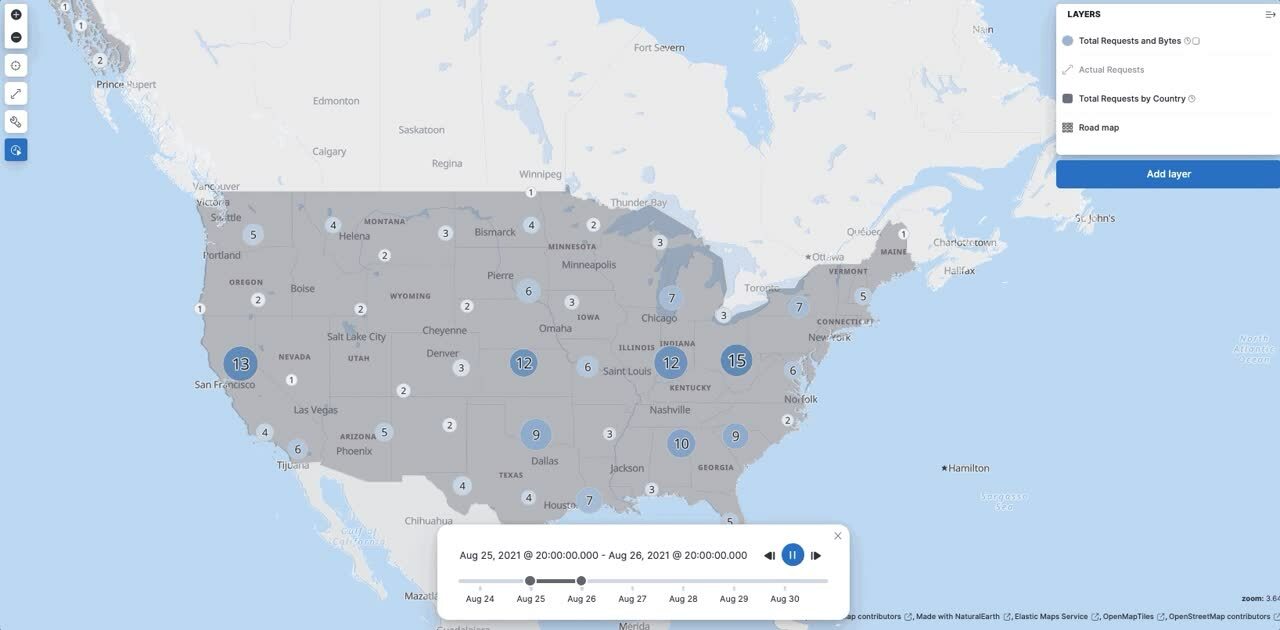
…and time slider to relive trends
We touched on it in the time travel post, but we can’t end this post without calling it out. The Elastic Maps app now has a built-in time slider. Explore your data now in both time and space together.
Give it a try
Want to take Elastic Maps for a test drive? Pick up a free 14-day trial of the Elasticsearch Service, or you can download it as part of the default distribution.