Using search analytics to strengthen ecommerce solutions

 Share on Twitter
Share on Twitter

 Share on LinkedIn
Share on LinkedIn

 Share on Facebook
Share on Facebook

 Share by Email
Share by Email

 Print this page
Print
When it comes to delivering exceptional results to customers, having an understanding of all the tools at your disposal will give you a leg up. Especially in these uncertain economic times, this is even more important as companies look to gain any advantage possible. Being able to convert browsers into buyers and customers for life by providing the best customer experience will truly usher in this advantage.
In addition to your business data, search analytics data from your ecommerce platform is critical to delivering an optimal customer experience. Every time a customer uses search on your site, they share critical information with you about what they want. With Elastic, these insights are at your fingertips and can help merchandisers improve their product mix and optimize sales.
What types of analytics matter to ecommerce companies?
When customers search your product and service offerings, they are telling you a story and providing immediate feedback on not only their user experience, but also on the quality of that experience. By building solutions with that feedback in mind, you’ll increase user sentiment and engagement. Search analytics are an untapped source of insights, and taking advantage of those insights will result in positive customer experiences.
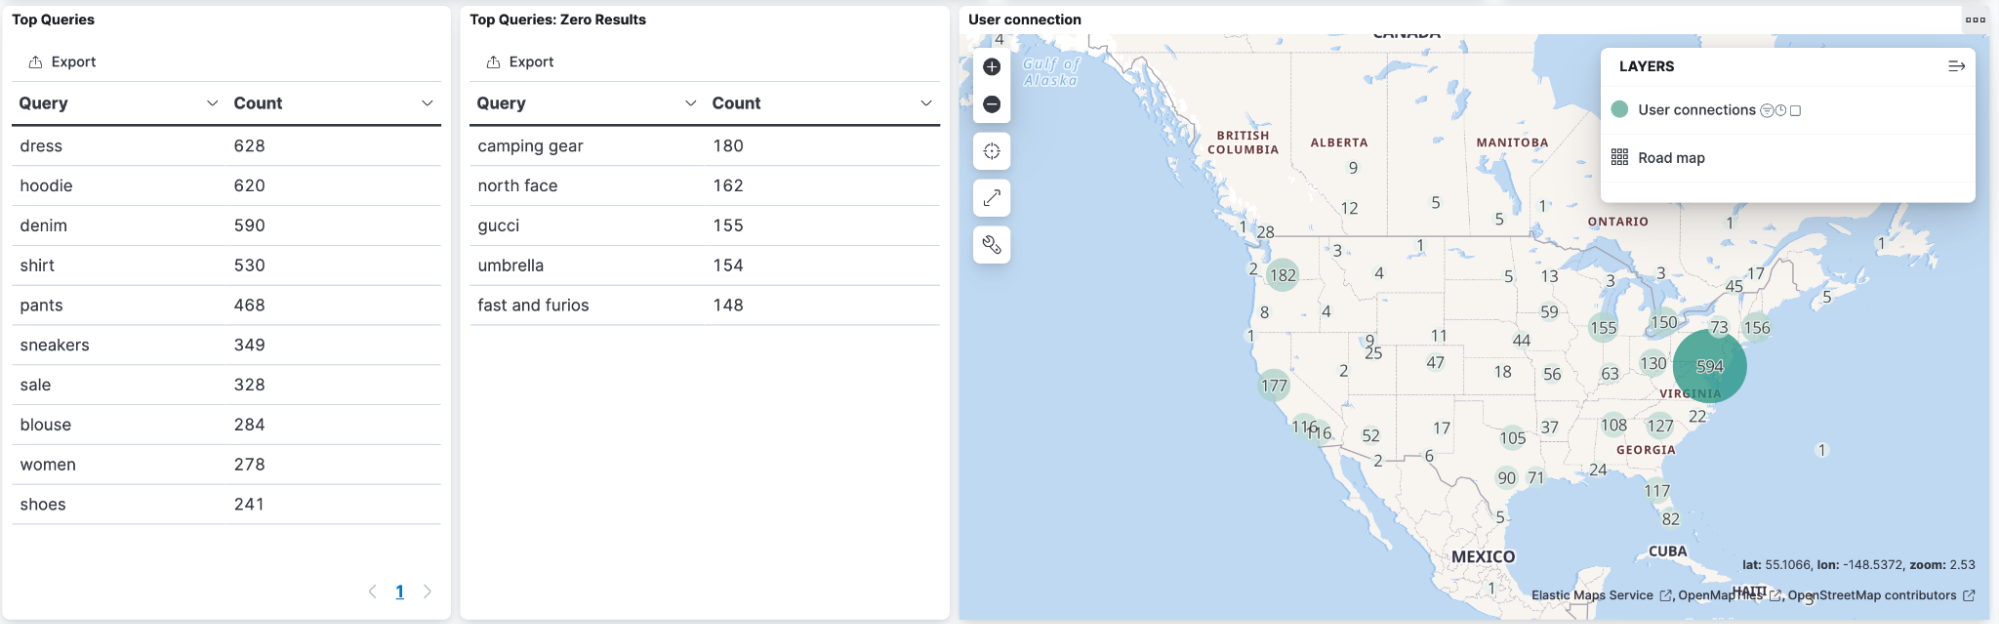
One important datapoint are top queries, which can be directly correlated to most interesting or trending items. These can provide useful information, especially when considering additional metadata like user geography and other user profile information. For example, imagine the top queries in New York for your ecommerce site are “Adidas sweater,” “Jeans Levis,” and “North Face jacket.” This information will help you in building new marketing campaigns or sales strategies in the future.
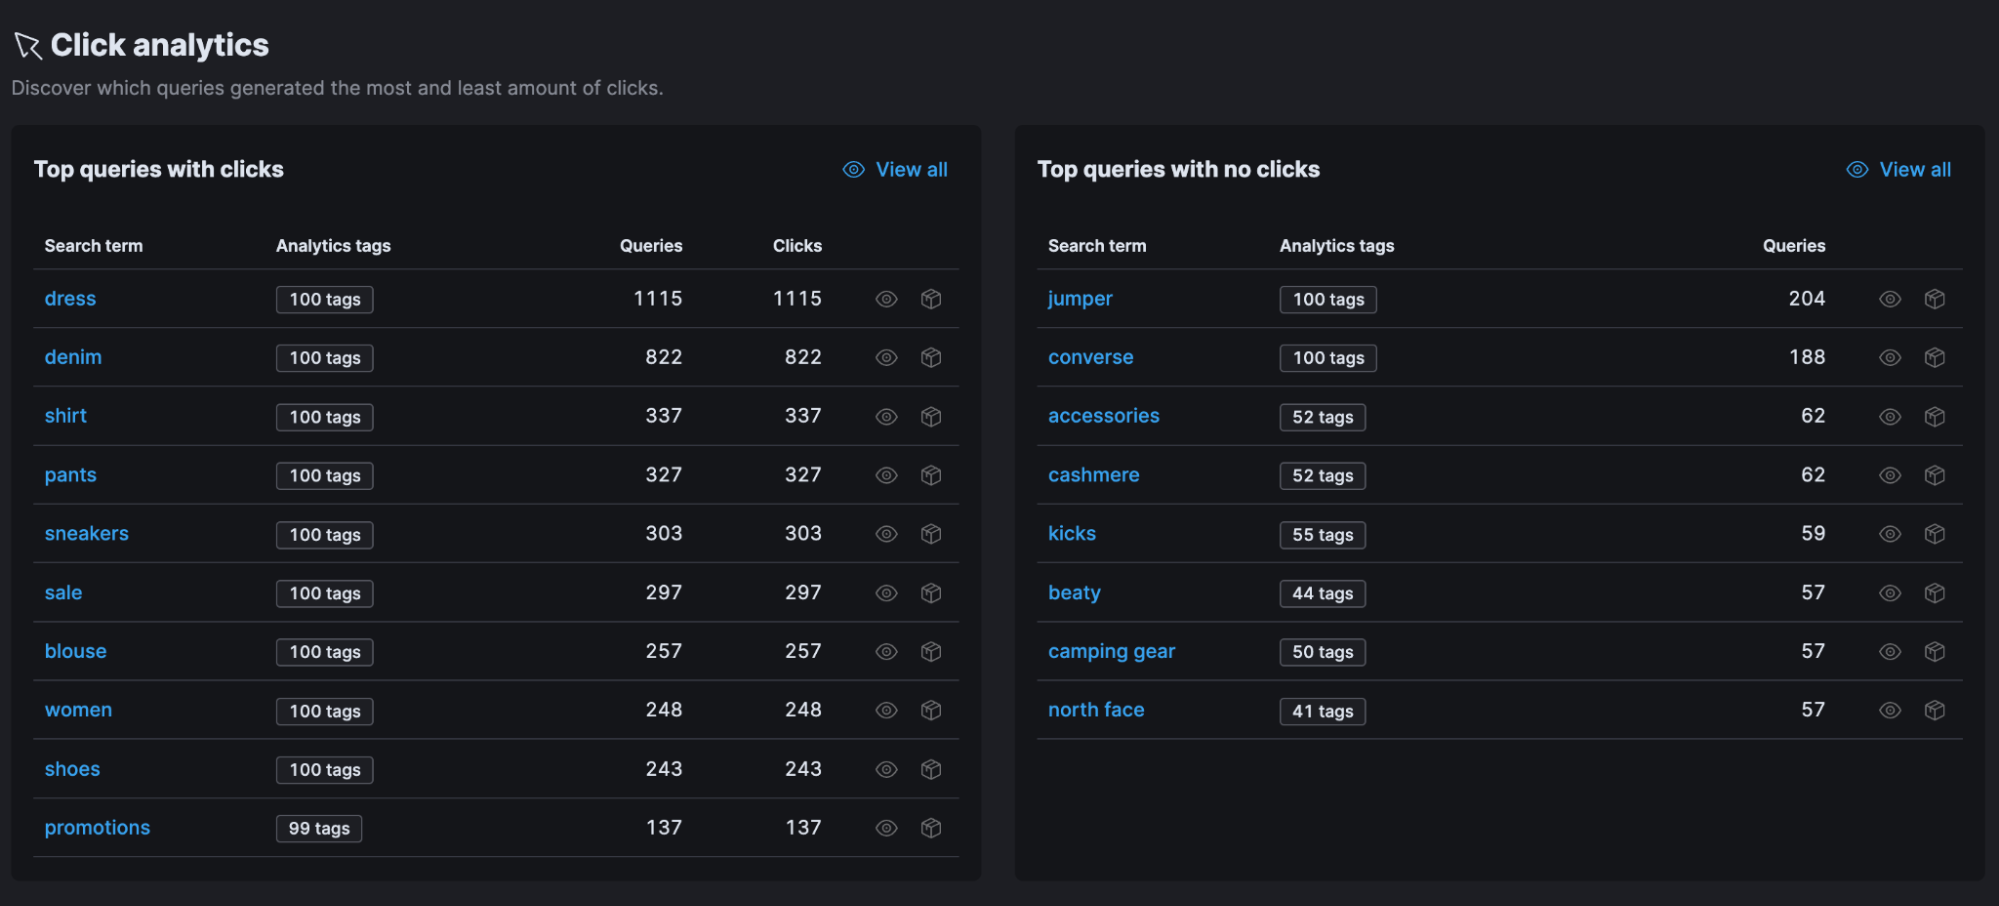
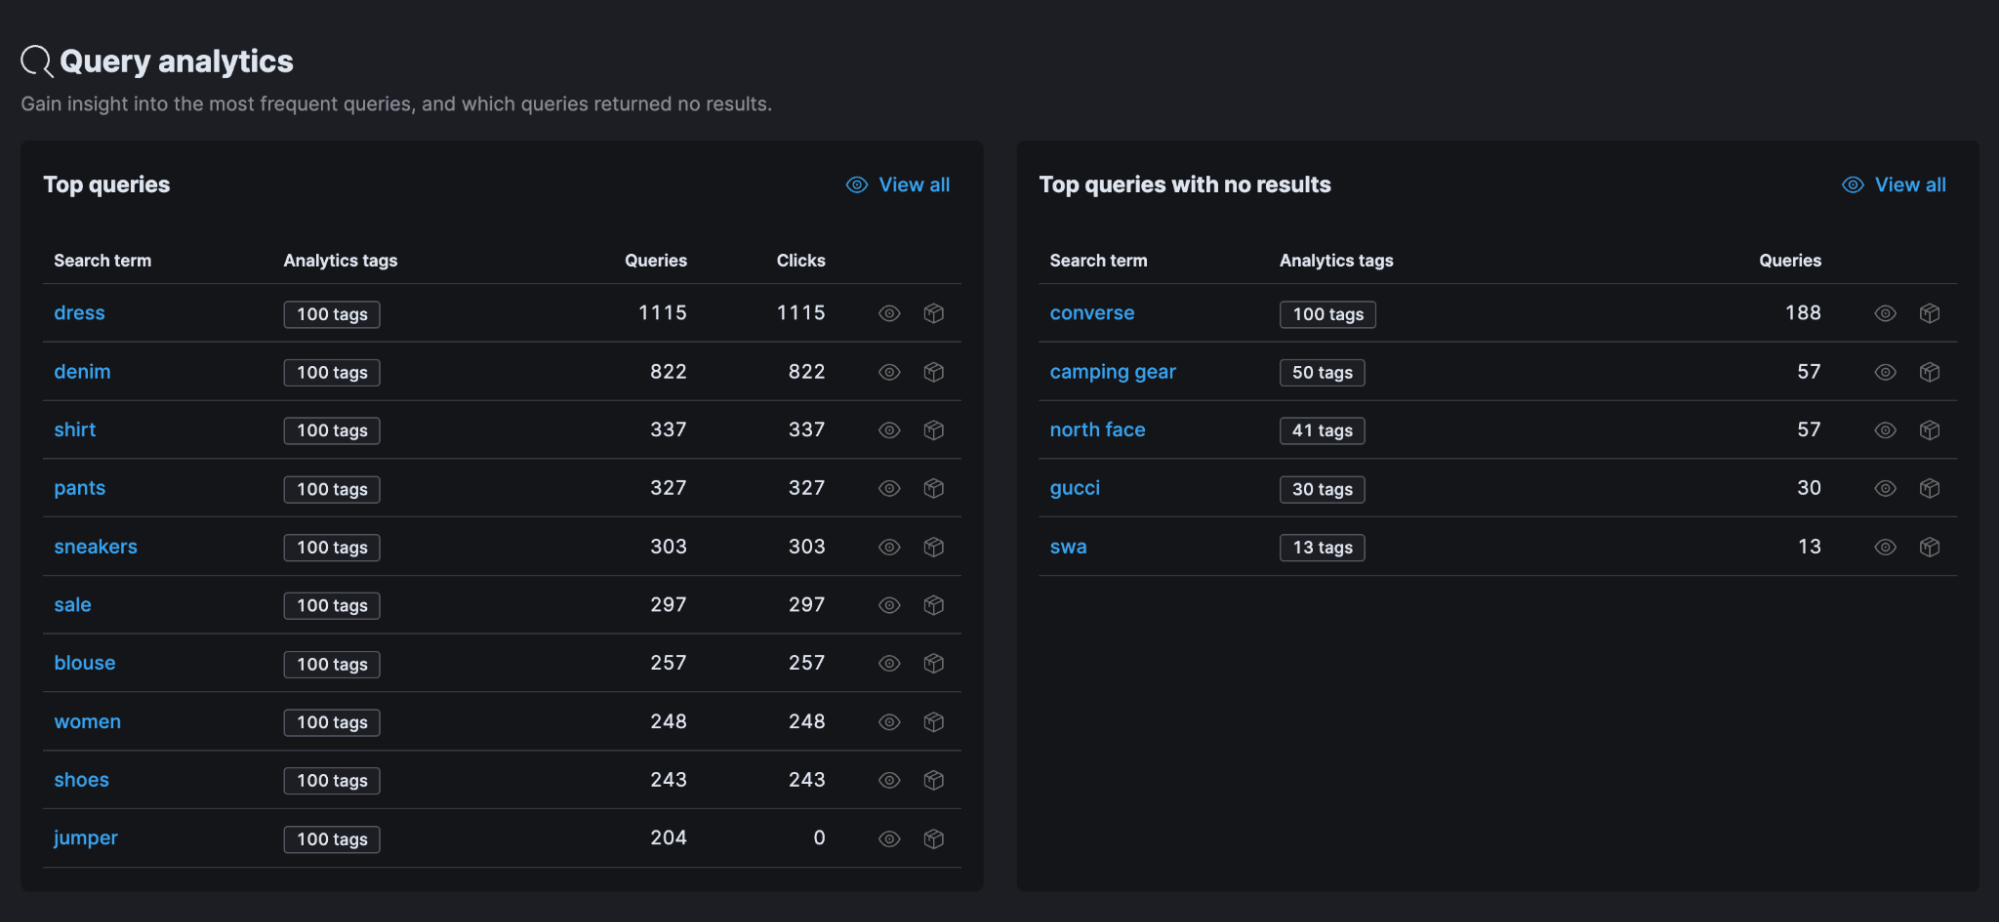
Top queries analytics are a great indicator, but they only tell the first part of a user's search story. Queries that return no results or that generate no clicks are a good indicator that there might be an issue with the relevancy model or missing products in the catalog. Basically, users can't find products they're interested in. You can even take this a step further by timing how long it takes them to interact with those results, as that can relay useful information as well. If you are using Elastic Enterprise Search today, these sort of analytics are available out of the box like below.
What does Elastic provide to help ecommerce customers innovate?
Good news, the indicators mentioned above are collected and presented out of the box using Elastic. As we can’t anticipate all the indicators that can matter to you, we designed the Elastic platform to let you enrich, transform, and display analytics as you wish.
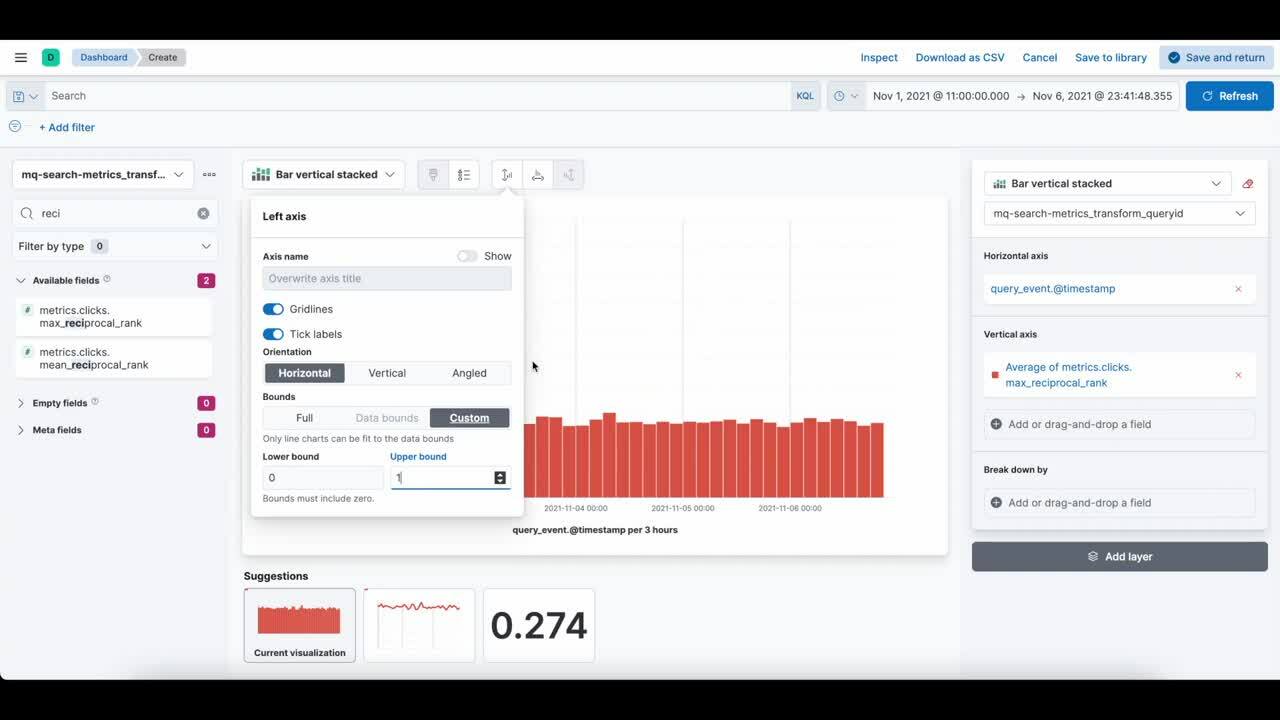
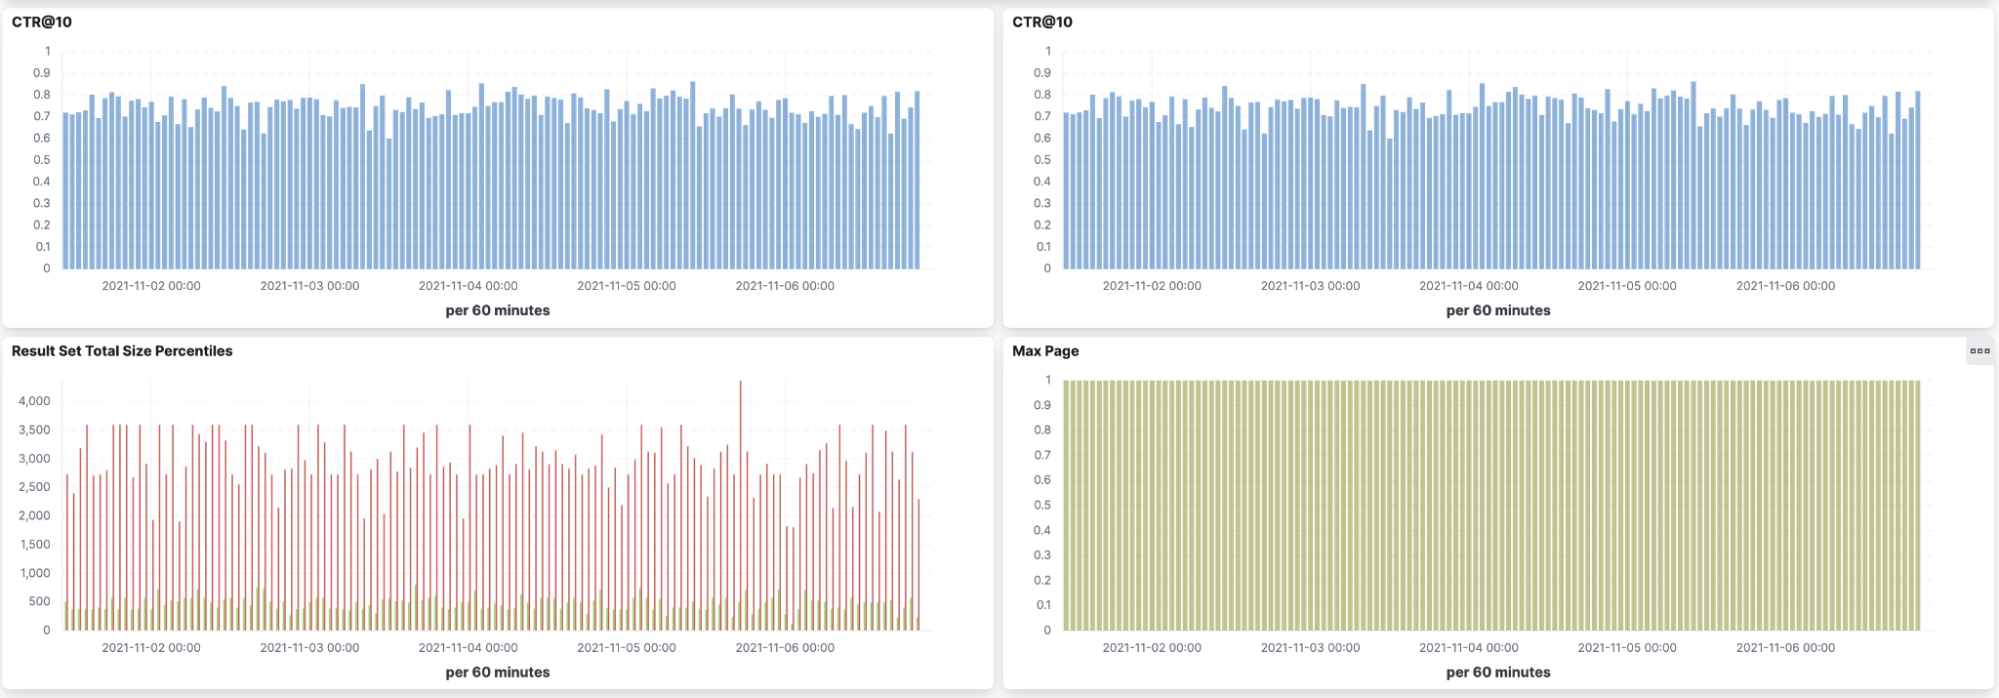
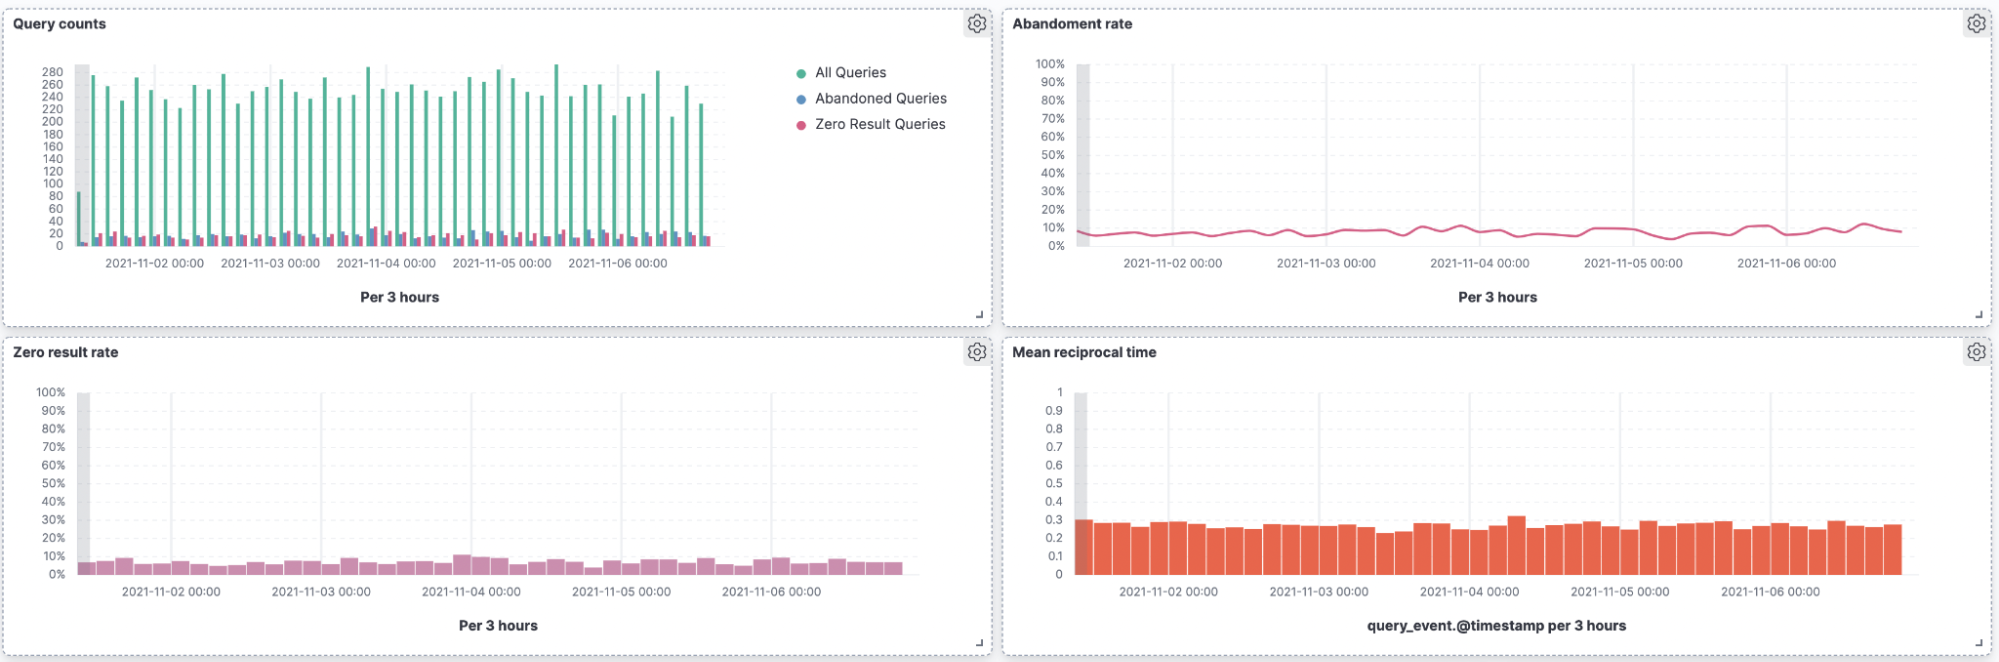
Using Elastic tooling, you can easily build advanced metric dashboards to monitor the performance of your ecommerce website. Some examples of metrics you could add to your dashboard are abandonment rate, click-through rate on first 10 results (CTR@10), and user geographic data.
Examples of visualizations ecommerce customers can build
What can developers do to enrich analytics to deliver business value?
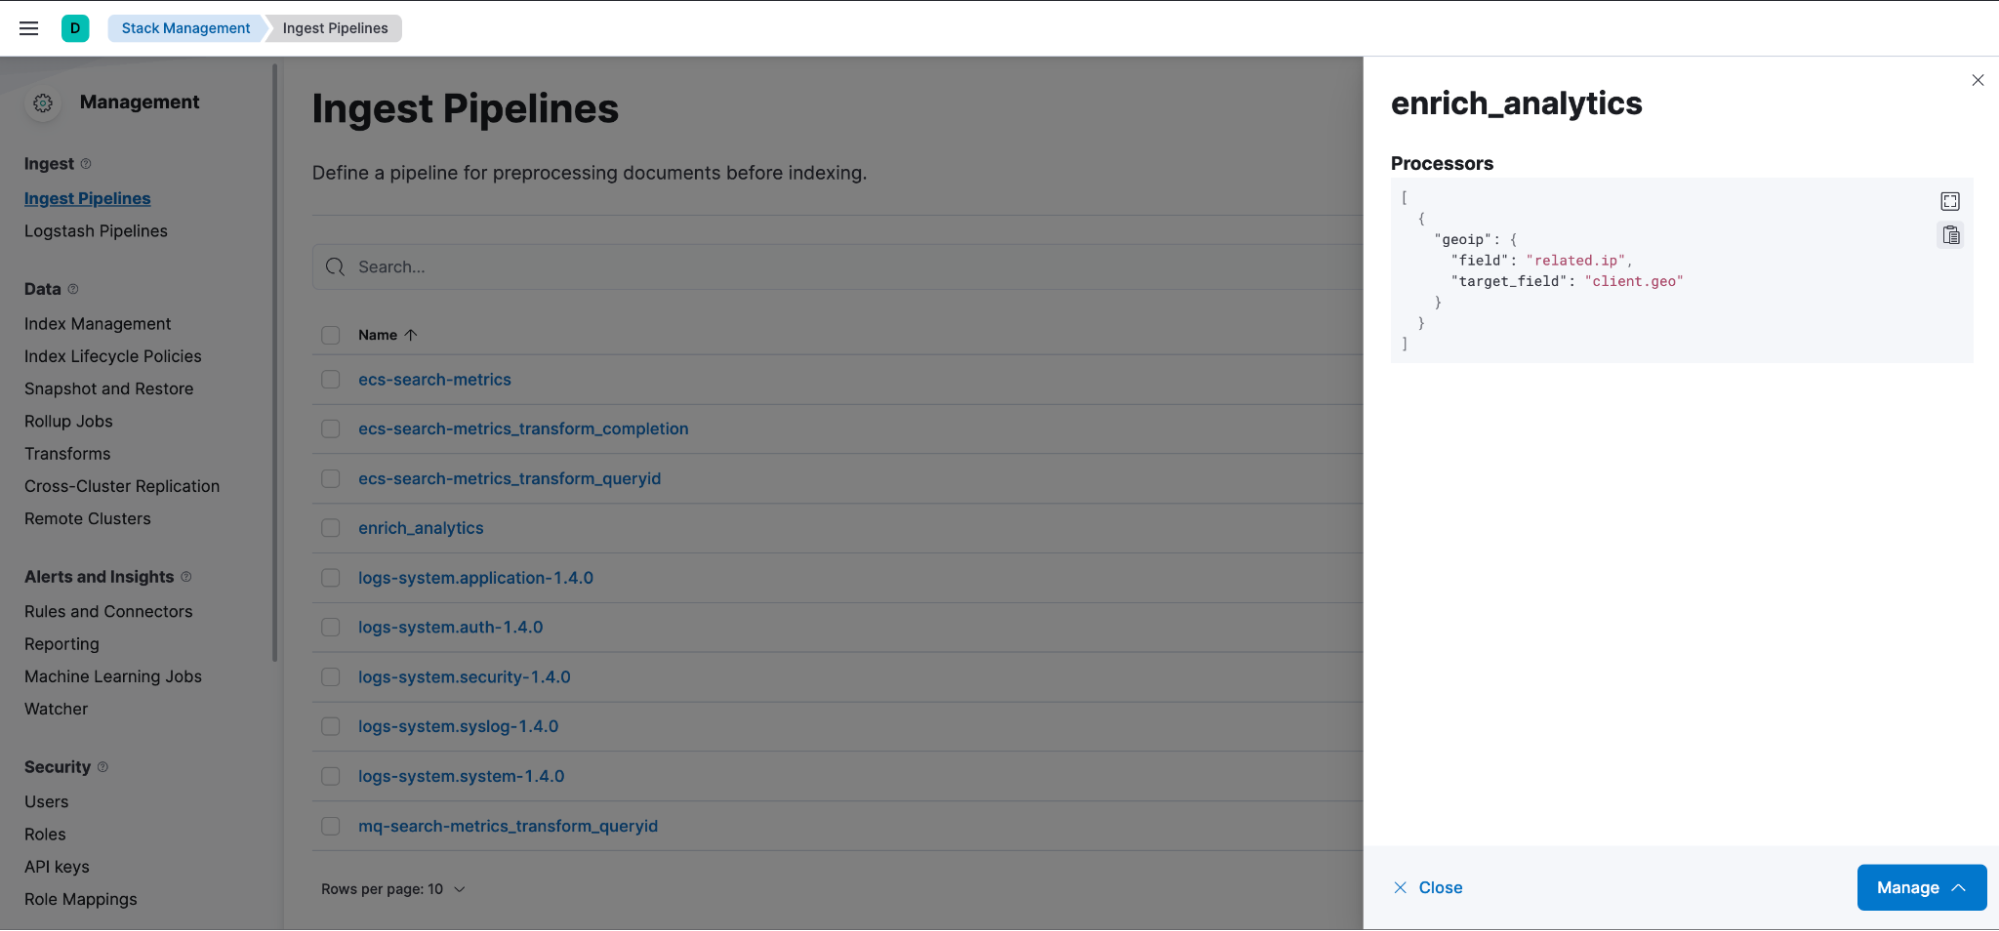
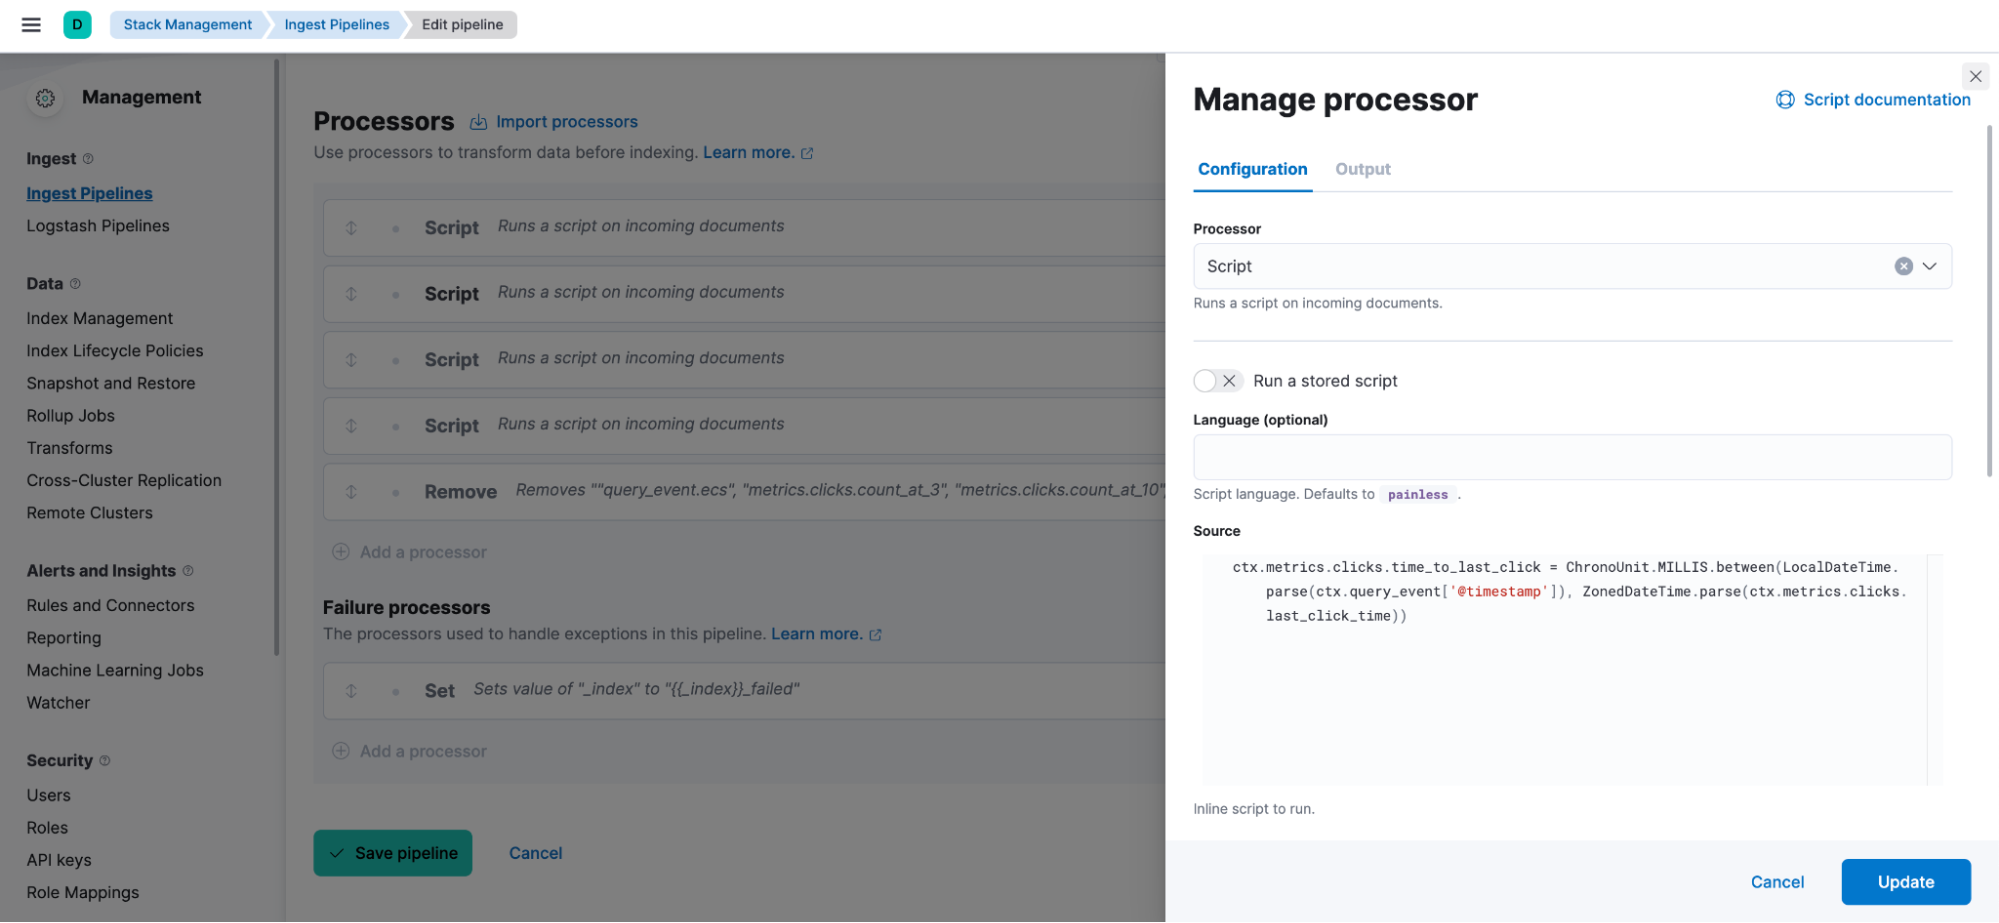
Building a dashboard using existing analytics data can be more complex. Let’s have a look at how you could enrich and transform collected analytics to fit your needs. For example, collected analytics contain client IP addresses by default. You could easily enrich the analytic event using an enrich pipeline to geo localize the application users, and then use this data to build a map visualization to better understand the impact of geography on sales.
Collecting and monitoring insightful metrics can be done in just one step as well as the ability to share these metrics within your organization, create reports to measure the impact of changes to the relevancy model, and generate new insights that can be rolled into new marketing campaigns or product offerings.
All of these visualizations can be created using Kibana which comes ready to use with Elastic. You can generate a link to any dashboard and share it with anyone for them to access the metrics. You can also generate CSV or PDF reports if you want to extract the raw data or have a report to share or archive. Finally, you can integrate Elastic with any third-party analytics tools, such as Tableau, by using the ODBC connector.
Get started building insights from your ecommerce data today
Elastic provides a full suite of solutions to empower companies to truly innovate and build powerful ecommerce customer experiences. We can’t wait to see the inspiring things you build with Elastic solutions.
Get started with a free trial of Elastic Cloud today to build a proof of concept and learn about all the valuable insights you can gain from your customers. If you’d like to learn more, download the ebook to see how Elastic is raising the search bar. Or, if you’d like, download the third-party survey of 1,000 customers conducted by Wakefield Research: Product over price: Personalization’s critical role in converting online searches into sales.
Share
- Share on Twitter
Share on Twitter
- Share on LinkedIn
Share on LinkedIn
- Share on Facebook
Share on Facebook
- Share by Email
Share by Email
- Print this page
Print