Troubleshooting guide: Solving 6 common issues in Kibana Discover load

 Share on Twitter
Share on Twitter

 Share on LinkedIn
Share on LinkedIn

 Share on Facebook
Share on Facebook

 Share by Email
Share by Email

 Print this page
Print
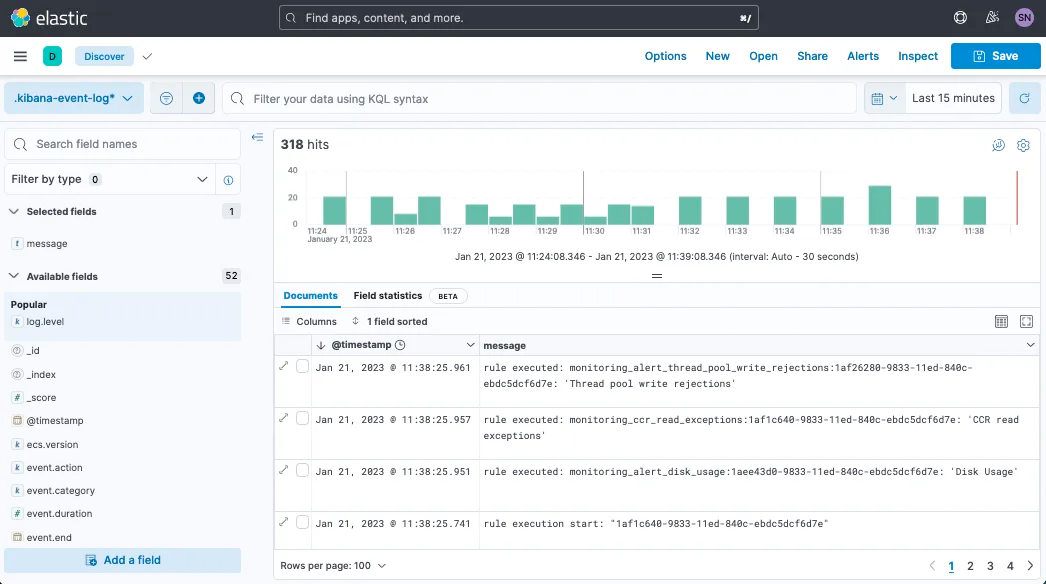
Discover is Elastic®’s core Kibana® UI to search, filter, and inspect (time series) data. Visualizations are used for data aggregations/summaries. The Discover UI is resilient to large data Elasticsearch® responses, but it can sometimes experience issues due to (uncompressed) response size, mapping explosion, and browser limits.
Below, we’ll summarize the most common historical issues, including long loads, time outs, and errors, and provide a sequential troubleshooting walk-through for solving them. Note: This article’s APIs are written to v8.6, but the general troubleshooting flow applies to earlier and later versions.
After establishing and loading a user session, Kibana will load Discover via base URI /app/discover (or its related Kibana Space specific URI). To load this page, the browser page will sequentially request three APIs from the Kibana server (and through Kibana to the below Elasticsearch server as needed).
Common issue 1: Page errors on load
If the Kibana page errors on load, you’ll want to open your browser’s network tab to confirm which sequential request ends up failing. You can share your findings by exporting a HAR log.
1. Load data view
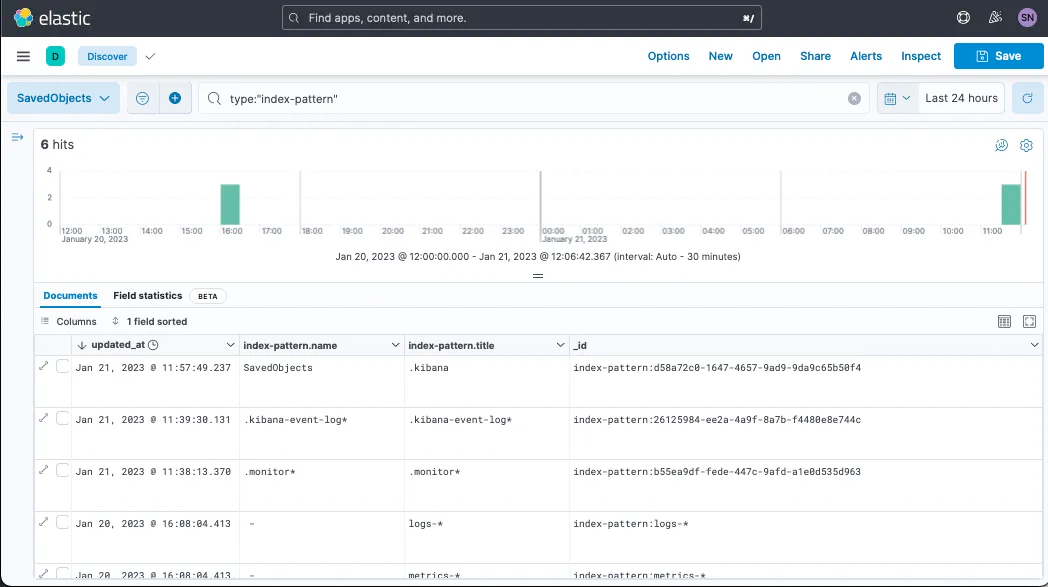
The browser page will request Kibana’s Saved Objects endpoint for the currently selected Data View (code still targets `type:index-pattern` as this object was named “Index Pattern” in earlier versions but was renamed in v8.0 for clarity).
POST /api/saved_objects/_bulk_get
[{"id":"${INDEX_PATTERN_ID}","type":"index-pattern"}]This Kibana API search-forwards to Elasticsearch API under the Saved Object’s backing Alias .kibana. I’m not certain on the query translation, but it’d be something like:
GET .kibana*/_search
{"query": {"bool": {"filter": [{"bool": {"should": [{
 "match_phrase": {"_id": "index-pattern:INDEX_PATTERN_ID"}
}]}}]}}}Note: Saved Objects look-up by the Data View’s id and not title or name. If you export/import or copy Saved Objects between Kibana Spaces or Elasticsearch clusters, you may have a Visualization/Dashboard/Discover error about your underlying id having changed during import (see the Saved Object’s import module to avoid). To demonstrate these fields’ difference:
Common issue 2: Missing data view
If this affects you, during page load, you’ll expect a bottom-right warning/error module similar to: "DATA_VIEW_ID" is not a configured data view ID
This error is reported in context of the current Kibana Space and does not qualify if the Data View does/not exist in a different Space.
2. Load fields
Next the Kibana UI will load a compilation of backing indices’ related fields.
API. First, it will API request:
GET /api/index_patterns/_fields_for_wildcard?pattern=INDEX_PATTERN&meta_fields=_source&meta_fields=_id&meta_fields=_index&meta_fields=_scoreThis API will re-trigger every time the user selects a Data View in the top-left. On the back end, Kibana is returning indices from Elasticsearch’s Field Caps API.
Common issue 3: Mapping explosion
This API’s response time is drastically impacted by mapping explosion, which can partially be diagnosed by this API’s un/compressed response size. Usually this will relate to how many varying Index Mappings are loaded, but it can also result from overriding Mapping limits. This usually returns (far) below 3s, but you should definitely consider ≥10s a slow.
Common issue 4: Field conflicts
Errors have historically occurred from field name conflicts between indices. You’d want to fix the underlying Index Mappings, but you can also apply a Runtime field as a temporary override to fix the stray indices’ mapping type.
JS. Once the API results return, if the left drawer (showing “Selected Fields” and “Available Fields”) is open, then the browser JavaScript will do summary analytics on these fields. If slow, this will appear in the browser Network tab as the API request ended but the following (3) request did not start attempting for multiple seconds. Users normally only notice ≥10s.
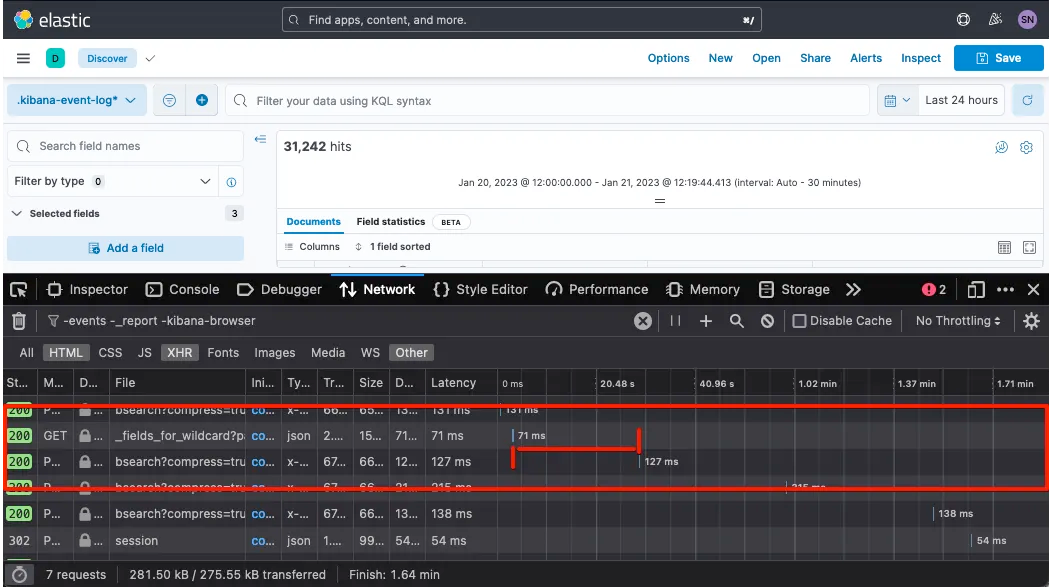
This JavaScript compilation time is diagnosed via the browser DevTool’s Performance tab (e.g., Chrome, Firefox, Edge; can also export HAR-like equivalent for sharing).
3. Load search
Lastly, the browser page will make an API search request. This API search request passes through the Kibana server but (should) take nearly the same amount of time as making the Elasticsearch API request directly.
API. This URI defaults to:
POST /internal/bsearch {REQUEST_BODY_HERE}But if Advanced Setting courier:batchSearches is set to false (<v8.0), then this will instead request the following API:
POST /internal/_msearch {REQUEST_BODY_HERE}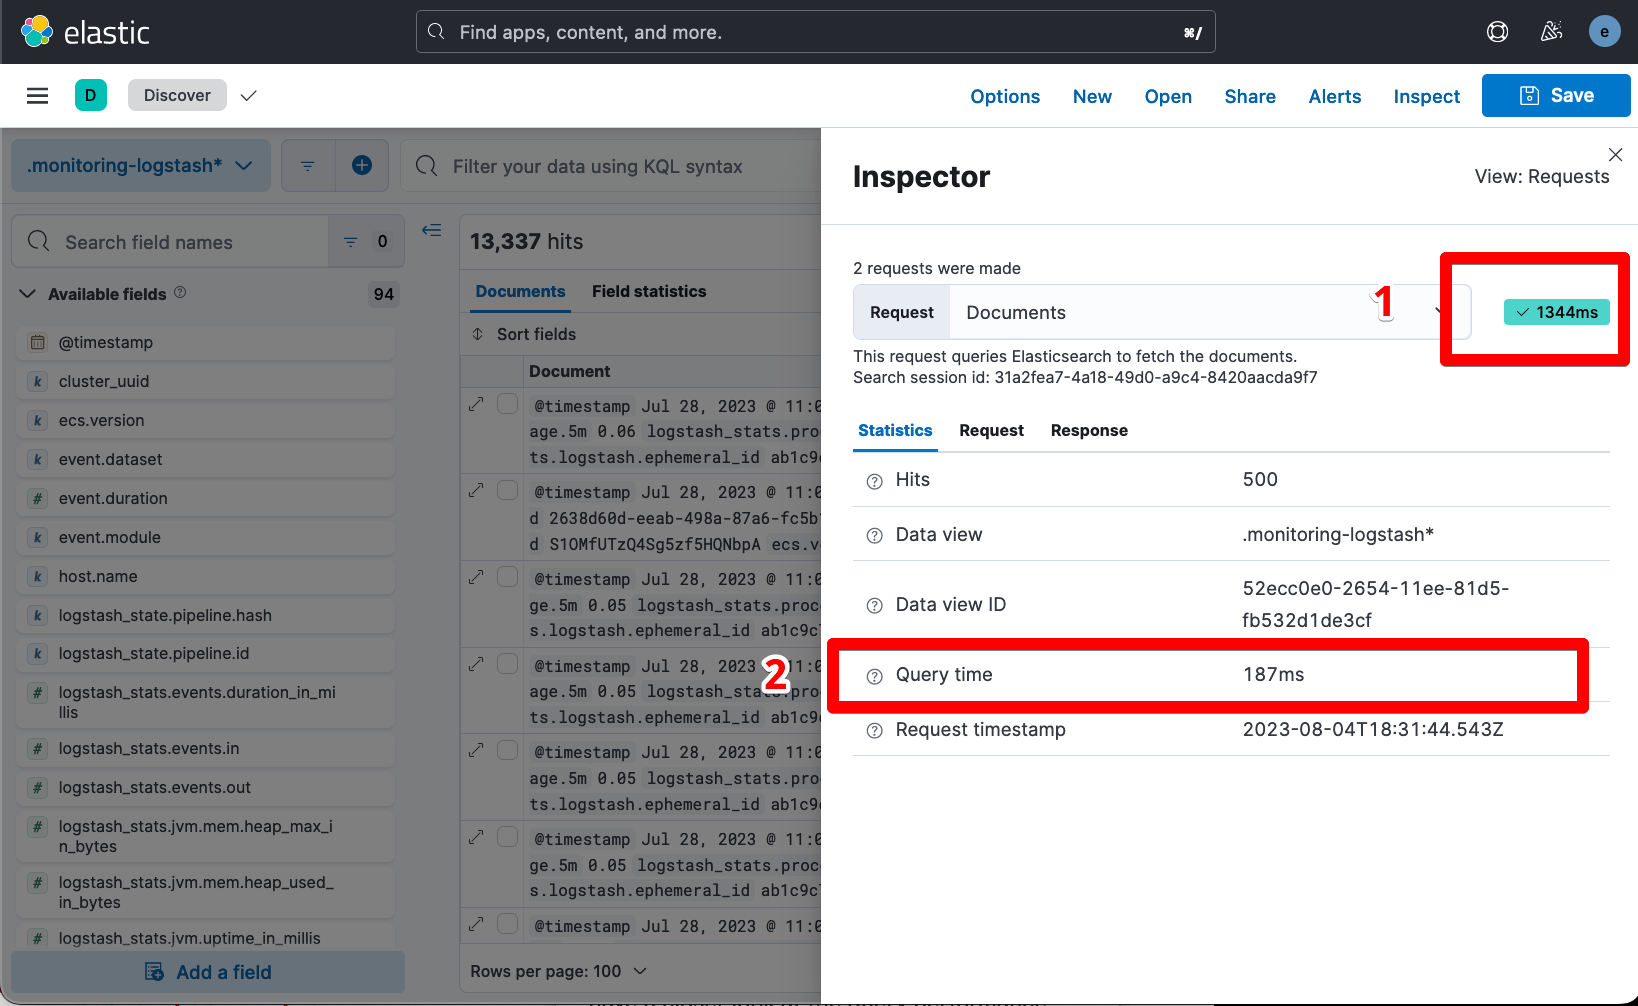
We expect a differential between the “Query Time” (time the Elasticsearch thinks the search takes) and Kibana’s reported time, but we’ll want to check if the latter is magnitudes of order off the former, which would indicate, for example, Kibana server load, HTTP compression is disabled, or general rendering issue.
If we want to investigate our search further to isolate between Kibana server load versus general rendering issue, we’ll further navigate Inspect > Request > Open in Console (a.k.a. DevTools). Visually:
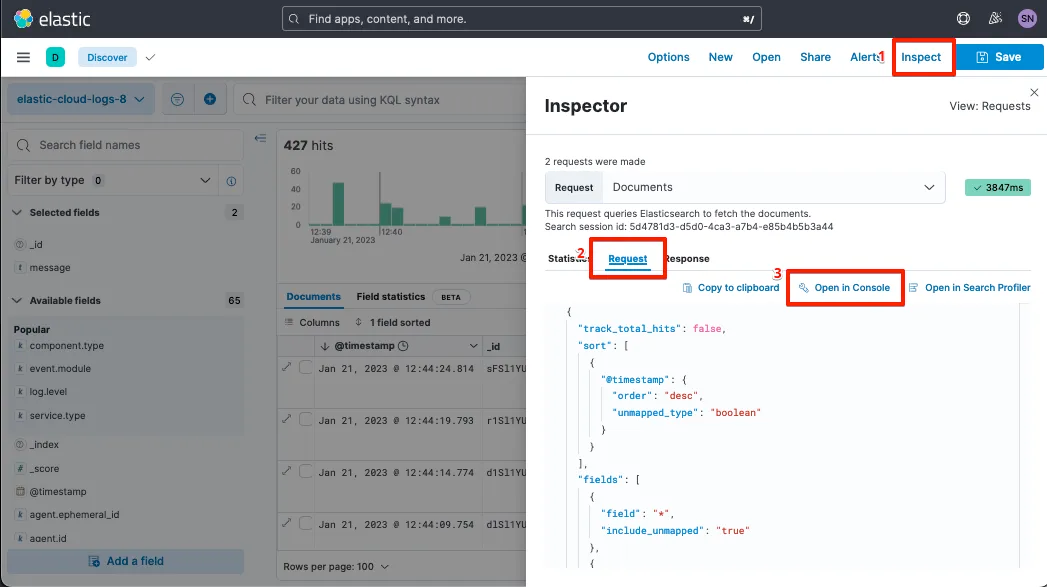
We’ll then run this API search request both in DevTools and separately via Elasticsearch API curl, noting the overall response time differences between Discover, DevTools, and the Elasticsearch API.
Common issue 5: If query is slow in Elasticsearch API
If Elasticsearch is also just as slow as the other two, we may suspect an un-optimized search/filter in our original Discover view. If no filters/searches are applied (or reproducing with none applied), we’ll confirm general Elasticsearch performance via CAT Nodes, CAT Threadpools (esp. search threads), and CAT Tasks (for long running tasks). If no cluster-wide issue is found, we’ll compare search response durations between the different Data Views selected in Discover and then compare these searches’ related Query Profiling (after injecting profile: true in our search request body).
JS. After the API results return, the browser’s JavaScript kicks in to either load the 1) display table summary (the middle-bottom “Documents” table where you can toggle column view on/off) or 2) “Field Statistics” (in beta, toggle in Advanced Settings via discover:showFieldStatistics).
Common issue 6: Rendering time affected by Mapping Explosion
Mapping Explosions can lead to a large resultset, which in the past have caused performance regressions in the browser (e.g., kibana#144673). Mapping Explosion may surface browser-specific errors, such as Chrome’s Error: maximum call stack size exceeded, which reproduces incognito, does not occur in Firefox/Safari, and sometimes only resolves via upgrading Chrome. If, however, you encounter a very slow rendering process without errors after the result has returned, then it's time to record a browser Performance Profile to introspect what's causing the slow rendering. Our team is happy to help review the output via Kibana GitHub, Elastic Discuss, or from opening a Support case!
Cascading impact
(To assist quick page searching: #devToolsAuto.) While troubleshooting potential Mapping Explosions, DevTools may respond slower than Discover and top-left icon load when no requests are expected due to URI.
GET /api/console/autocomplete_entities?fields=true&indices=true&templates=true&dataStreams=true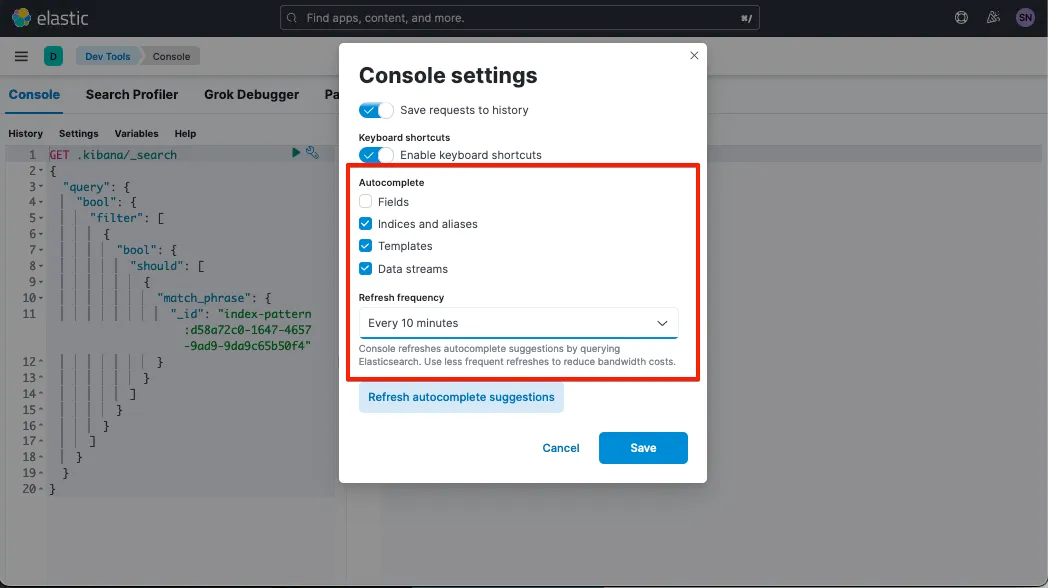
These requests can bog down the 1) local browser causing page crashes or “wait for page?” banners and 2) Kibana Server depending on frequency and expensiveness. This change is specific to the logged in user.
Conclusion
Discover is an easy way to introspect multiple indices’ data within your clusters. There’s some configuration and settings that can make this UI load slower than necessary. This guide walked through the impact of these various gotchas; however, good data hygiene can avoid all of them. For more data hygiene tips, see our Elasticsearch documentation.
The release and timing of any features or functionality described in this post remain at Elastic's sole discretion. Any features or functionality not currently available may not be delivered on time or at all.
Share
- Share on Twitter
Share on Twitter
- Share on LinkedIn
Share on LinkedIn
- Share on Facebook
Share on Facebook
- Share by Email
Share by Email
- Print this page
Print