A Sip of Elastic RUM (Real User Monitoring)
Sorry if I lured you into the mood of having a sip of a wonderful cocktail made with rum and you realized that the RUM I’m talking about is not the rum you are craving. But, be assured that Elastic RUM is equally wonderful! Let’s take a sip! I do want to warn you that it will take a bit of time to go through the amount of detail I will cover in this blog.
What is RUM?
Elastic real user monitoring, or RUM, captures user interactions with the web browser and provides a detailed view of the “real user experience” of your web applications from a performance perspective. Elastic’s RUM Agent is a JavaScript Agent, which means it supports any JavaScript-based application. RUM can provide valuable insight into your applications. Some of the common benefits of RUM include:
- RUM performance data can help you identify bottlenecks and discover how site performance issues affect your visitors’ experience
- User agent information captured by RUM enables you to identify the browsers, devices, and platforms most used by your customers so that you can make informed optimizations to your application
- Together with location information, individual user performance data from RUM helps you understand regional performance of your website worldwide
- RUM provides insight and measurement for your application’s service level agreements (SLA)
- RUM gathers information on customer visit and click behavior over time that can be useful for development teams to identify the impact of new features
Getting started with RUM using Elastic APM
In this blog, I will take you through the complete process of instrumenting a simple web application made of a React frontend and a Spring Boot backend, step by step. You will see how easy it is to use the RUM agent. As a bonus, you will also see how Elastic APM ties the frontend and the backend performance information together with a holistic, distributed trace view. Please see this previous blog for an overview of Elastic APM and distributed tracing if you are interested in knowing more details.
To use Elastic APM real user monitoring, you have to have the Elastic Stack with APM server installed. You can of course download and install the latest Elastic Stack with APM server locally on your computer. However, the easiest approach would be creating an Elastic Cloud trial account and have your cluster ready in a few minutes. APM is enabled for the default I/O Optimized template. From now on, I’ll assume you have a cluster ready to go.
Sample application
The application we are going to instrument is a simple car database application made of a React frontend and a Spring Boot backend that provides API access to an in-memory car database. The application is purposely kept simple. The idea is to show you detailed instrumentation steps starting from zero so that you can instrument your own applications following the same steps.
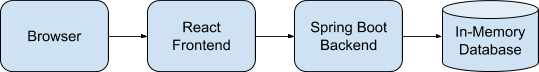
Create a directory called CarApp anywhere on your laptop. Then clone both the frontend and the backend application into that directory.
git clone https://github.com/carlyrichmond/carfront
git clone https://github.com/carlyrichmond/cardatabase
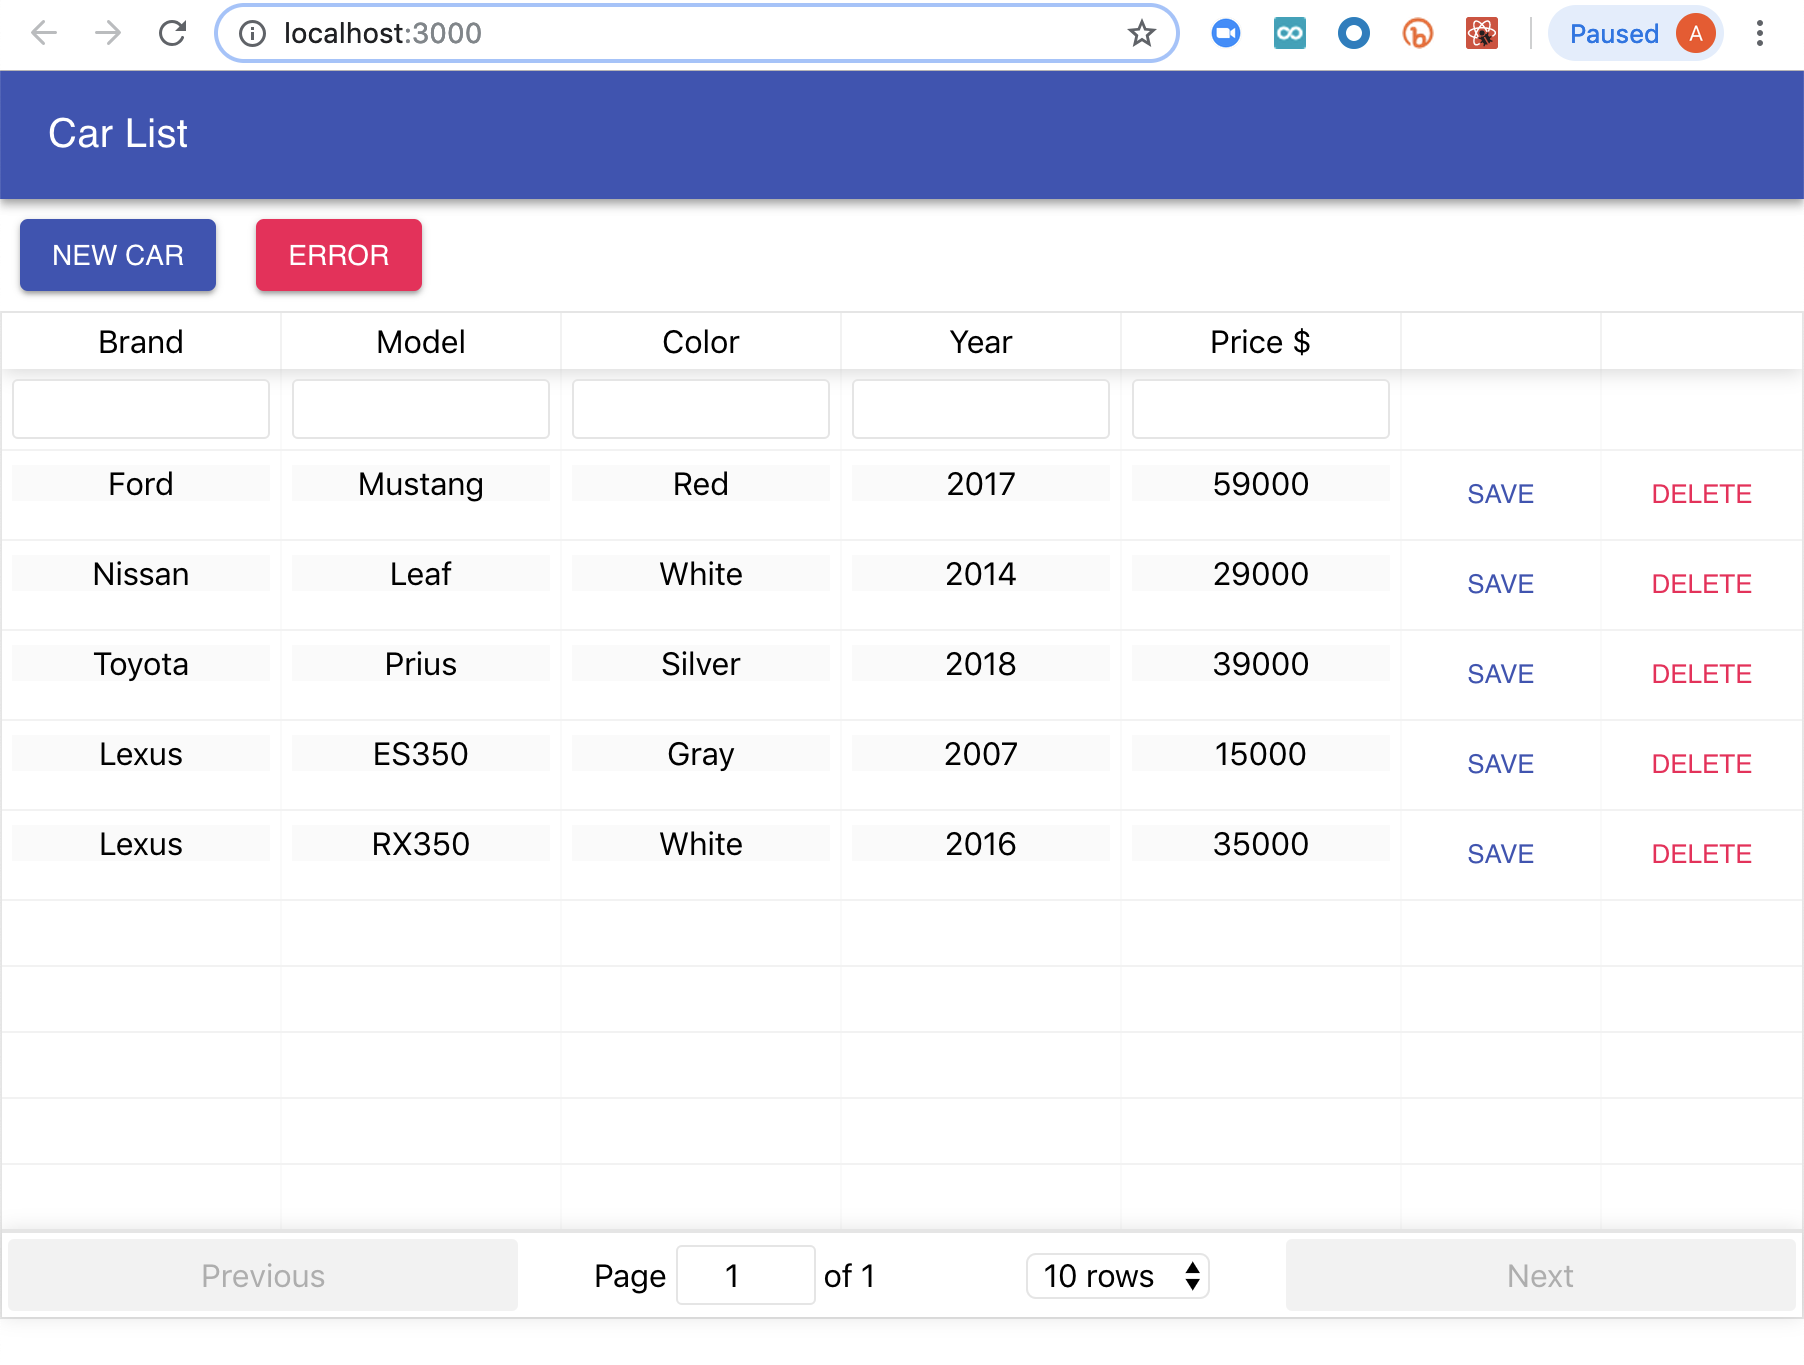
As you can see, the application is extremely simple. There are only a couple of components in the React frontend and a few classes in the backend Spring Boot application. Build and run the application following the instructions in GitHub for both the frontend and backend. You should see something like this. You can browse, filter cars, and perform CRUD options on them.
Now, with the application up running, we are ready to go through the instrumentation using the RUM agent.
Rich out-of-the-box instrumentation with RUM
An Elastic APM server is needed to get started. You will need to enable RUM to capture the events from your RUM agent. To set up your RUM agent, there are two ways of doing so:
- You can install the RUM agent as a project dependency via a package manager such as npm:
npm install @elastic/apm-rum --save
- Include the RUM agent via the HTML script tag. Note this can be performed as either a blocking or non-blocking operation as per the documentation.
<script
src="https://unpkg.com/@elastic/apm-rum@5.12.0/dist/bundles/elastic-apm-rum.umd.min.js">
</script>
<script>
  elasticApm.init({
    serviceName: 'carfront',
    serverUrl: 'http://localhost:8200',
    serviceVersion: '0.90'
  })
</script>
Since our frontend is a React application, we are going to use the first approach. Once you've installed @elastic/apm-rum in your project, check out the initialization code in rum.js . This is located in the same directory as your index.js and will look a bit like this, but with serviceUrl replaced with your own APM server endpoint:
import { init as initApm } from '@elastic/apm-rum'
var apm = initApm({
 // Set required service name (allowed characters: a-z, A-Z, 0-9, -, _, and space)
 serviceName: 'carfront',
 // Set the version of your application
 // Used on the APM Server to find the right sourcemap
 serviceVersion: '0.90',
 // Set custom APM Server URL (default: http://localhost:8200)
 serverUrl: 'APM_URL',
 // distributedTracingOrigins: ['http://localhost:8080'],
})
export default apm;
That’s all it takes to initialize the RUM agent! If you are making use of framework specific features, such as routing in React, Angular, or Vue, you may want to also install and configure the framework specific integrations as well, which are covered in the documentation. In this case, as this is a single page that doesn't require React specific instrumentation, we have not installed the additional dependency.
Don't worry about distributedTracingOrigins right now. Here's a quick explanation of some of the other configurations:
- Service name: The service name has to be set. It represents your application in the APM UI. Name it something meaningful.
- Service version: This is the version of your application. This version number is also used by the APM server to find the right source map. We will discuss the source map in detail later.
- Server URL: This is the APM server URL. Note that the APM server URL is normally accessible from the public internet because your RUM agent reports data to it from end-user browsers on the internet.
People who are familiar with Elastic APM backend agents might be wondering why the APM token was not passed here. That’s because the RUM agent doesn't actually use a secret APM token. The token is only used for backend agents. Because the frontend code is public, the secret token does not provide additional security.
We will load this JavaScript file when the application loads and include it in places that we want to perform custom instrumentation. For now, let’s see what we get out of the box, without any custom instrumentation. To do so, we simply need to include rum.js in index.js . The index.js file imports rum.js and sets a page load name. Without setting a page load name, you will see the page load listed as “/” in the APM UI, which is not very intuitive. Here is what index.js looks like.
import apm from './rum'
import React from 'react';
import ReactDOM from 'react-dom';
import './index.css';
import App from './App';
import * as serviceWorker from './serviceWorker';
apm.setInitialPageLoadName("Car List")
ReactDOM.render(<App />, document.getElementById('root'));
serviceWorker.unregister();
Generate some traffic to your application by accessing pages and adding or deleting cars. Then log into Kibana and click on the Observability tile. From there, select the Services option from the APM submenu, as shown below:
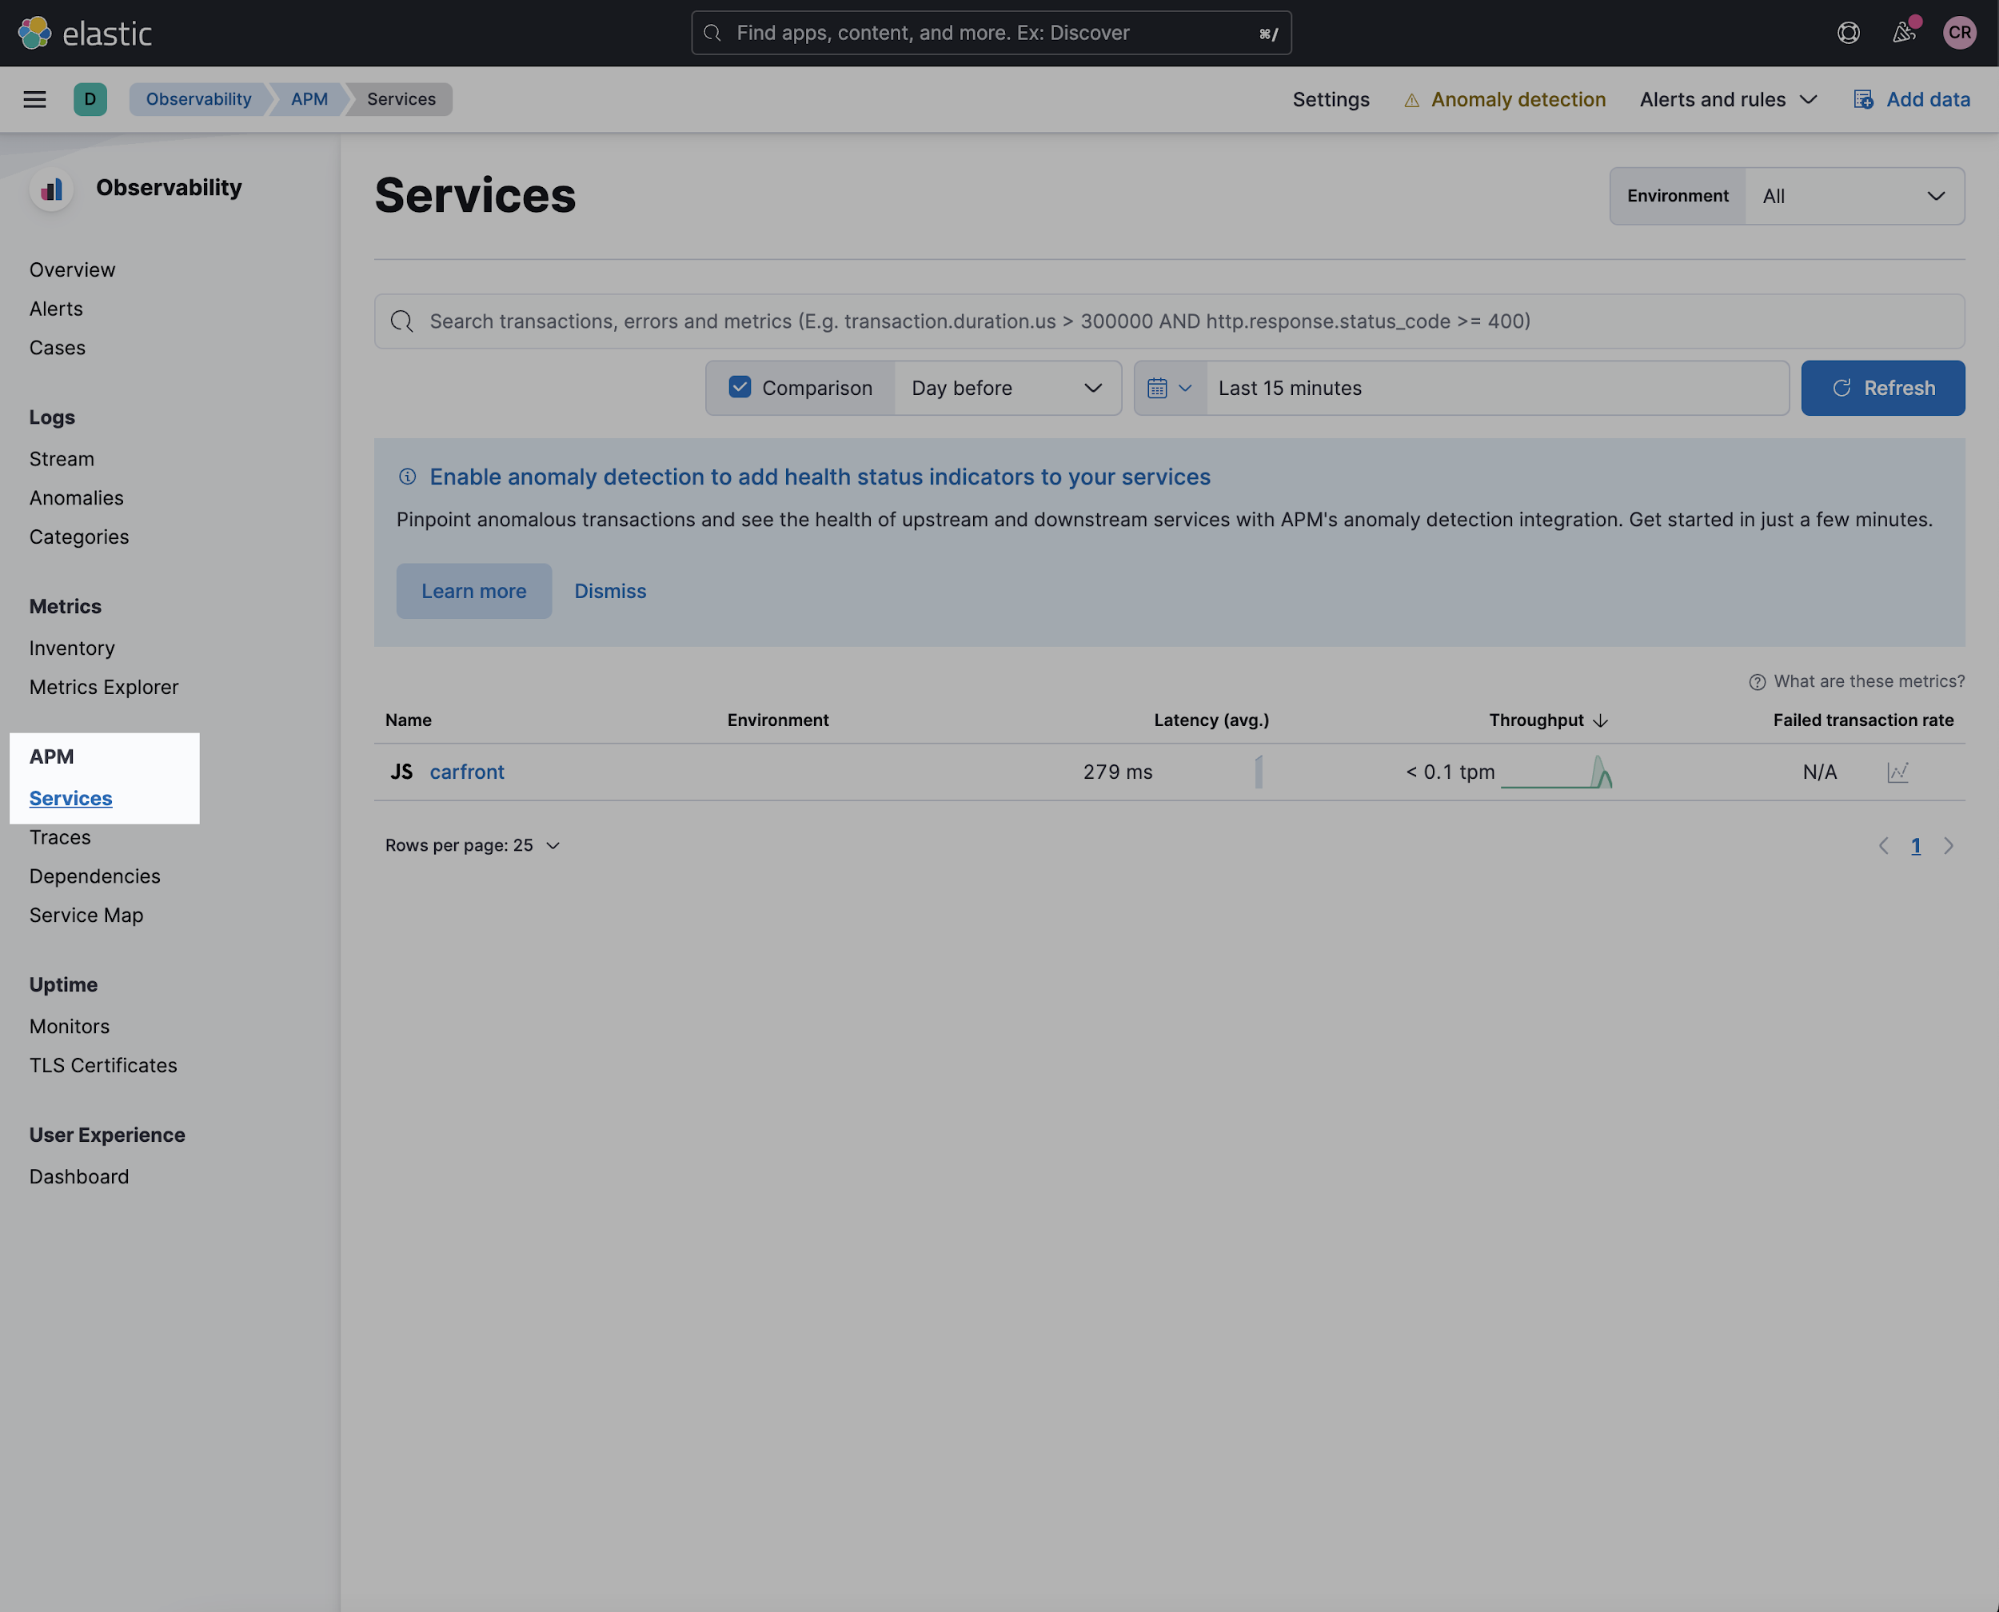
You should see a service called "carfront" listed. Clicking on the service name takes you to the transaction page. You should see an overview of metrics such as latency and throughput for the default time frame of "Last 15 minutes." If not, change the time picker to this range.
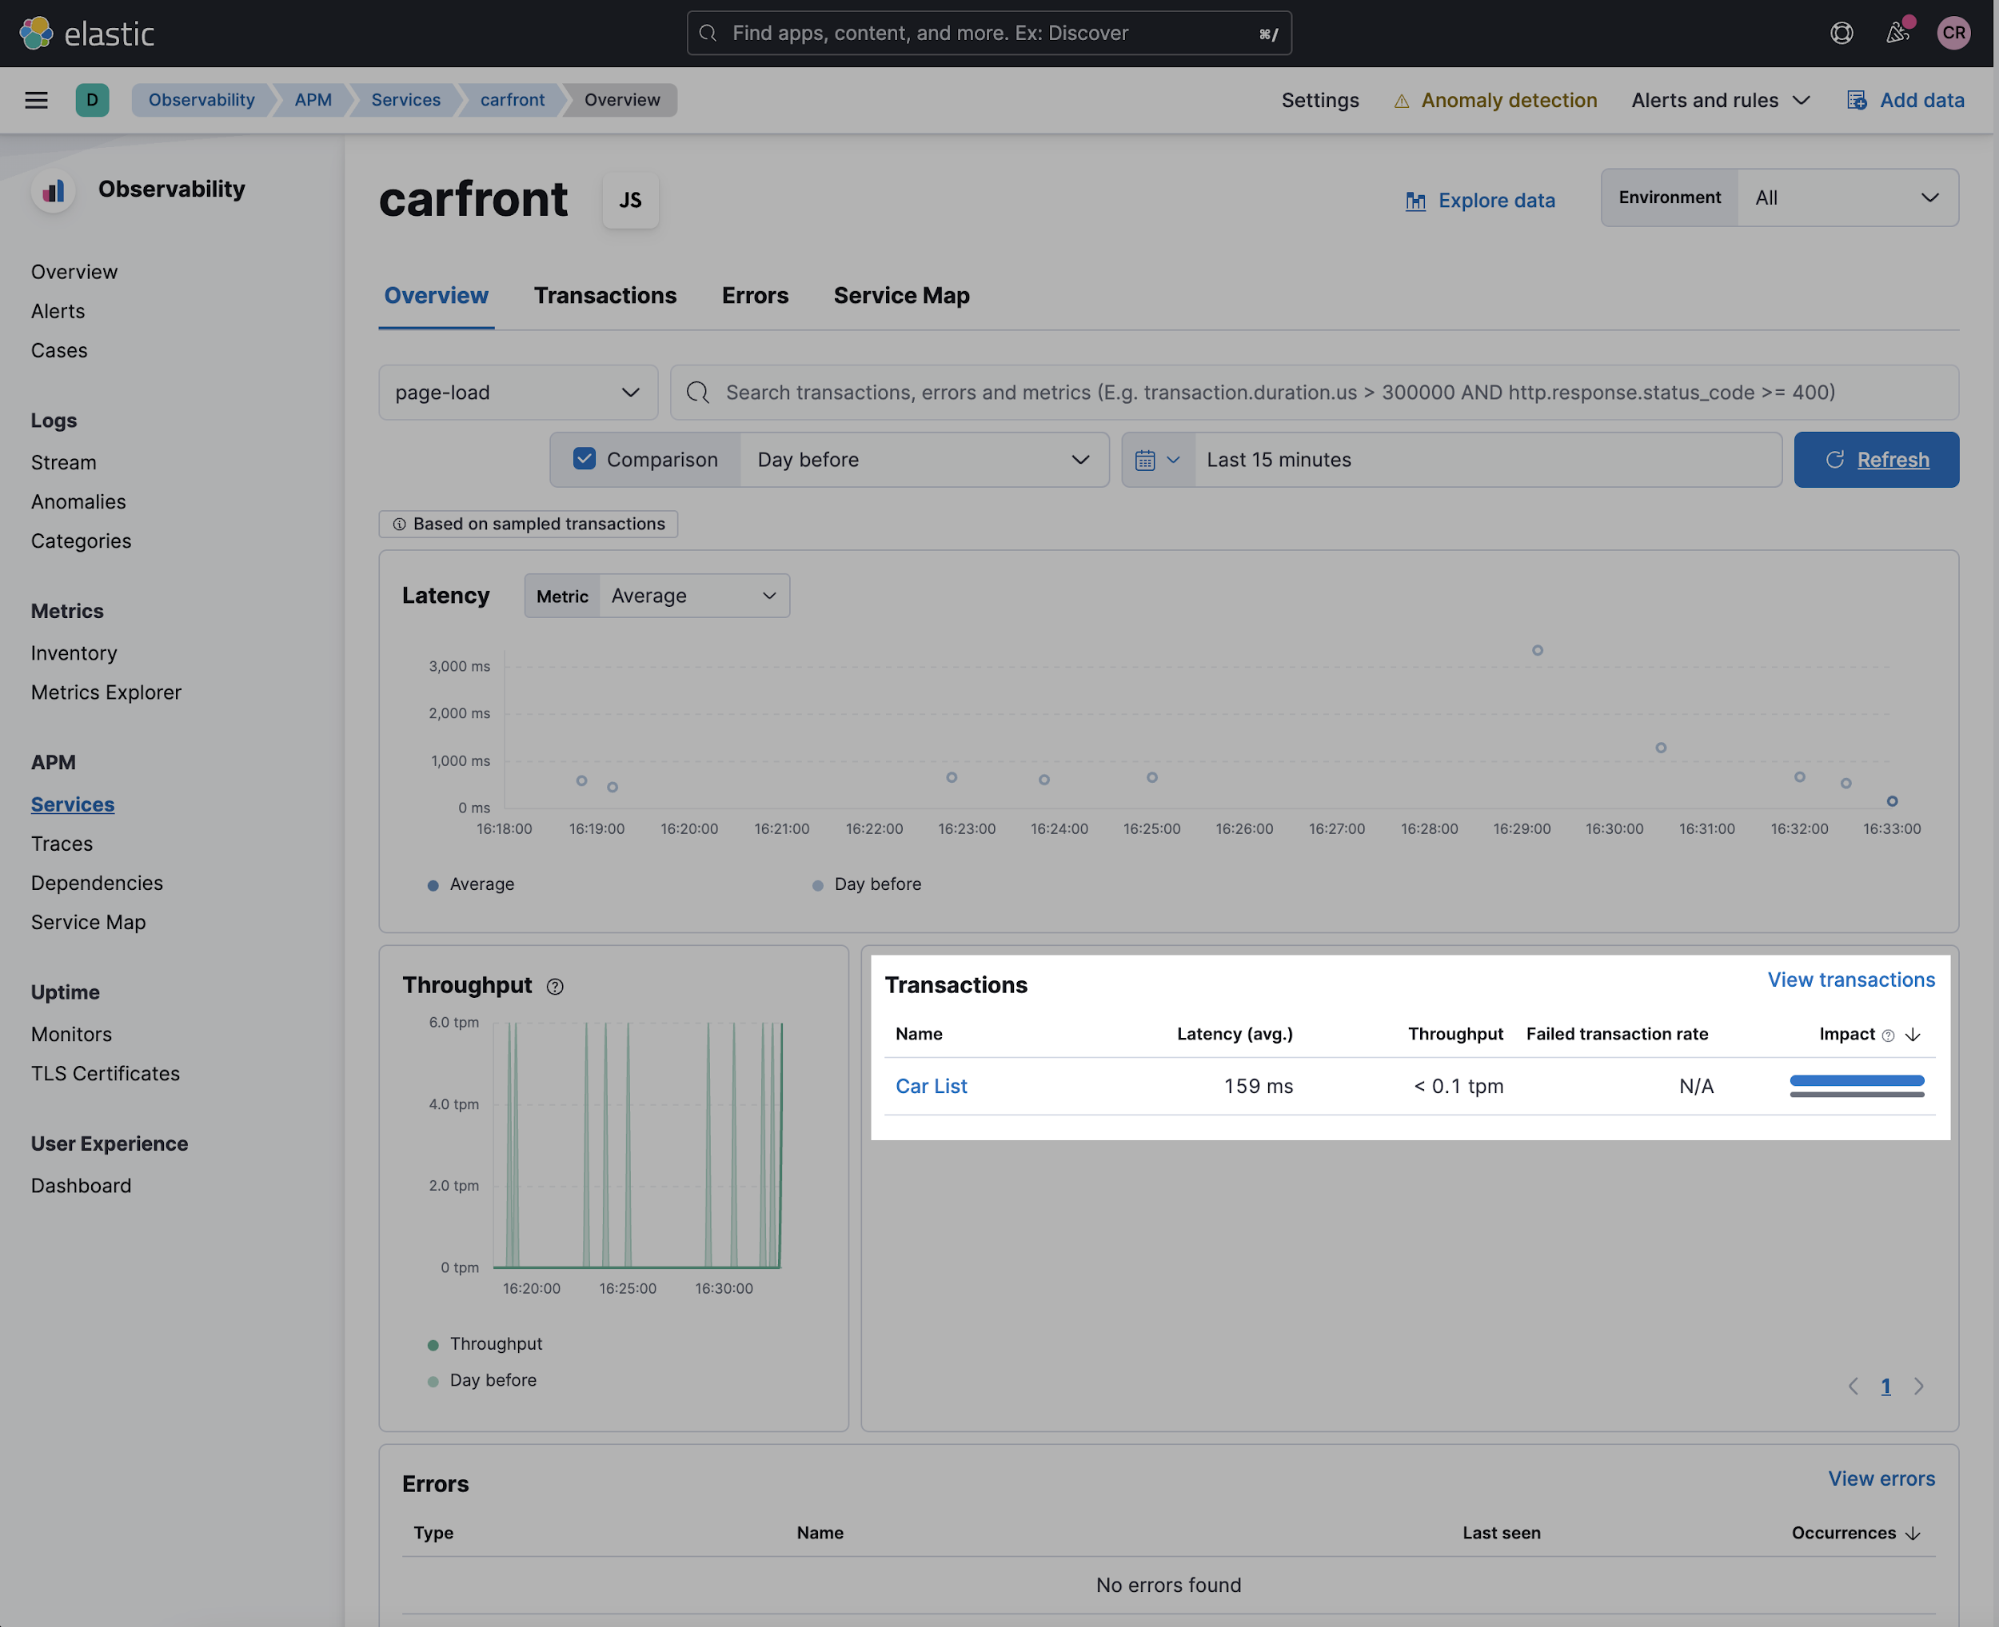
In the transactions segment, you should see the "Car List" transaction. Click on the "Car List" link, and you will move to the Transaction tab, which contains statistics for this sample of transactions. Scrolling to the bottom of the page, you will see a waterfall view of browser interactions like this:
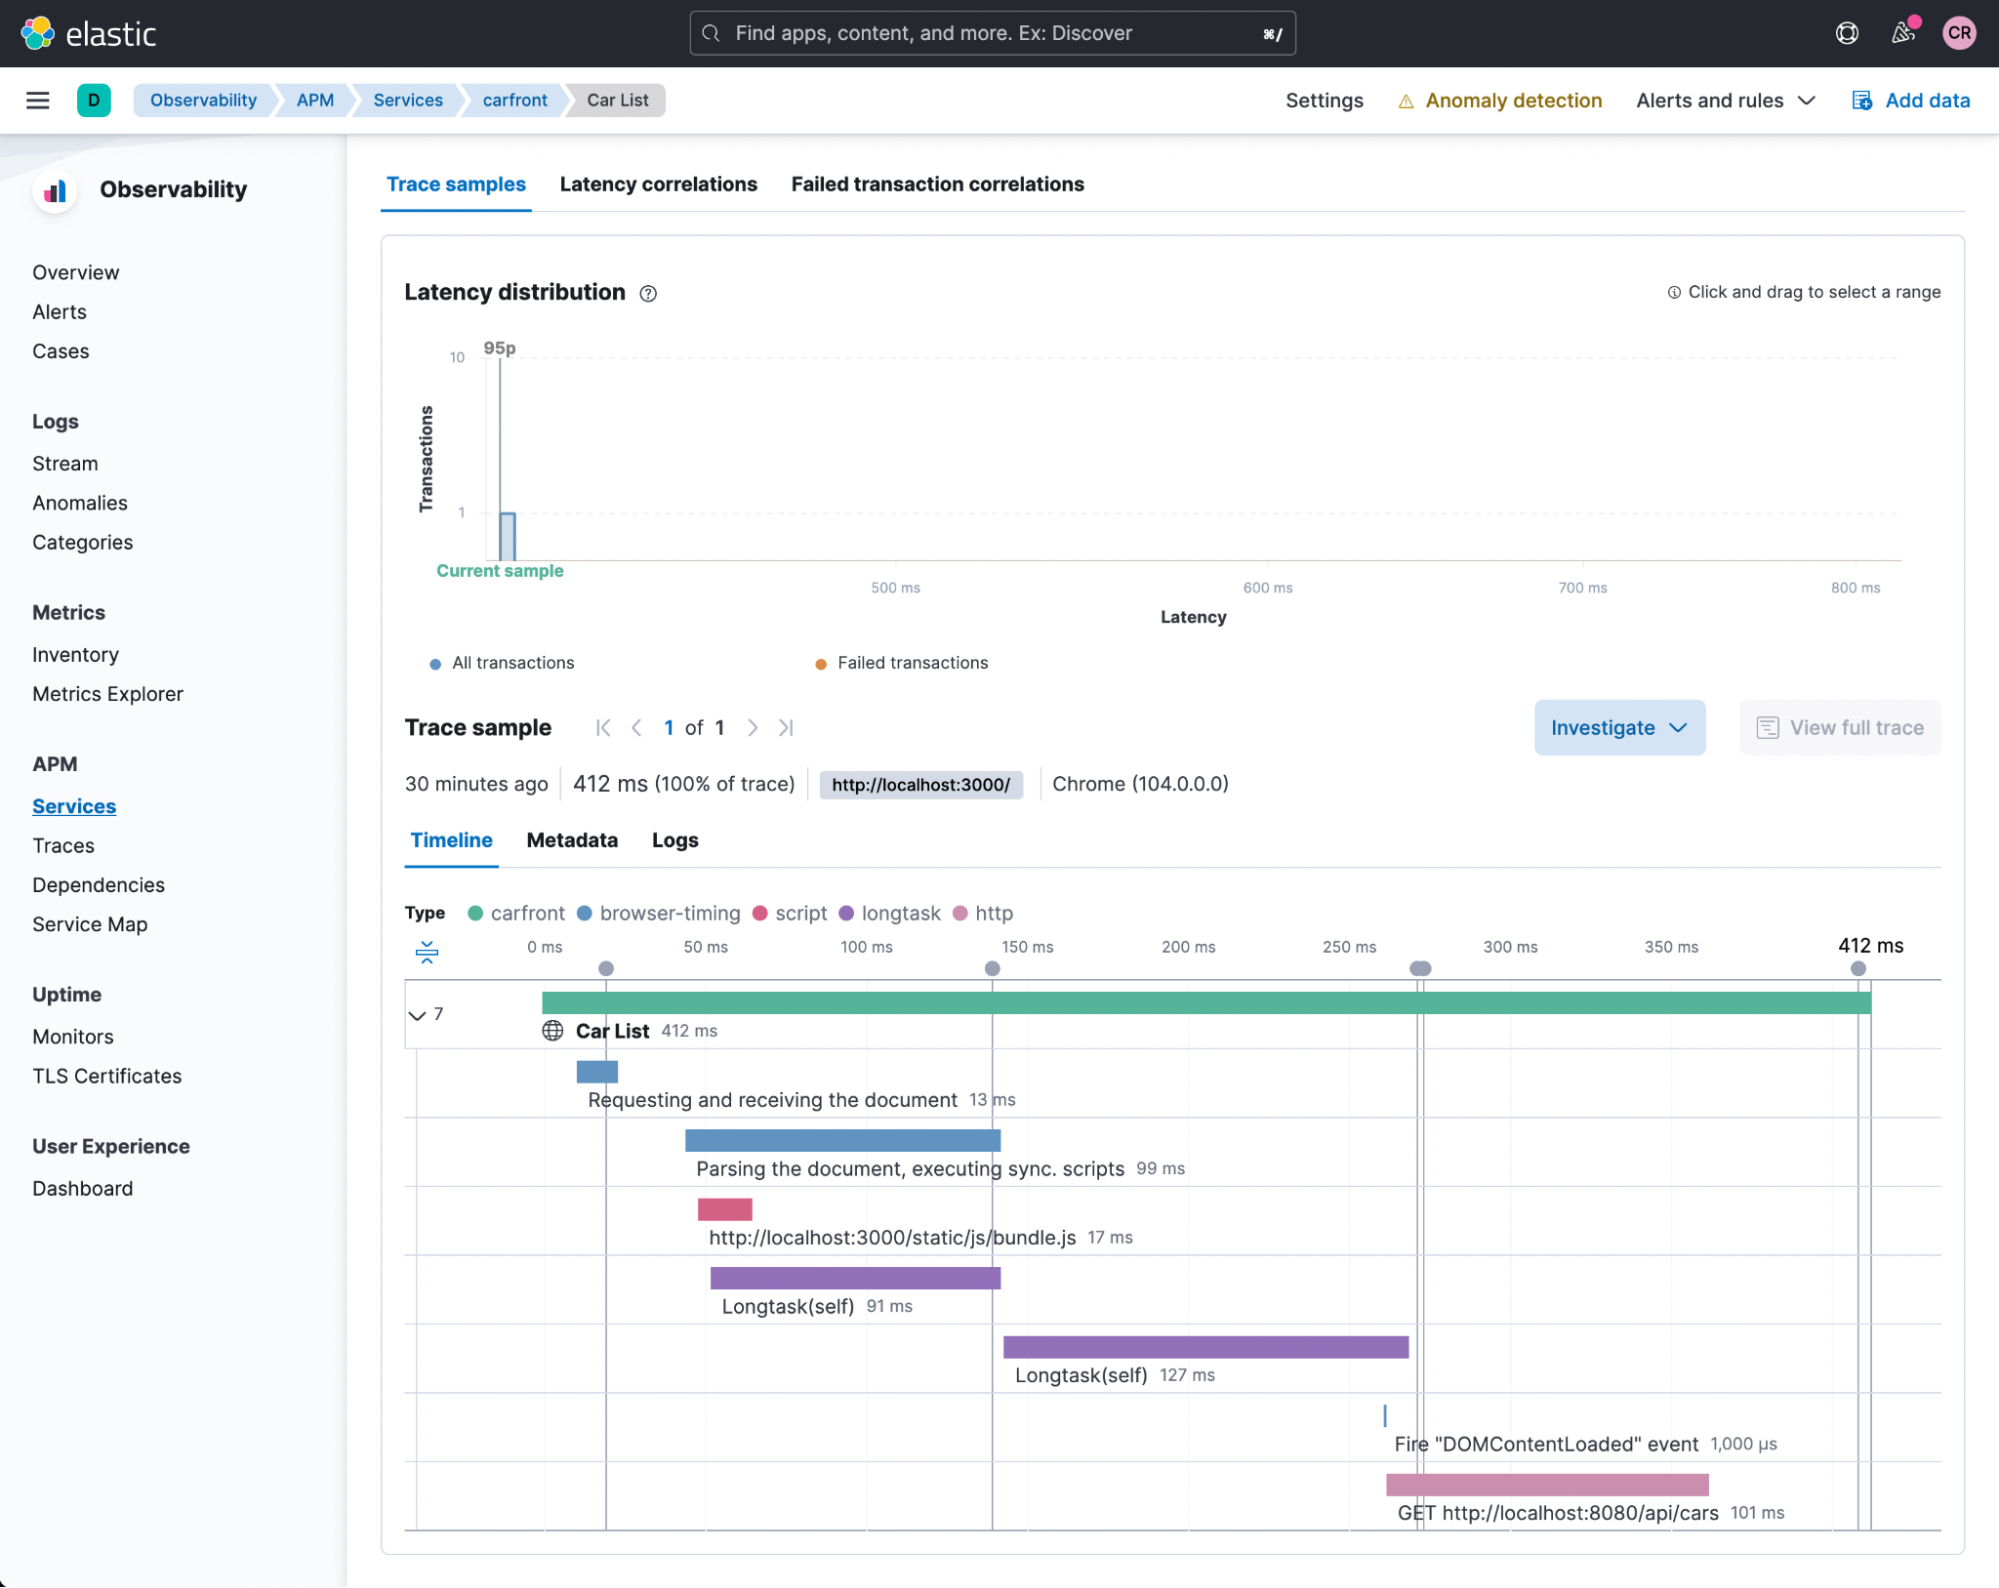
Amazed by how much information is captured by the RUM agent by default? Pay special attention to the markers at the top like timeToFirstByte, domInteractive, domComplete, and firstContentfulPaint. Mouse over the black dots to see the names. They provide you with great details about content retrieval and browser rendering of these contents. Also, pay attention to all the performance data about resource loading from the browser. By just initializing your RUM agent, without any custom instrumentation, you get all these detailed performance metrics, out of the box! When there is a performance issue, these metrics enable you to easily decide whether the issue is due to slow backend services, a slow network, or simply a slow client browser. That is very impressive!
For those of you who need a refresher, here is a quick explanation of the web performance metrics. Do keep in mind that for modern web application frameworks like React, these metrics might only represent the “static” part of the web page, due to the async nature of React. For example, dynamic contents might still be loading after domInteractive, as you will see later.
- timeToFirstByte is the amount of time a browser waits to receive the first piece of information from the web server after requesting it. It represents a combination of network and server-side processing speed.
- domInteractive is the time immediately before the user agent sets the current document readiness to “interactive,” which means the browser has finished parsing all of the HTML and DOM construction has completed.
- domComplete is the time immediately before the user agent sets the current document readiness to “complete,” which means the page and all of its subresources like images have finished downloading and are ready. The loading spinner has stopped spinning.
- firstContentfulPaint is the time the browser renders the first bit of content from the DOM. This is an important milestone for users because it provides feedback that the page is actually loading.
Flexible custom instrumentation
The RUM agent provides detailed instrumentation for your browser interaction out of the box, as you just saw. You can also perform custom instrumentations when needed. For example, because the React application is a single-page-application and deleting a car will not trigger a “page load,” RUM does not by default capture the performance data of deleting a car. We can use custom transactions for something like that.
With our current release (APM Real User Monitoring JavaScript Agent 5.x), AJAX calls and click events are captured by the agent and sent to the APM server. Configuring the types of interactions can be achieved using the disableInstrumentation setting.
It is also possible to add your own custom instrumentations to give more meaningful traces. This can particularly be useful for tracing new features. In our example application, the "New Car" button in our frontend application allows you to add a new car to the database. We will instrument the code to capture the performance of adding a new car. Open the file Carlist.js in the components directory. You will see the following code:
// Add new car
addCar(car) {
    // Add car metadata as labels to the RUM click transaction
    var transaction = apm.startTransaction("Add Car", "Car");
    transaction.addLabels(car);
    fetch(SERVER_URL + 'api/cars',
        {
            method: 'POST',
            headers: {
                'Content-Type': 'application/json',
            },
            body: JSON.stringify(car)
        })
        .then(res => this.fetchCars())
        .catch(err => console.error(err))
}
fetchCars = () => {
    fetch(SERVER_URL + 'api/cars')
        .then((response) => response.json())
        .then((responseData) => {
            this.setState({
                cars: responseData._embedded.cars,
            });
        })
        .catch(err => console.error(err));
        // End the current transaction at the end of the response call back
        var transaction = apm.getCurrentTransaction()
        if (transaction) transaction.end()
}
The code basically created a new transaction called “Add Car” of “Car” type. Then, it tagged the transaction with the car to provide contextual information. We then explicitly ended the transaction at the end of the method.
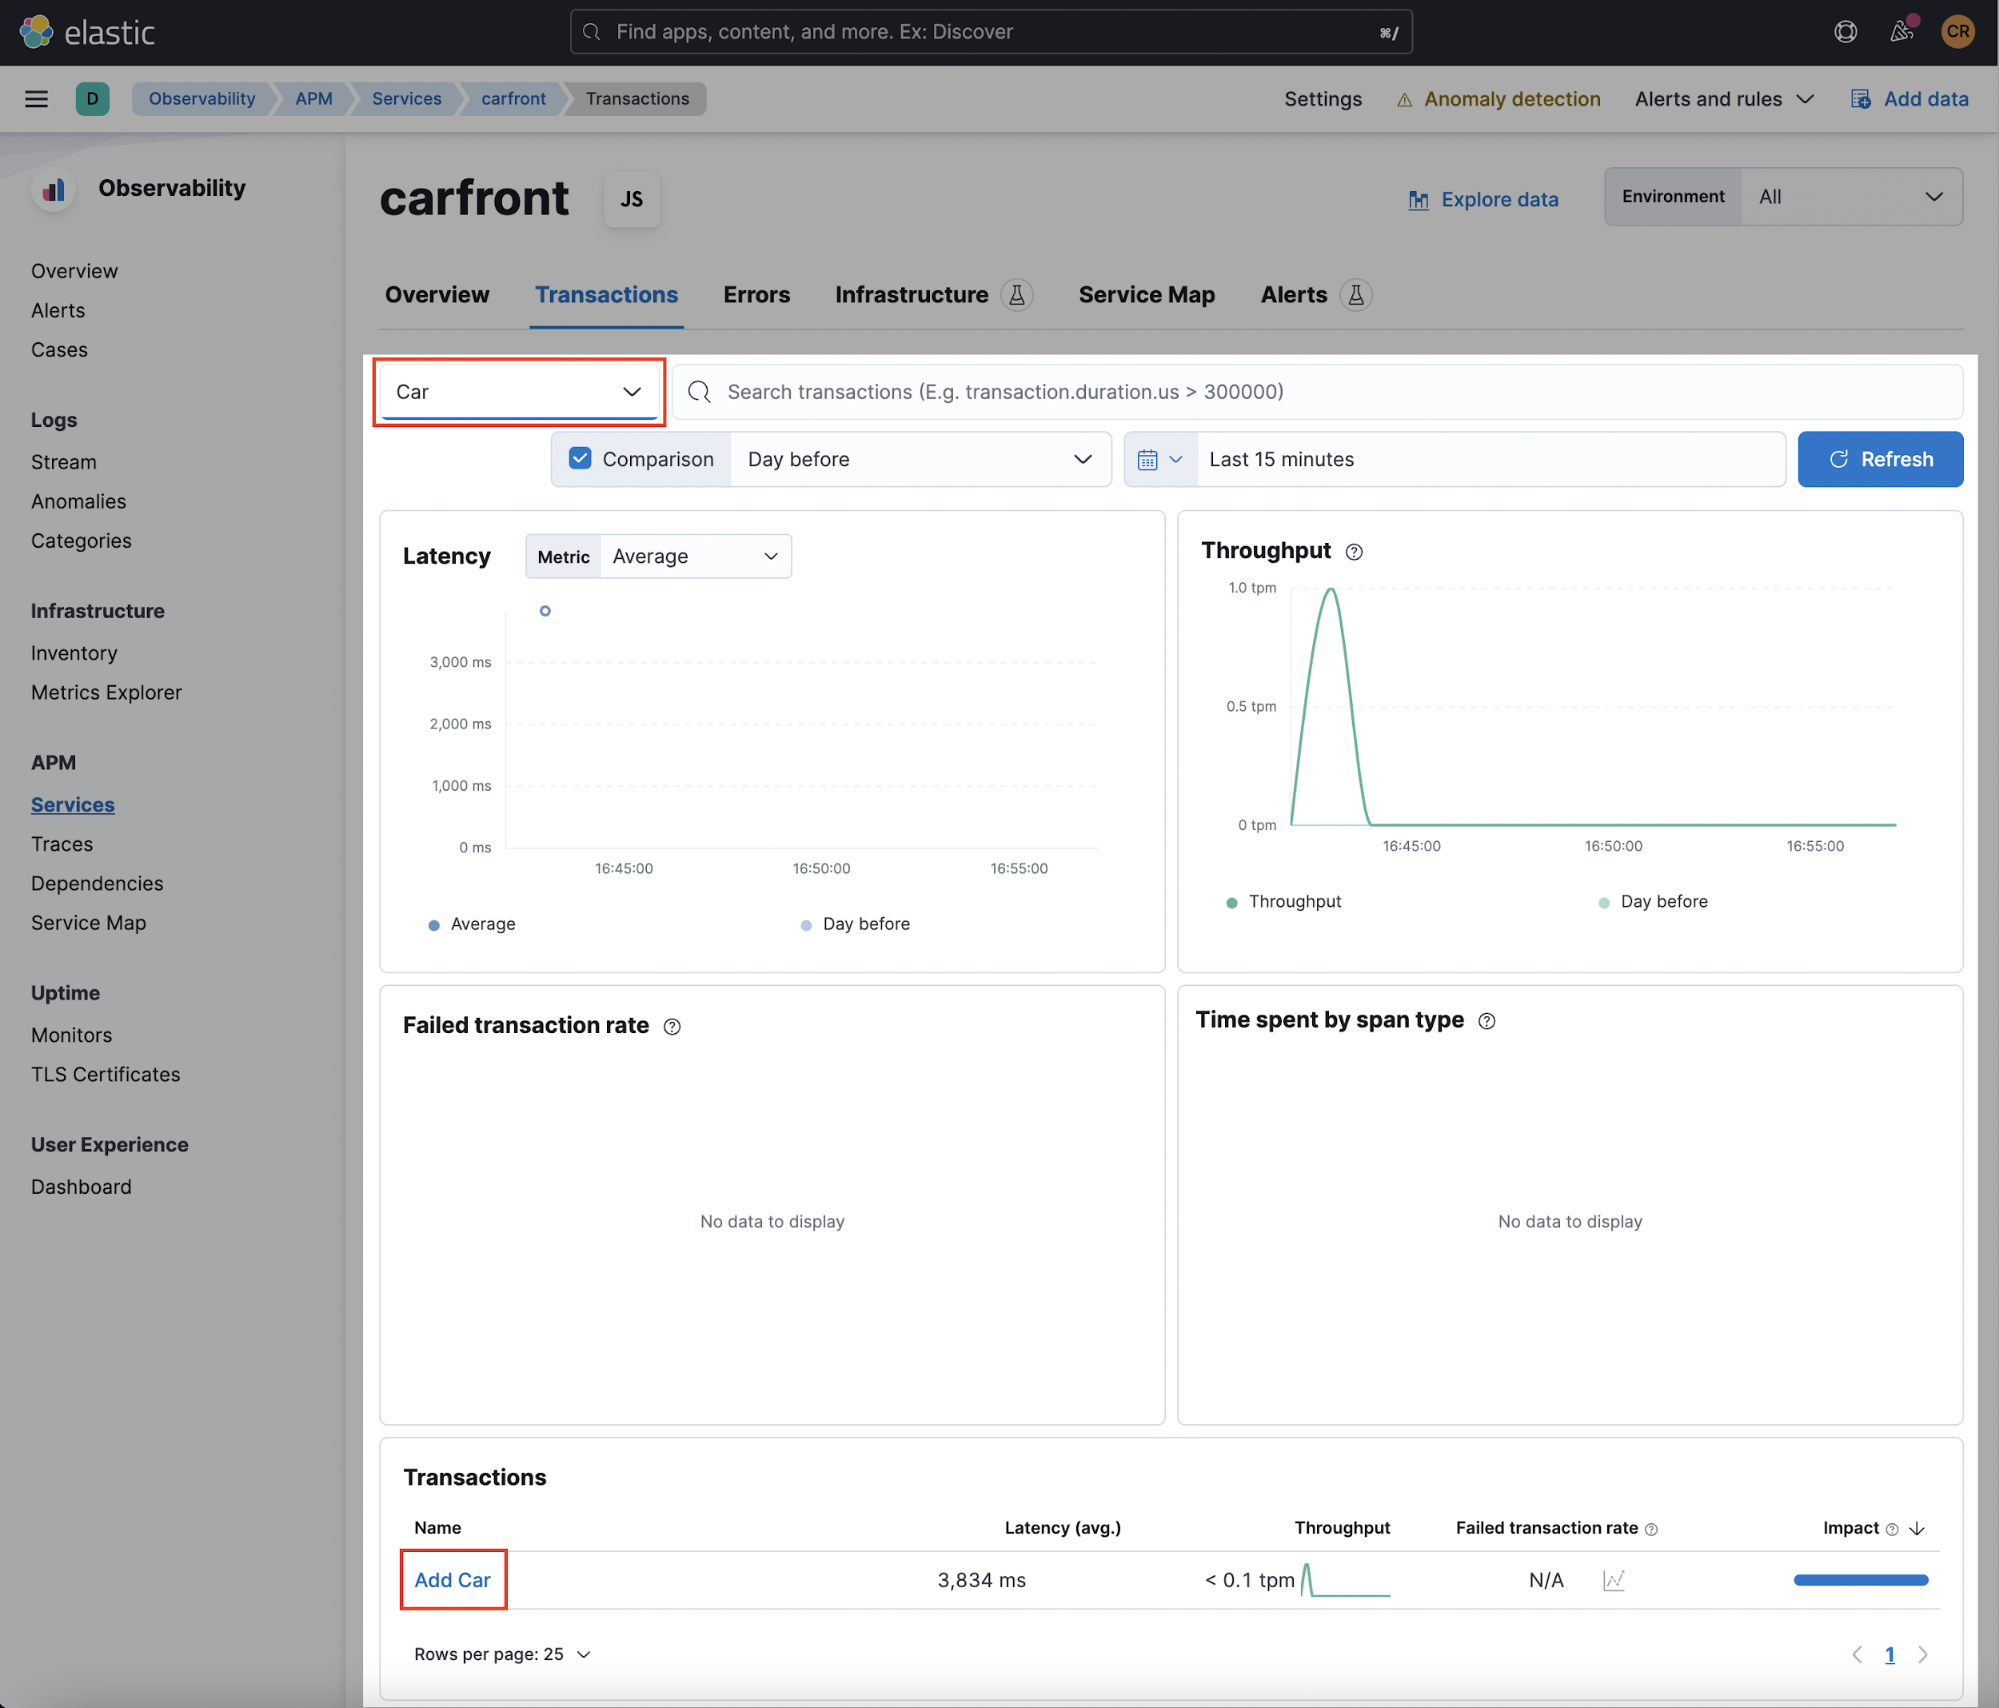
Add a new car from the application web UI. Click on the APM UI in Kibana. You should see an “Add Car” transaction listed. Make sure you select “Car” in the “Filter by type” dropdown. By default, it displays “page-load” transactions.
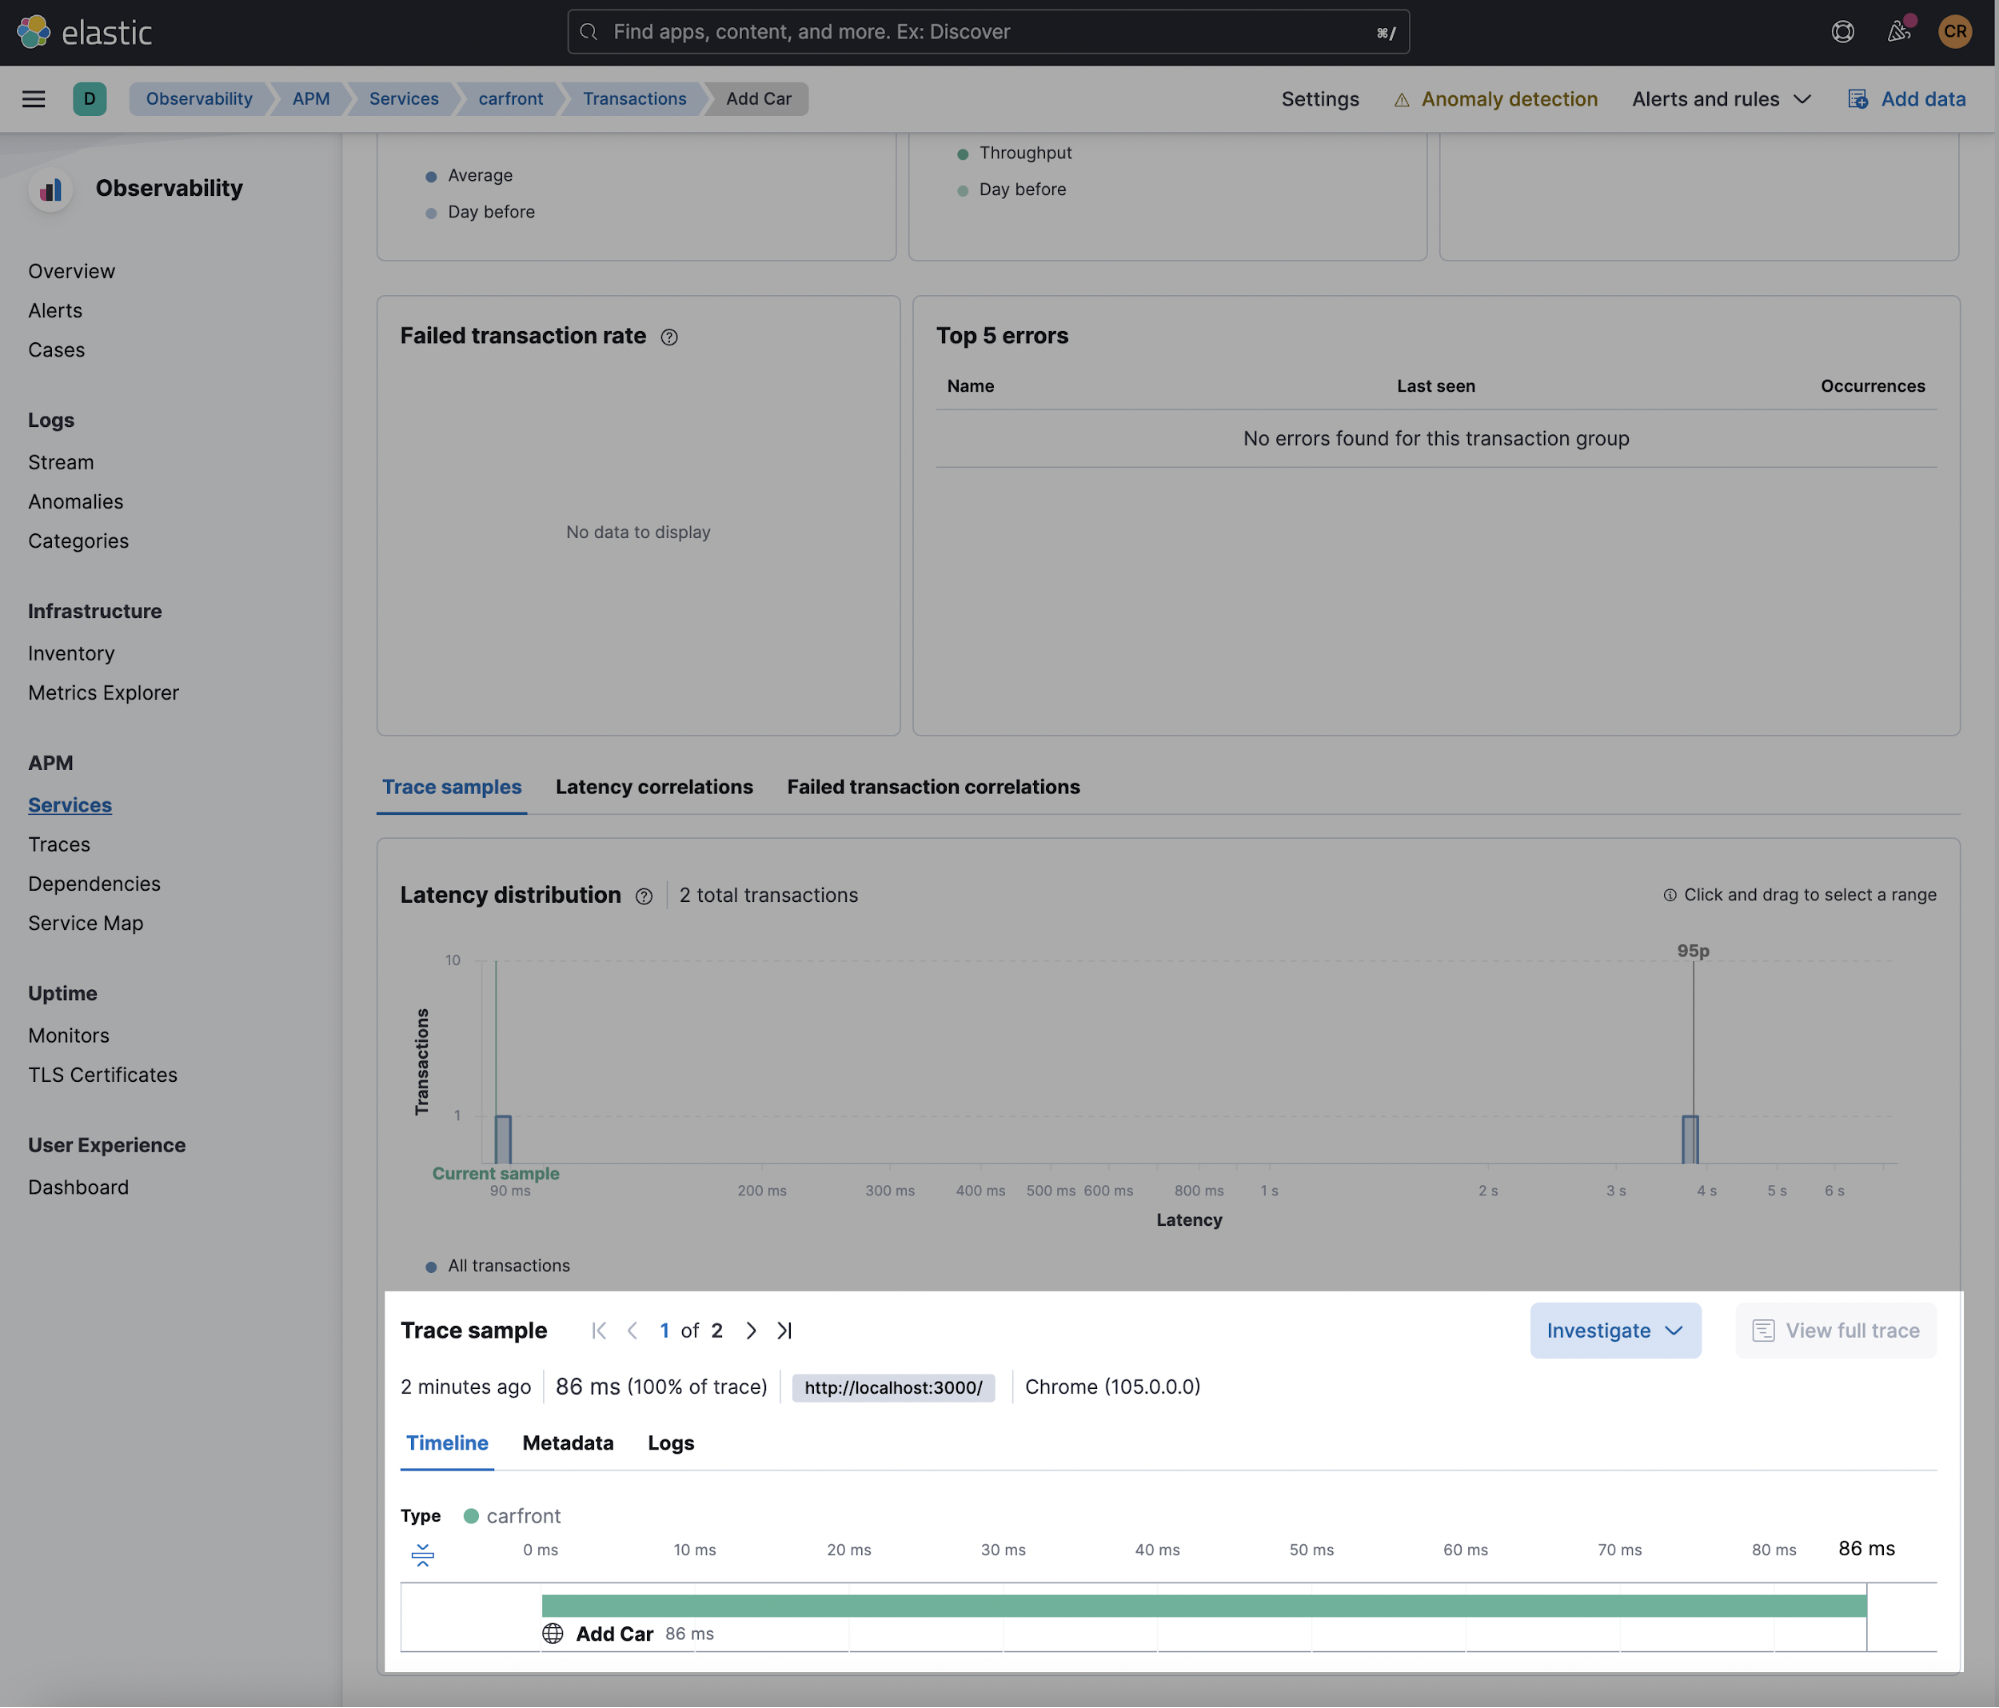
Click on the “Add Car” transaction link. You should see performance information of the custom transaction “Add Car”:
Click on the “Metadata” tab. You will see the labels we added along with the default labels captured by the agent. Labels and logs add valuable contextual information to your APM traces.
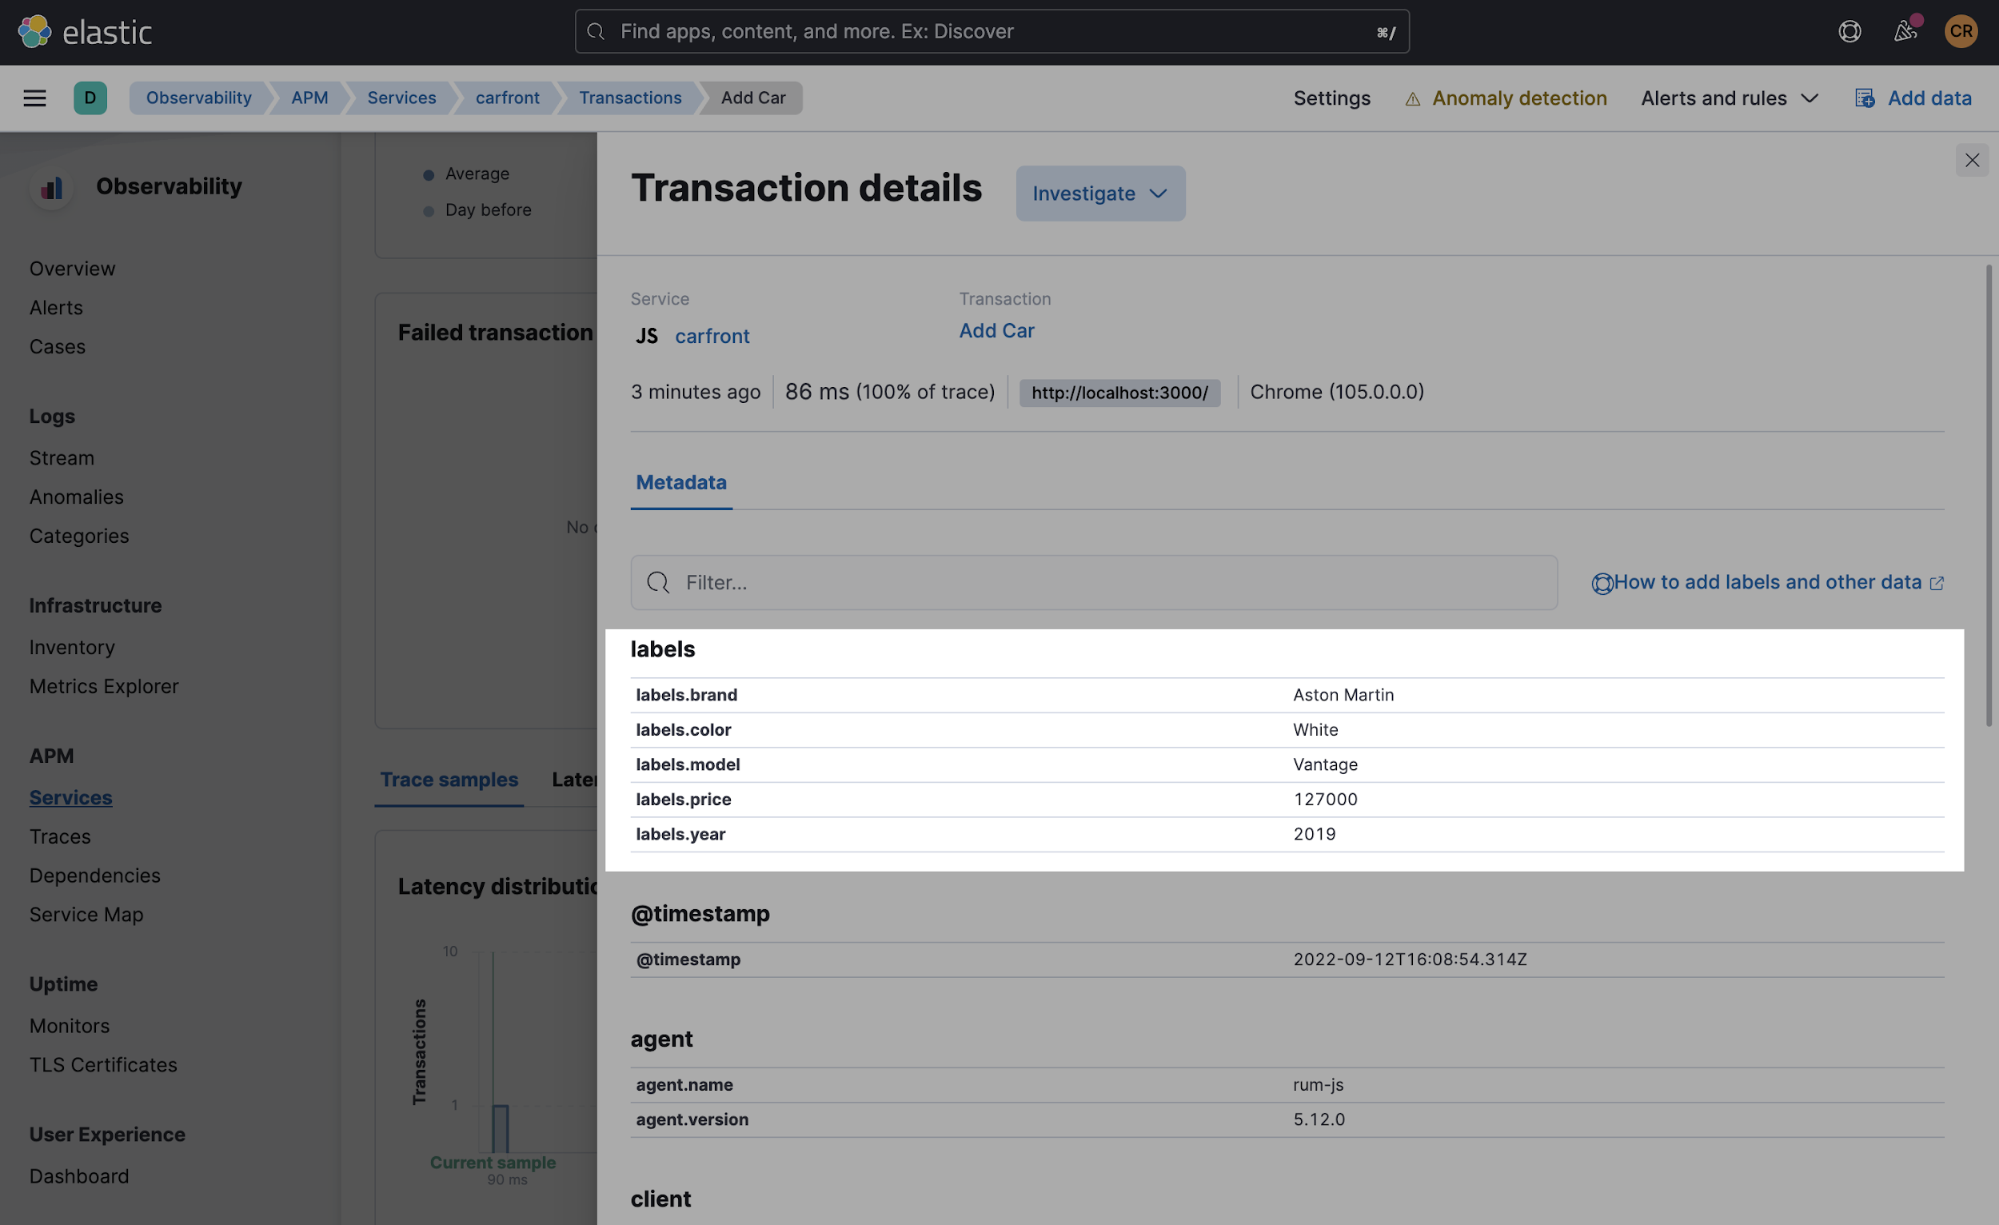
That’s really all it takes to do a custom instrumentation — easy yet powerful! For more details, see the API documentation.
User experience dashboard
Elastic APM offers a curated APM UI and built-in APM dashboards to visualize all the APM data captured by the agents out of the box.
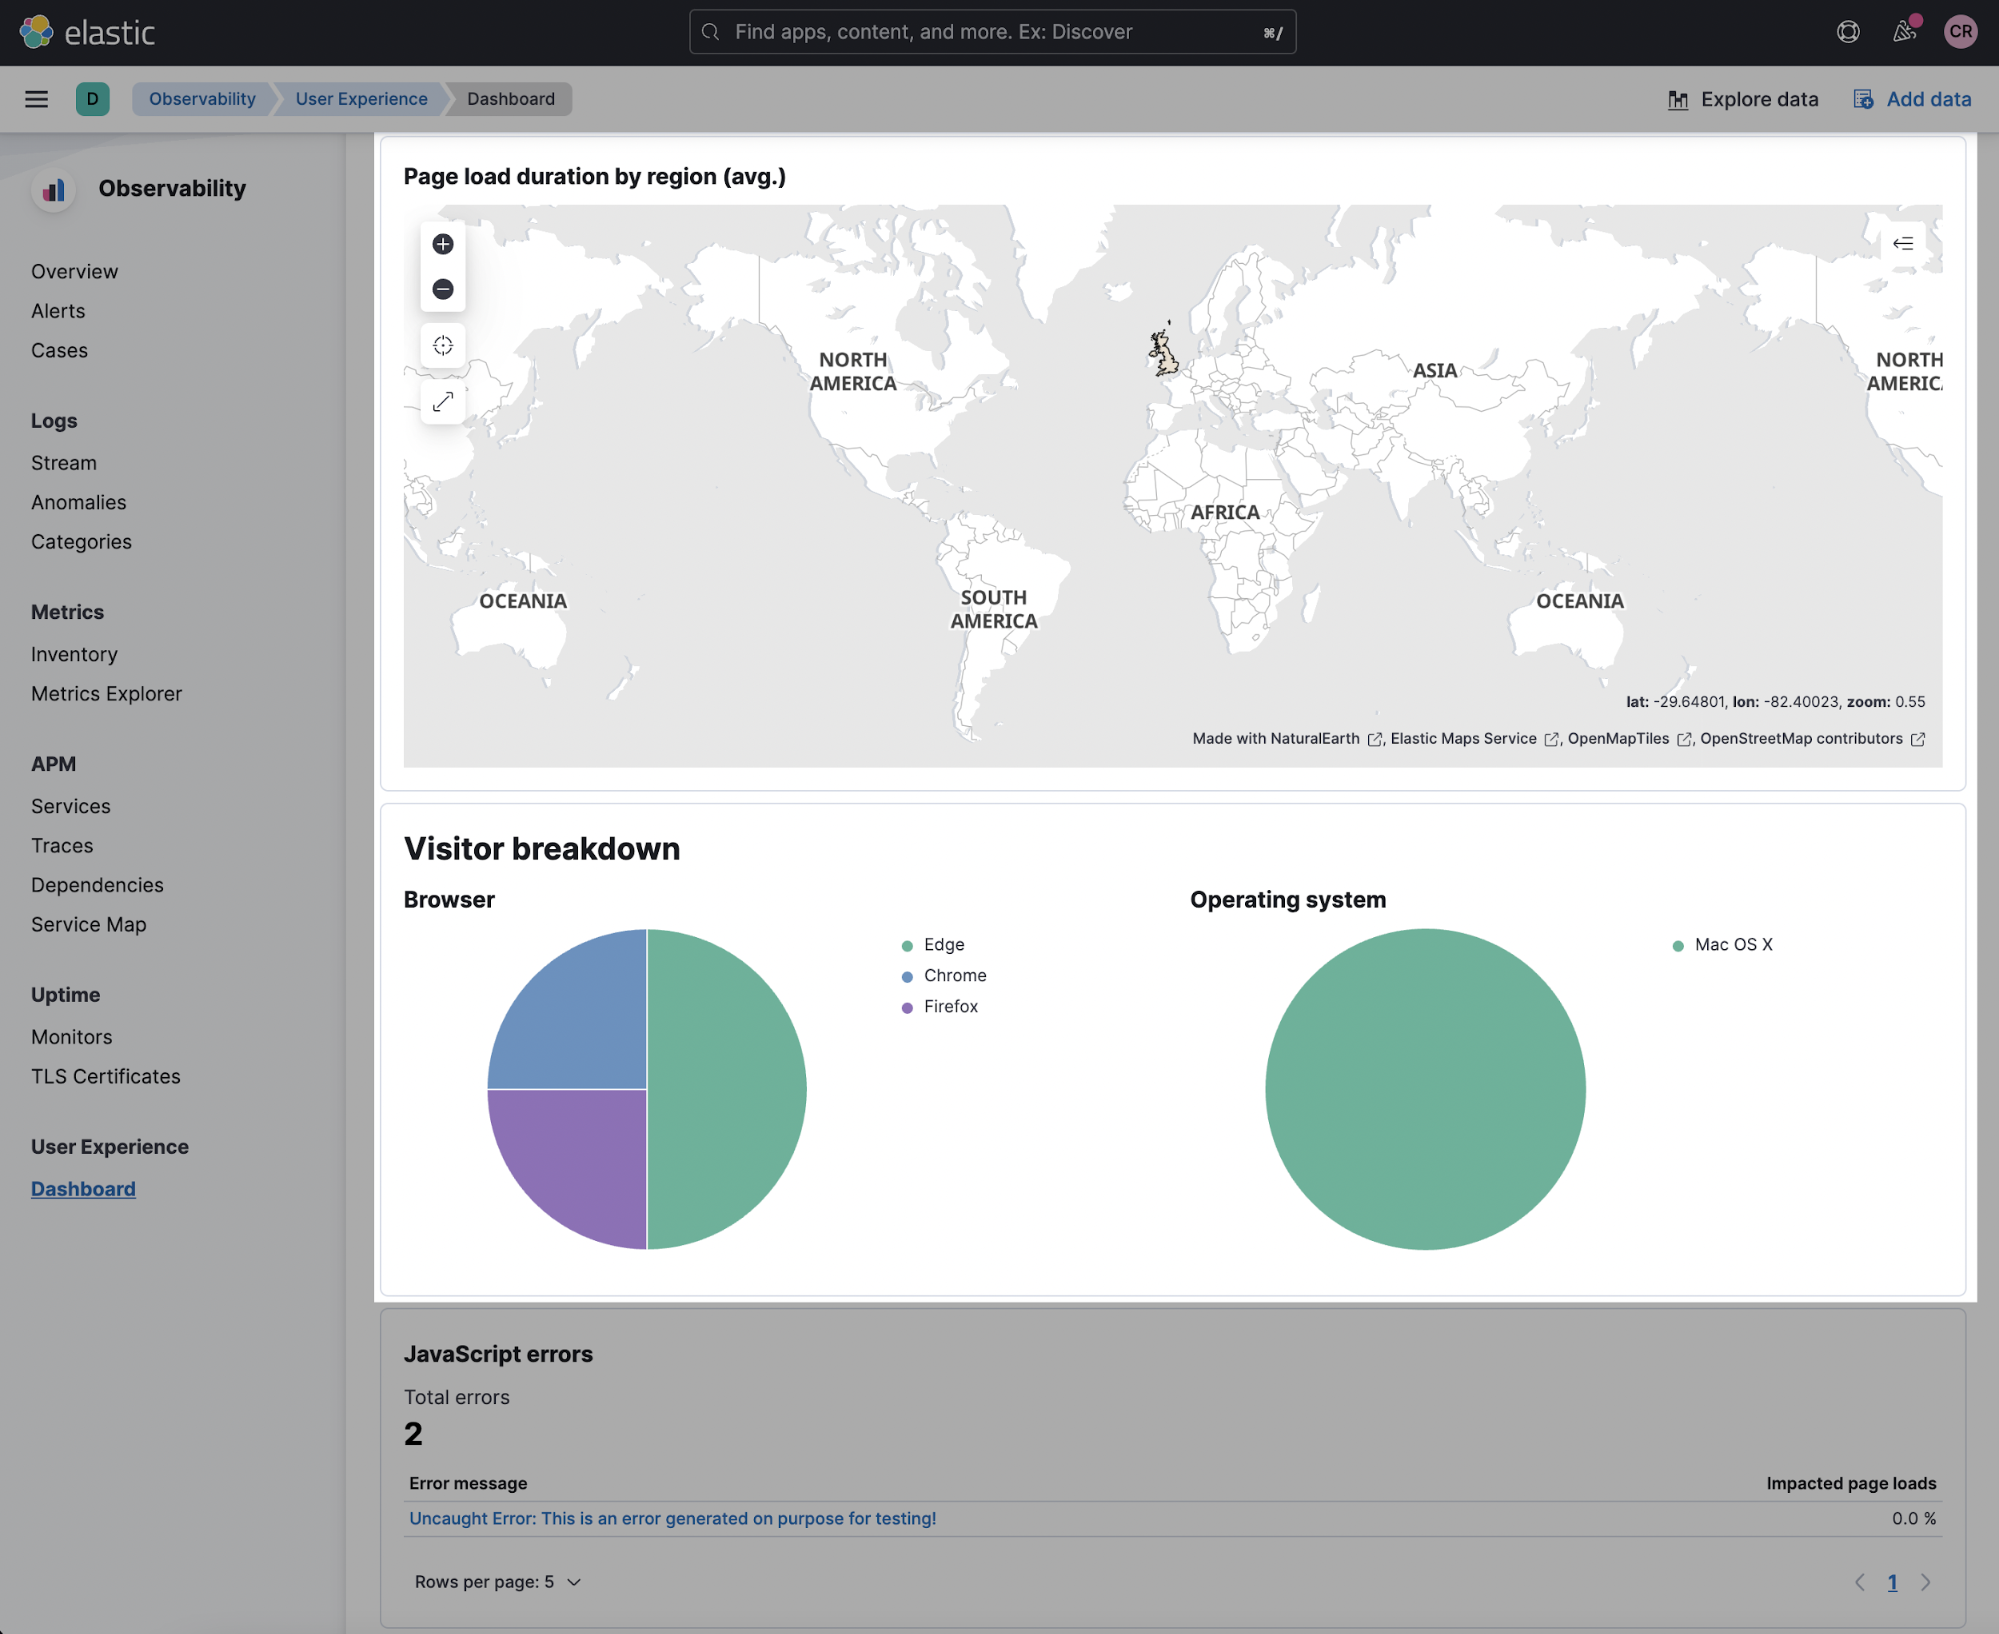
You can also create your own custom visualizations in Elastic using ingest node pipelines to enrich and transform your APM data. For example, the user IP and user agent data captured by the RUM agent represent very rich information about your customers. With all the information of user IP and user agent, it’s possible to create a visualization like this to show where the web traffic comes from on a map and what operating systems and browsers your customers are using.
However, many of the user data of interest could be present in the User Experience Dashboard visible in Elastic Observability. Sample visualizations are presented below:
See the big picture with distributed tracing
As a bonus point, we will also instrument our backend Spring Boot application so that you have a complete view of the overall transaction from the web browser all the way to the backend database, all in one view. Elastic APM distributed tracing enables you to do so.
Configuring distributed tracing in RUM agents
Distributed tracing is enabled by default in the RUM agent. However, it only includes requests made to the same origin. In order to include cross-origin requests, you must set the distributedTracingOrigins configuration option. You will also have to set the CORS policy in the backend application, as we will discuss in the next section.
For our application, the frontend is served from http://localhost:3000. To include requests made to http://localhost:8080, we need to add the distributedtracingOrigins configuration to our React application. This is done inside rum.js. The code is already there. Simply uncommenting the line will do.
var apm = initApm({
  ...
  distributedTracingOrigins: ['http://localhost:8080']
})
New agent versions implement the W3C Trace Context specification and traceparent header to requests made to http://localhost:8080. However, note that previously this was achieved by adding the custom header elastic-apm-traceparent to these requests.
As per the latest version documentation, the server side instrumentation can be configured in three possible ways:
- Automatic attaching to the running JVM using the apm-agent-attach-cli.jar
- Programmatic setup using the apm-agent-attach, which requires a code change to your Java application
- Manual setup using the -javaagent flag, as we shall do in the subsequent example
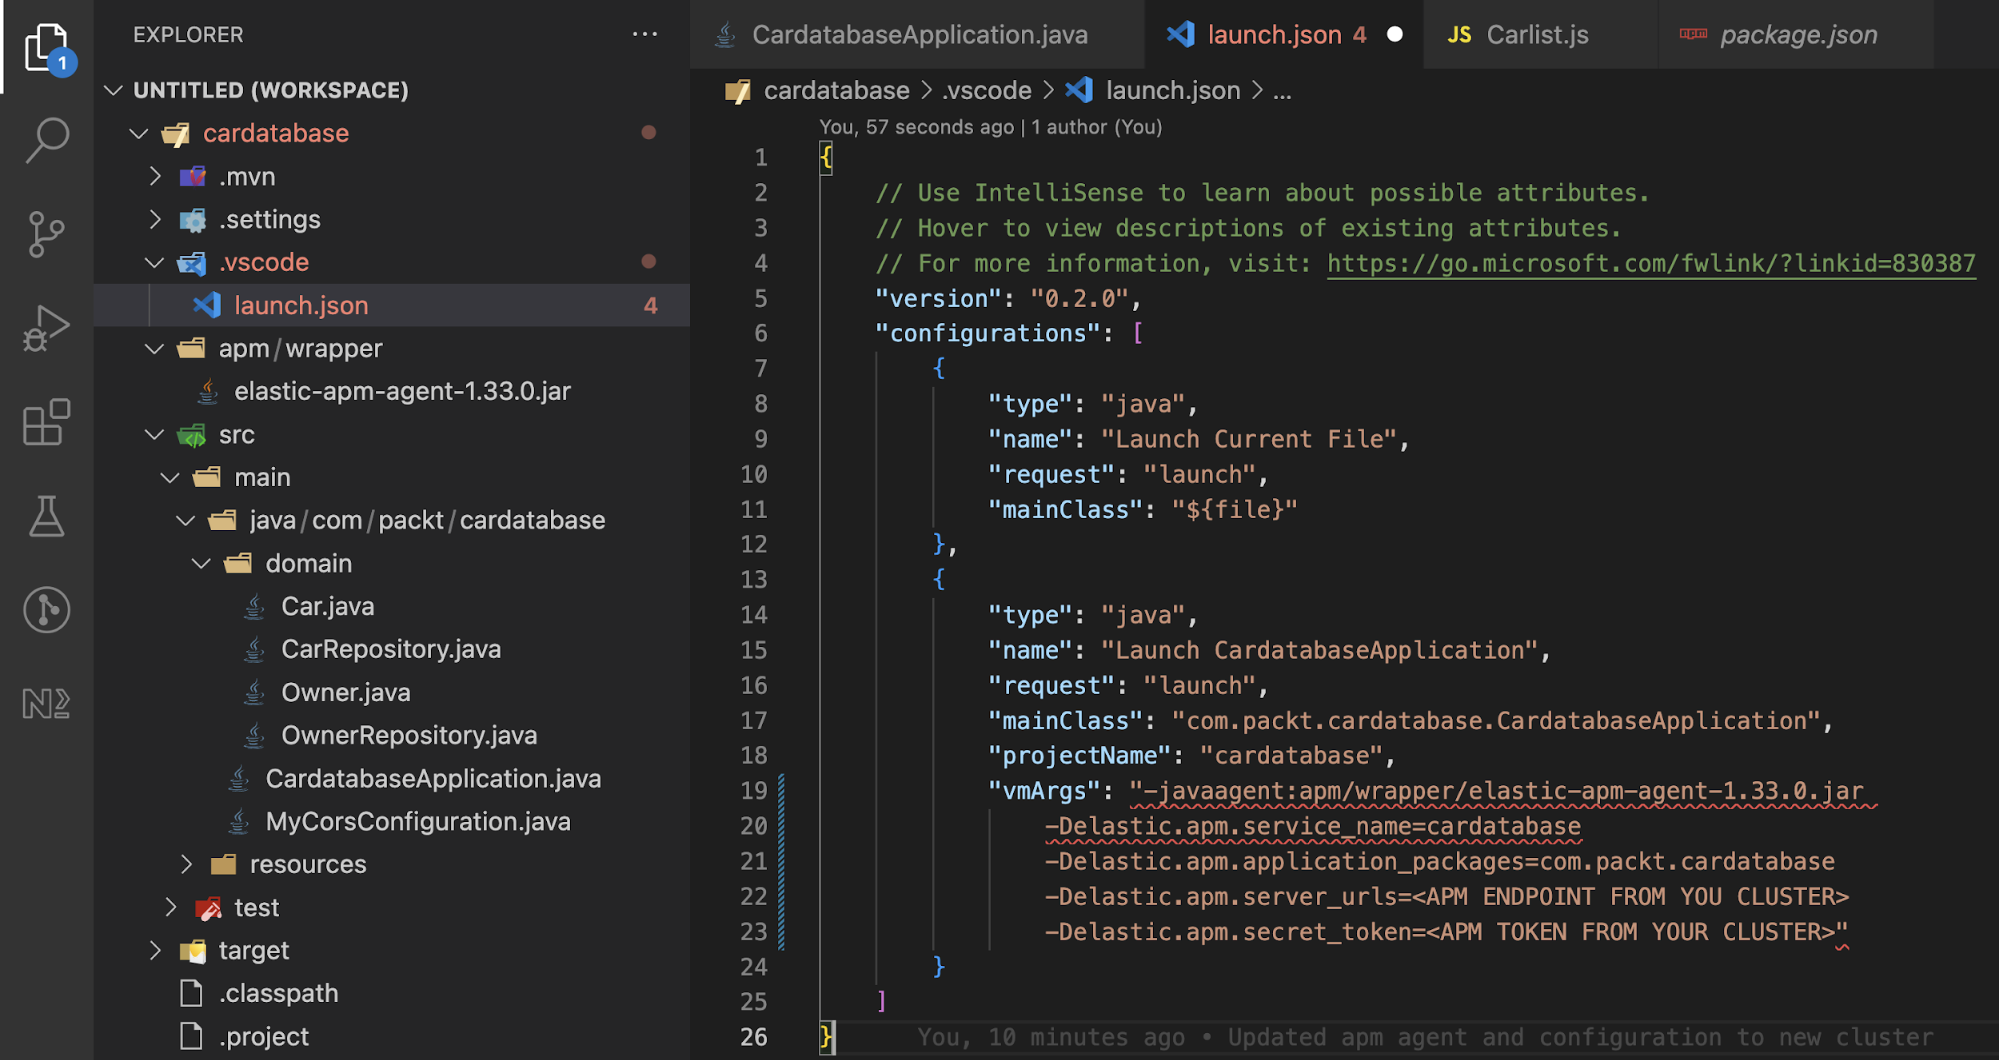
To use the manual instrumentation approach on the server side, you need to download the Java agent and start your application with it. In your favorite IDE, you will need to add the below vmArgs to the launch configuration.
-javaagent:apm/wrapper/elastic-apm-agent-1.33.0.jar
-Delastic.apm.service_name=cardatabase
-Delastic.apm.application_packages=com.packt.cardatabase
-Delastic.apm.server_urls=<YOUR_APM_ENDPOINT>
-Delastic.apm.secret_token=<YOUR_SECRET_TOKEN>
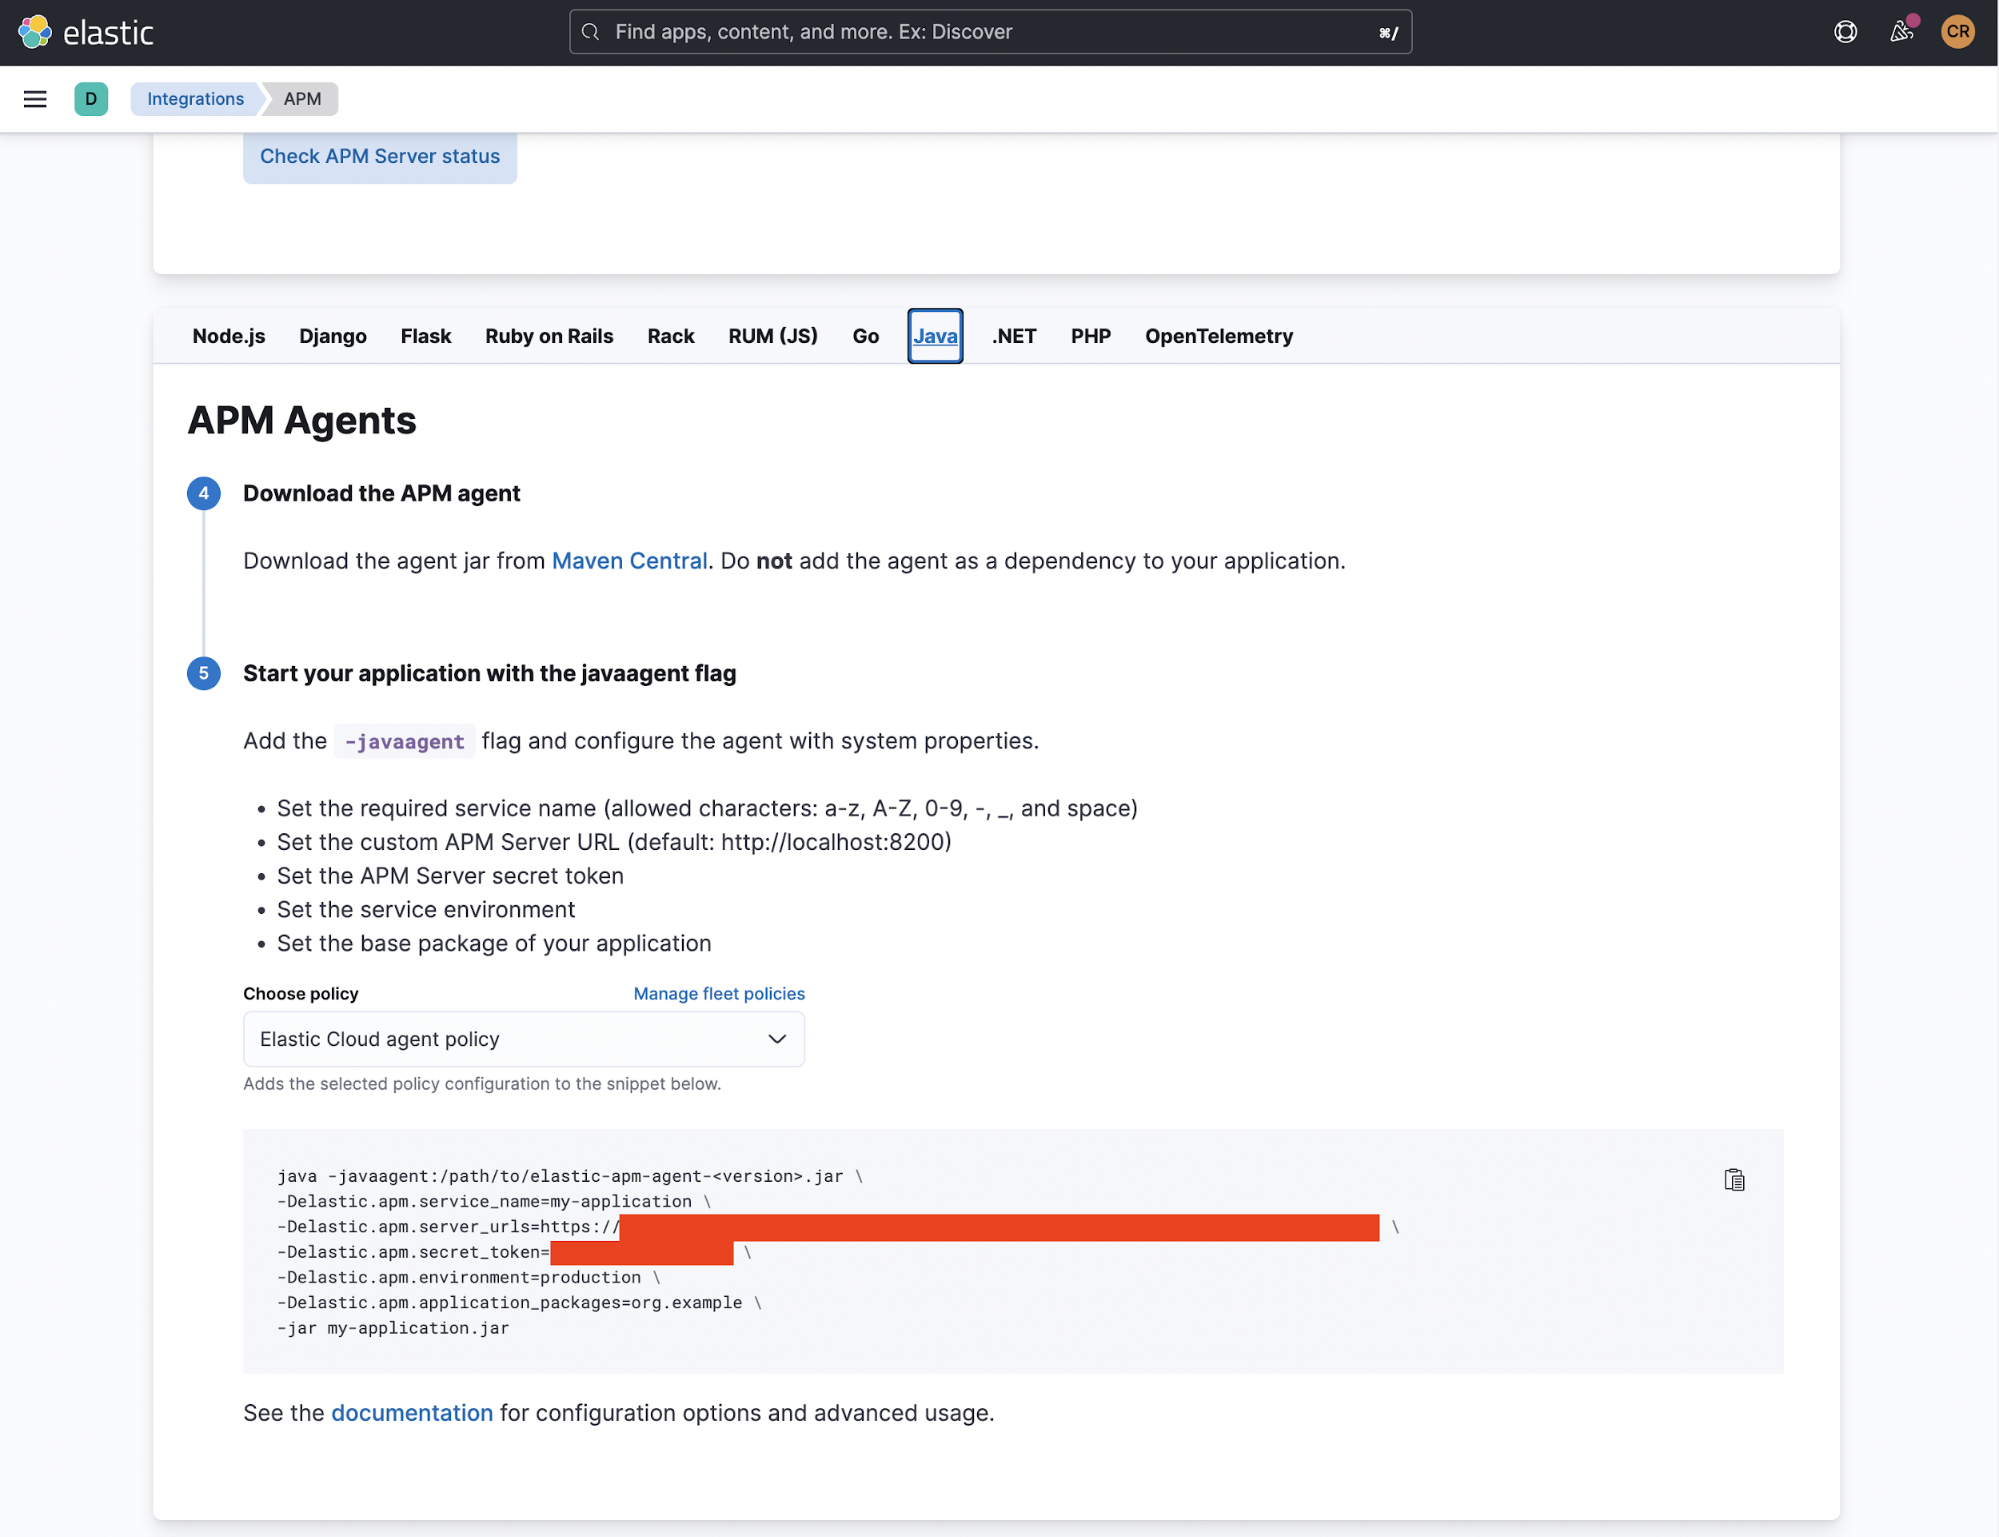
If you are using Elastic Cloud, full configuration for both the RUM and APM agents can be found in the APM Integration of your deployment, a sample of which is visible below.
Where the agents are configured will depend on your IDE of choice. The below screenshot is of my VSCode launch configuration for the Spring Boot application:
Now, refresh your car list from the browser to generate another request. Go to the Kibana APM UI and check the last “car list” page load. You should see a full trace including Java method invocations, similar to the following screenshot:
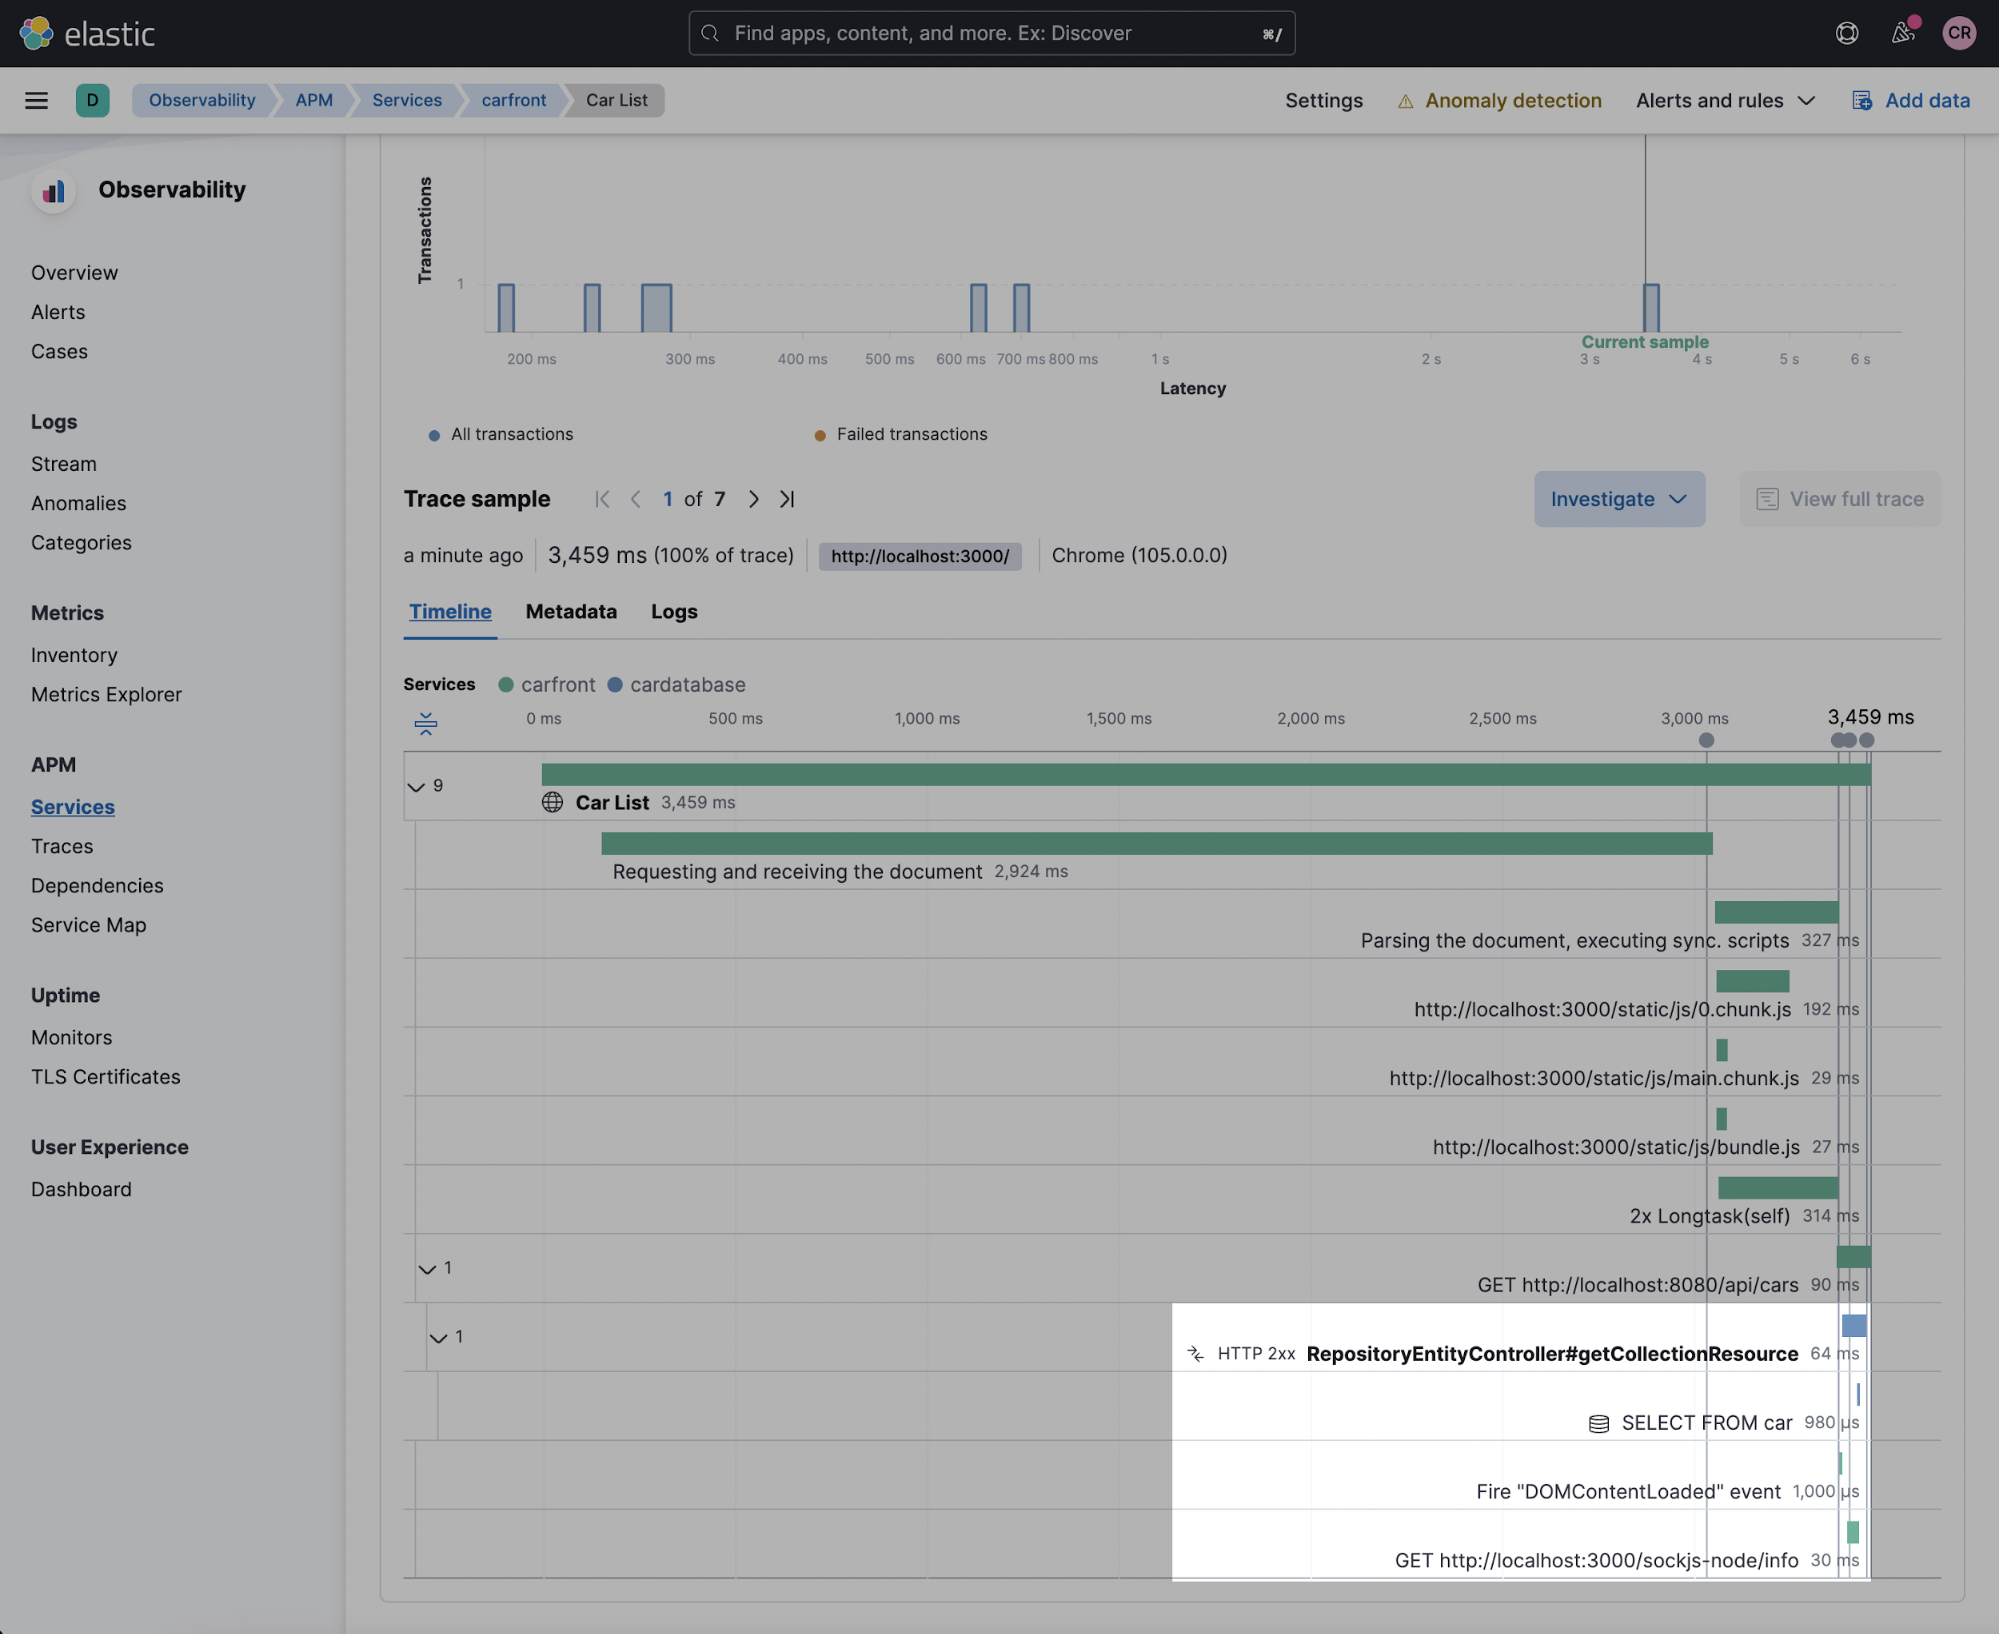
As you can see, your client-side performance data from the browser and your server-side performance data, including JDBC access, all show up nicely in one distributed trace. Notice different colors for different parts of the distributed trace. Keep in mind this is the default tracing you get, without having to do any custom instrumentation on the server side, other than starting your application with the agent. Feel the power of Elastic APM and distributed tracing!
For readers who are really paying attention to the timeline visualization above, you might be wondering why the “Car List” page-load transaction ends at 193 ms, which is the domInteractive time, while data is still being served from the backend. Great question! This is due to the fact that the fetch calls are async by default. The browser “thinks” it finished parsing all the HTML and DOM construction is complete at 193 ms because it loaded all the “static” HTML contents served from the web server. On the other hand, React is still loading data from the backend server asynchronously.
Cross-origin resource sharing (CORS)
The RUM agent is only one piece of the puzzle in a distributed trace. In order to use distributed tracing, we need to properly configure other components, too. One of the things that you will normally have to configure is cross-origin resource sharing, the “notorious” CORS! This is because the frontend and the backend services are typically deployed separately. With the same-origin policy, your frontend requests from a different origin to the backend will fail without properly configured CORS. Basically, CORS is a way for the server side to check if requests coming in from a different origin are allowed. To read more about cross-origin requests and why this process is necessary, please see the MDN page on Cross-Origin Resource Sharing.
What does that mean for us? It means two things:
- We must set the distributedTracingOrigins configuration option, as we have done.
- With that configuration, the RUM agent also sends an HTTP OPTIONS request before the real HTTP request to make sure all the headers and HTTP methods are supported and the origin is allowed. Specifically, http://localhost:8080 will receive an OPTIONS request with the following headers:
Access-Control-Request-Headers: traceparent, tracestate
And APM server should respond to it with these headers and a 200 status code:
Access-Control-Request-Method: [request-method]
Origin: [request-origin]Access-Control-Allow-Headers: traceparent, tracestate
Access-Control-Allow-Methods: [allowed-methods]
Access-Control-Allow-Origin: [request-origin]
The MyCorsConfiguration class in our Spring Boot application does exactly that. There are different ways of configuring Spring Boot to do this, but here we are using a filter based approach. It’s configuring our server-side Spring Boot application to allow requests from any origin with any HTTP headers and any HTTP methods. You may not want to be this open with your production applications.
@Configuration
public class MyCorsConfiguration {
    @Bean
    public FilterRegistrationBean<CorsFilter> corsFilter() {
        UrlBasedCorsConfigurationSource source = new UrlBasedCorsConfigurationSource();
        CorsConfiguration config = new CorsConfiguration();
        config.setAllowCredentials(true);
        config.addAllowedOrigin("*");
        config.addAllowedHeader("*");
        config.addAllowedMethod("*");
        source.registerCorsConfiguration("/**", config);
        FilterRegistrationBean<CorsFilter> bean = new FilterRegistrationBean<CorsFilter>(new CorsFilter(source));
        bean.setOrder(0);
        return bean;
    }
}
Summary
Hopefully, this blog made it clear that instrumenting your applications with Elastic RUM is simple and easy, yet extremely powerful. Together with other APM agents for backend services, RUM gives you a holistic view of application performance from an end-user perspective through distributed tracing.
Once again, to get started with Elastic APM, you can download Elastic APM server to run it locally, or create an Elastic Cloud trial account and have a cluster ready in a few minutes.
As always, reach out on the Elastic APM forum if you want to open up a discussion or have any questions. Happy RUMing!
This post was originally published on April 1, 2019. It was updated on October 20, 2022.