Elastic Universal Profiling™ helps you deliver fast, affordable, and efficient services

 Share on Twitter
Share on Twitter

 Share on LinkedIn
Share on LinkedIn

 Share on Facebook
Share on Facebook

 Share by Email
Share by Email

 Print this page
Print
So, what is Universal Profiling? Universal Profiling is fast emerging as an important component of observability. A standard feature inside hyperscalers since approximately 2010, the technology is slowly percolating into the wider industry. Universal Profiling allows you to see what your code is doing all the time, in production across a wide range of languages and can profile both user-space and kernel-space code. It can be used in containerized or non-containerized environments, and provides a powerful UI to unearth inefficiencies and optimization opportunities throughout your entire fleet.
As recently as two to three years ago, very few fleet-wide continuous profiling products existed. As of 2022, there is a plethora of APM vendors and other projects that provide some form of continuous profiling.
Unfortunately, these solutions have many shortcomings in practice:
- They often rely on per-app instrumentation, requiring each team to make changes to their app.
- Most of them require service restarts.
- They often do not have broad coverage allowing you to see what’s happening outside the specific process you are profiling.
- They tend to have large overheads.
With last year's acquisition of Optimyze, we set out to bring the benefits of Universal Profiling to a broad audience, with a continuous profiler that “just works.” Given a fleet of hundreds or thousands of ARM or x86 nodes, you can just deploy it and get profiling for the entire system and all applications running on the fleet immediately.
Here are just a few ways in which Elastic Universal Profiling is a leap forward:
1 - Profile in production: No frame pointers needed, no debug symbols needed, no service restarts, and no instrumentation
One of the big hurdles to profiling is that upstream dependencies are often compiled with frame pointer omission – a particular compiler feature that complicates unwinding of stacks during the collection of profiling data.
The result of this is that all other profilers require either Performance Monitoring Counter (PMC) access (which is not available in most virtualized environments) or debug symbols for all dependencies (which is time-consuming to obtain, disk-space-intensive, and generally deemed bad practice for production systems).
Elastic Universal Profiling is different. Elastic Universal Profiling can unwind stack traces even if the frame pointer has been omitted, without debug symbols present, and without PMC access.
Elastic Universal Profiling achieves this by doing some fairly heavy lifting from eBPF.
eBPF also helps achieve zero-instrumentation and enables the ability to capture exactly the data that we need and want in exactly the format that we want, and will only export this data out of the kernel once.
This helps to make it much easier to get additional critical performance data from your applications that are running in production and will help you make all parts of your software faster and more efficient.
2 - Profile everything, all the time: Our agent strives for < 1% CPU and < 250MB of RAM
A common complaint among users is that existing APM and profiling agents are resource hungry. They cannot be run in production environments without impacting the service they're analyzing, or in order to do so, they need to be restricted to a subset of services and a subset of the fleet. When an outage happens, or a performance incident occurs, this often means that the required data isn't available as the incident relates to a different machine, or a different application, to the ones being observed.
Elastic Universal Profiling has been built from the ground up to minimize CPU and RAM usage, as well as network traffic. The profiler observes the entire system, without the need for integration with individual applications, and does so while using minimal system resources.
This means that for many use cases it can be run all the time, even in production, ensuring that you have total insight into your fleet.
3 - Total observability, combined with powerful filtering
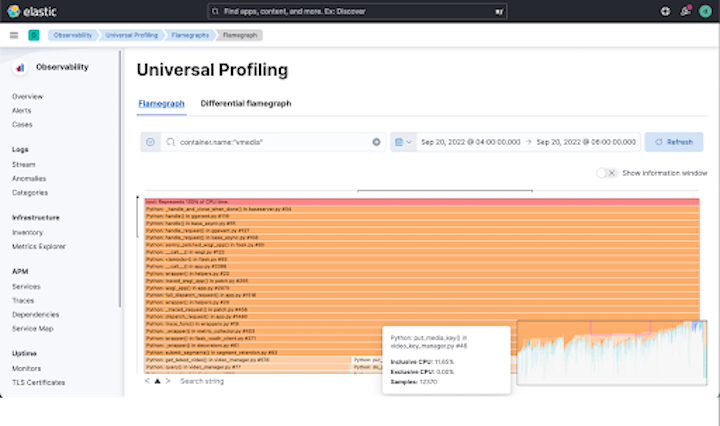
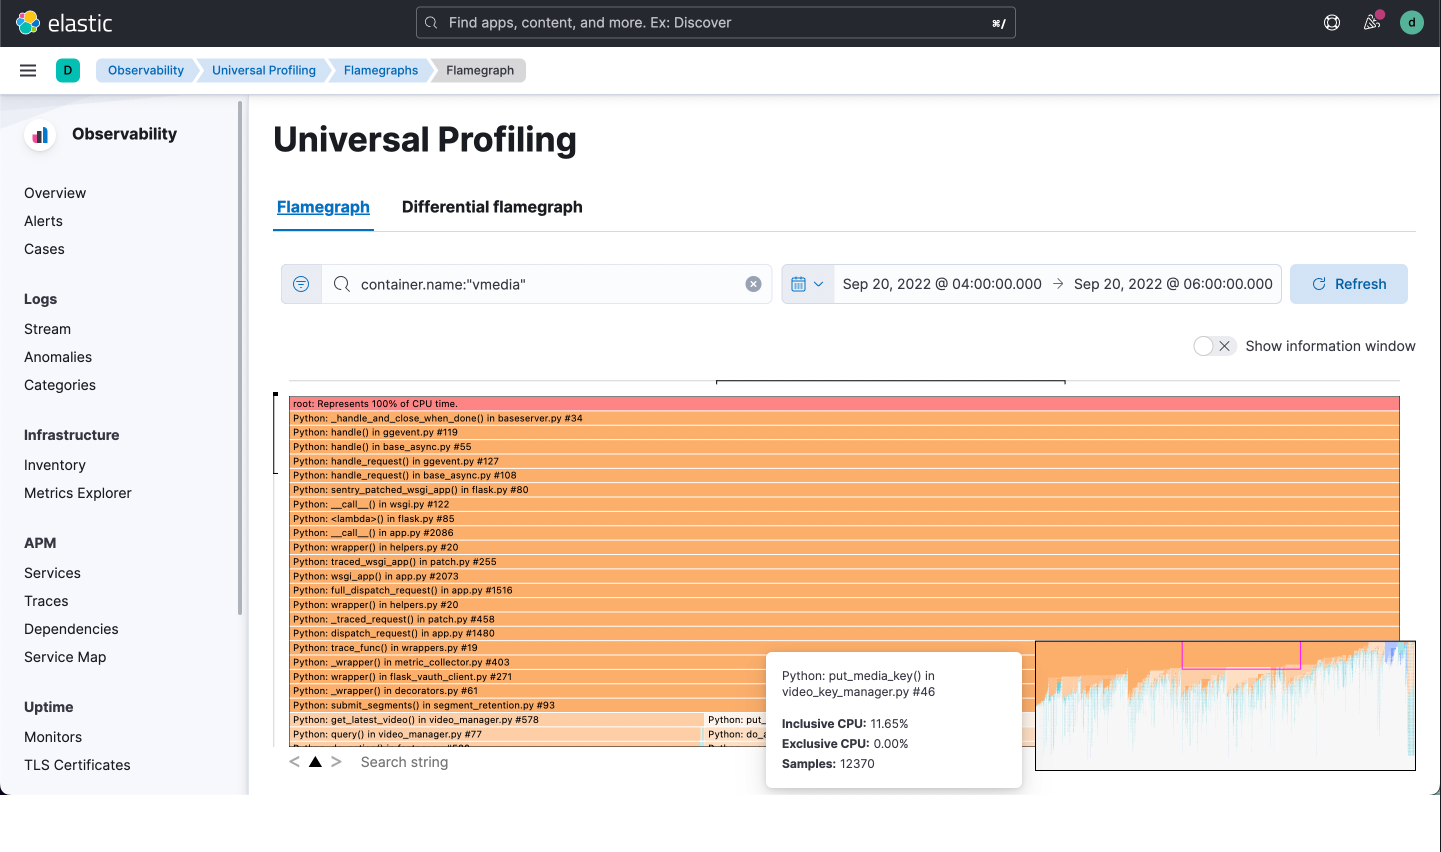
Do you want a flamegraph over your entire fleet of 1,000 machines for the last month? Or do you prefer a flamegraph for a particular service on a particular node yesterday night from 1am to 1:15am?
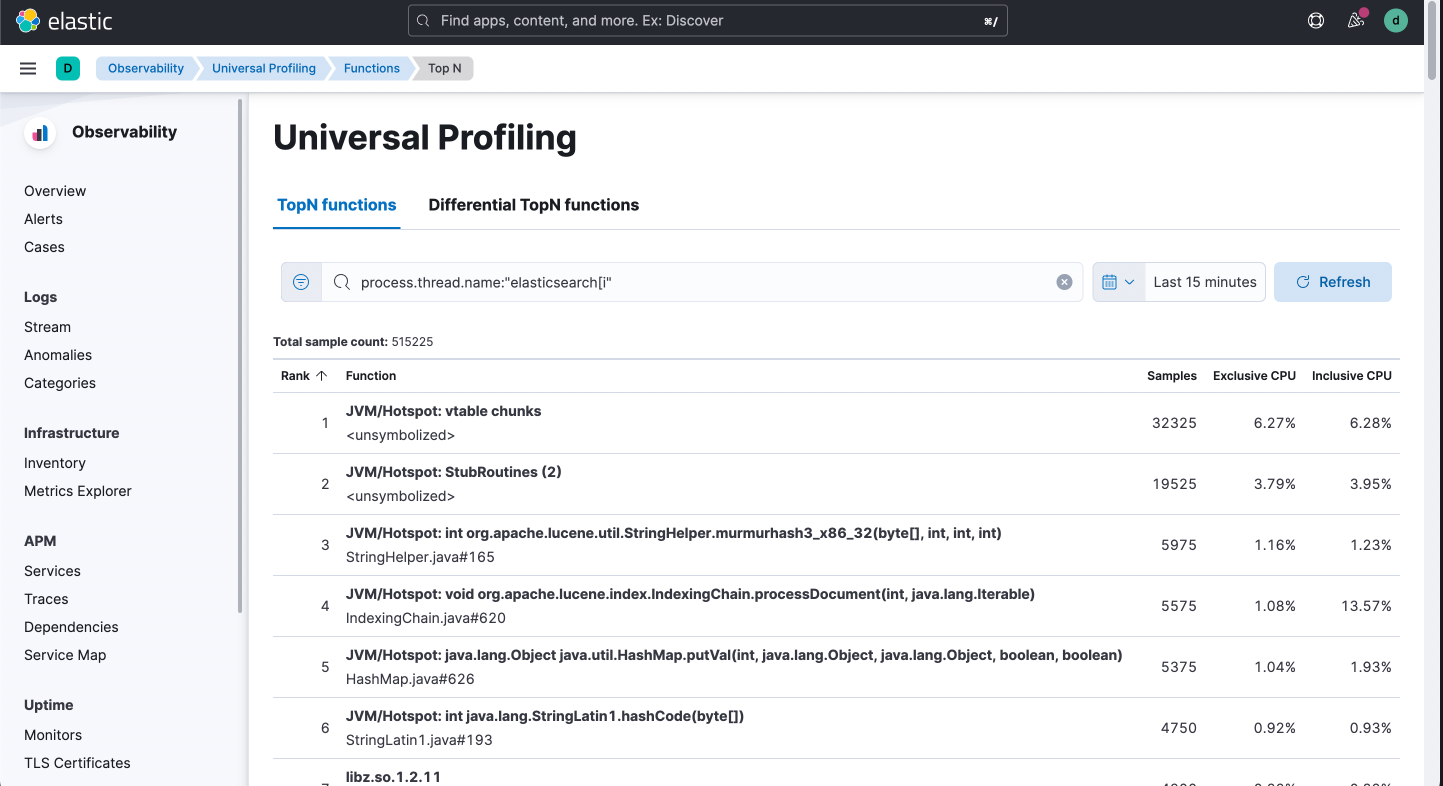
Elastic Universal Profiling has you covered. Our powerful filtering using Elastic Query Language allows drill-down on individual hosts, pods, containers, and even thread names.
The efficiencies of our agent, combined with our storage backend and UI, mean you can gather data from your entire fleet, and then later slice and dice it as you wish. This approach to total observability means you're never without the data you need and you have the ability to hone in on exactly the information required to debug outages and performance issues.
It's the perfect observability solution, with observability in general, we see that a lot of people have trouble doing all the work that's needed. With most other observability signals (traces, logs, metrics), it is difficult to do and involves a heavy lift. Profiling itself, though, is so close to how the operating system executes code, it works really well to get the performance data you need with low friction.
So there you have it, profiling with zero-instrumentation, low overheads and powerful filtering will give you the opportunity to create services that are faster, cheaper, and as an environmental bonus, you can reduce your CO2 footprint, since savings in CPU consumption translates directly into savings in power consumption.
Elastic Universal Profiling is geared toward profiling everything, everywhere, all the time. With a low overhead, low-friction, and zero-instrumentation agent, combined with a UI that can quickly visualize data from your entire fleet, and powerful filtering, you can quickly find the low hanging fruit to optimize your software across your entire enterprise estate.
Sign up here to register your interest!
The release and timing of any features or functionality described in this post remain at Elastic's sole discretion. Any features or functionality not currently available may not be delivered on time or at all.
Share
- Share on Twitter
Share on Twitter
- Share on LinkedIn
Share on LinkedIn
- Share on Facebook
Share on Facebook
- Share by Email
Share by Email
- Print this page
Print