New in Kibana: How we made it easier to manage visualizations and build dashboards
Our Kibana team has been hard at work implementing and executing on a new Kibana strategic vision to streamline the dashboard creation process and sand down the rough edges of creating visualizations for dashboards. We accomplished our goal and reduced the overall time it takes users to go from a blank slate to a meaningful dashboard that conveys insights about the data.
In this post, I’m going to explain the technical concepts behind these improvements, and how they work to create a user-friendly and efficient dashboard creation process. My hope for this post is that it helps inform the mental models of our curious power users while they attempt to learn these new dashboard creation flows. For a high-level walkthrough of the Kibana features, check out our other blog post, Building Kibana dashboards more efficiently.
By-ref vs By-value
Before describing the new flow in detail, it’s helpful to understand how visualizations live on the dashboard. A dashboard is populated with panels. Each panel has what’s known as an embeddable. Embeddables are responsible for displaying your visualization, whether it’s a chart, map, or tag cloud.
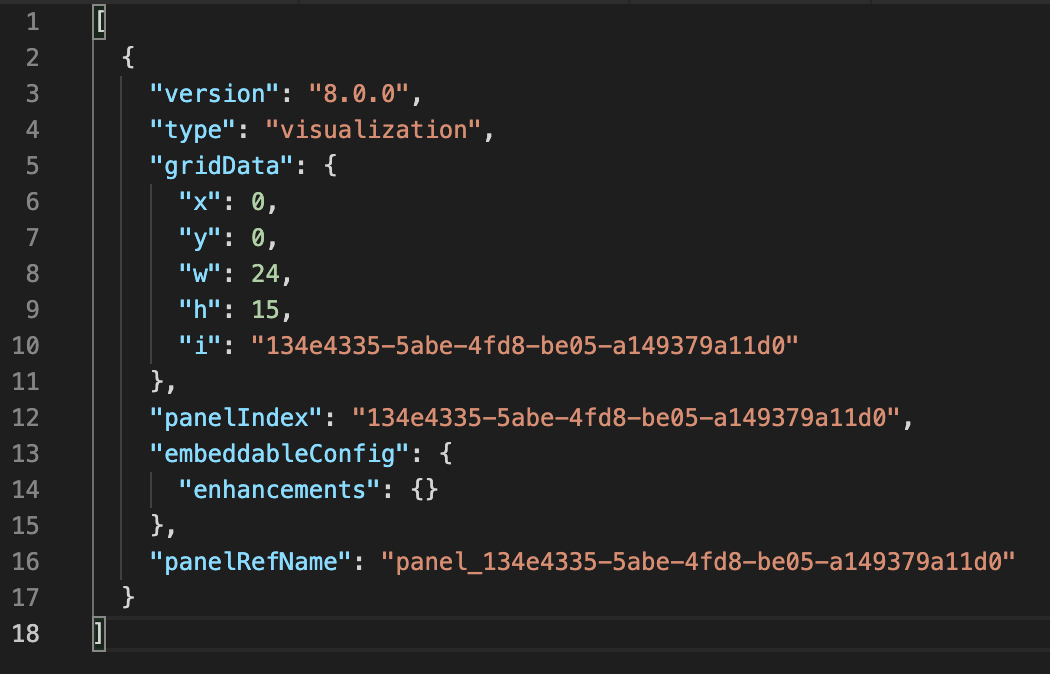
In 7.11 and earlier, all visualization panels that you added to a dashboard were by-reference embeddables. Kibana stores by-reference embeddables as saved objects, which contain a saved object ID that is used to render the visualization in the panel. When you export a dashboard with by-reference embeddables from Stack Management, then view the NDJSON file, the dashboard JSON object contains a list of by-reference embeddables and their IDs.
In 7.12, you can now also add by-value embeddables to your dashboards.
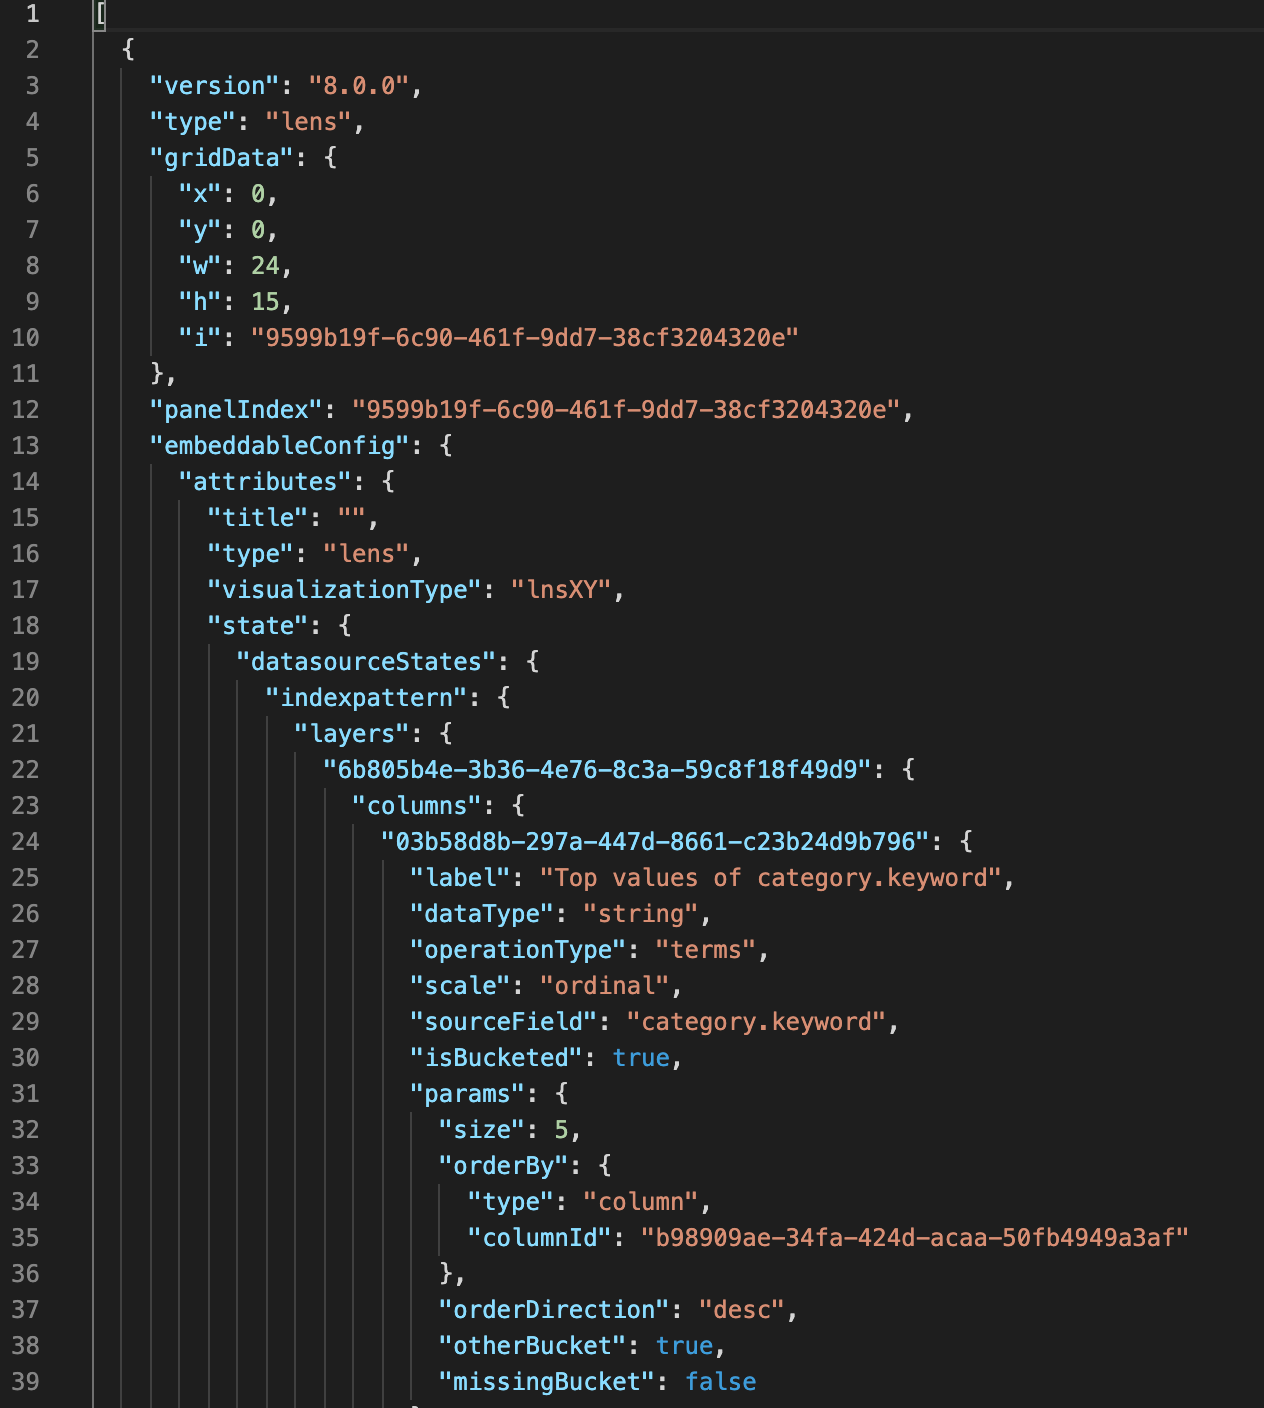
By-value embeddables are NOT saved in the Visualize Library. Instead, everything that the dashboard needs to render the visualization is packaged in the by-value embeddable that is stored in the dashboard data structure. Visualizations contained within by-value embeddables only exist within the dashboard. If you compare the JSON of a dashboard with only by-value embeddables to a dashboard with only by-reference embeddables, you’d see that the dashboard with by-value embeddables contains much more information than the by-reference embeddable dashboard.
Out with the old, in with the new (if you want)
Previously, when you created a dashboard, you could use Lens or Maps to create your visualizations, save it to Kibana, go back to your dashboard, then add your new visualization. There’s a lot of steps in this workflow. Additionally, when you are forced to save every visualization you create, the list of saved visualizations becomes so long that it is difficult to quickly find what you need.
In 7.12, the new flow is streamlined so you can spin up dashboards as quickly as possible. To create a dashboard, you select Create panel, select a visualization type, then create your visualization. When your visualization looks correct, you now simply click Save and return to instantly return to the dashboard with your new visualization. The new visualization is a by-value embeddable and only exists within your dashboard. This means you can freely edit or delete the visualization without affecting other dashboards or visualizations. This is the dashboard-first flow: if you create a visualization directly from a dashboard, you are returned directly to the dashboard with your new visualization when you select Save and return.
Create visualizations for reuse
When you create visualizations directly in Visualize, Lens, or Maps, then select Save, you are presented with a new save modal. From this modal, you can add a title and description to your visualization per usual, but now you have the option to add the visualization directly to a new dashboard, an existing dashboard, or to the Visualize Library. If you add the visualization to your dashboard, the visualization is added by-value which, to reiterate, means it will only exist within your dashboard. If you plan to re-use the visualization in multiple places (perhaps on several dashboards or in a Canvas workpad), you’ll want to select the Add to library option, which saves the visualization to the Visualize Library.
You can have dashboards that contain visualizations powered by both by-value embeddables and by-reference embeddables to fit your workflow and use case.
Create visualizations for a single dashboard
Visualizations that exist in the Visualize Library display a folder icon in the panel heading on your dashboard. If you want to decouple the visualization from the Visualize Library, you can select Unlink from library from the panel menu.
With the by-value version, you can edit the visualization without changing the version that exists in Visualize Library, or how the visualization functions on other dashboards. If you change your mind, you can add the visualization to the Visualize Library from the panel menu.
We hope that with these new flows at your disposal, you are able to create actionable and useful dashboards quicker than ever before.