Monitoring AWS EC2 using Metricbeat
Starting with 7.0, we introduced a new module in Metricbeat to monitor Amazon Web Services. At the time of the initial release in 7.0.0-beta1, this AWS module provides ability to collect AWS EC2 monitoring metrics from Cloudwatch using Metricbeat and stores them in a metric set called ec2. These metrics provide visibility into all EC2 instances across regions without the need to install Metricbeat directly onto the instances.
Background
Amazon Elastic Compute Cloud (EC2) instances are virtual servers that are created on the AWS platform to provide users with secure and resizable compute capacity in the public cloud. EC2 is arguably the most critical service out of hundreds provided by AWS -- virtually everyone needs access to raw compute resources.
Monitoring EC2 instances centrally to help users detect and debug issues is challenging. Metricbeat can already collect detailed resource metrics using the system module, but this requires installing an instance of Metricbeat on each of your EC2 instances. While the metrics it collects are very detailed and granular, sometimes you just want a quick way to get visibility into resource usage of all your EC2 instances at a high level.
This is where AWS Cloudwatch comes in. Cloudwatch automatically collects and centralizes basic resource utilization metrics from all your EC2 instances. This data is collected at a 5-minute granularity by default, and you can sign up for detailed monitoring to get higher granularity and more advanced metrics.
Configuring Metricbeat AWS
Before getting started with Metricbeat, you will need a running Elastic Stack, which includes Elasticsearch for storing and indexing the data and Kibana for data exploration. For this you can either create a cluster in Elasticsearch Service on Elastic Cloud or set up the Elastic Stack on your local machine.
Once you loaded Kibana, you can navigate to the Add Data UI from the home screen and follow the AWS module setup instructions from there.
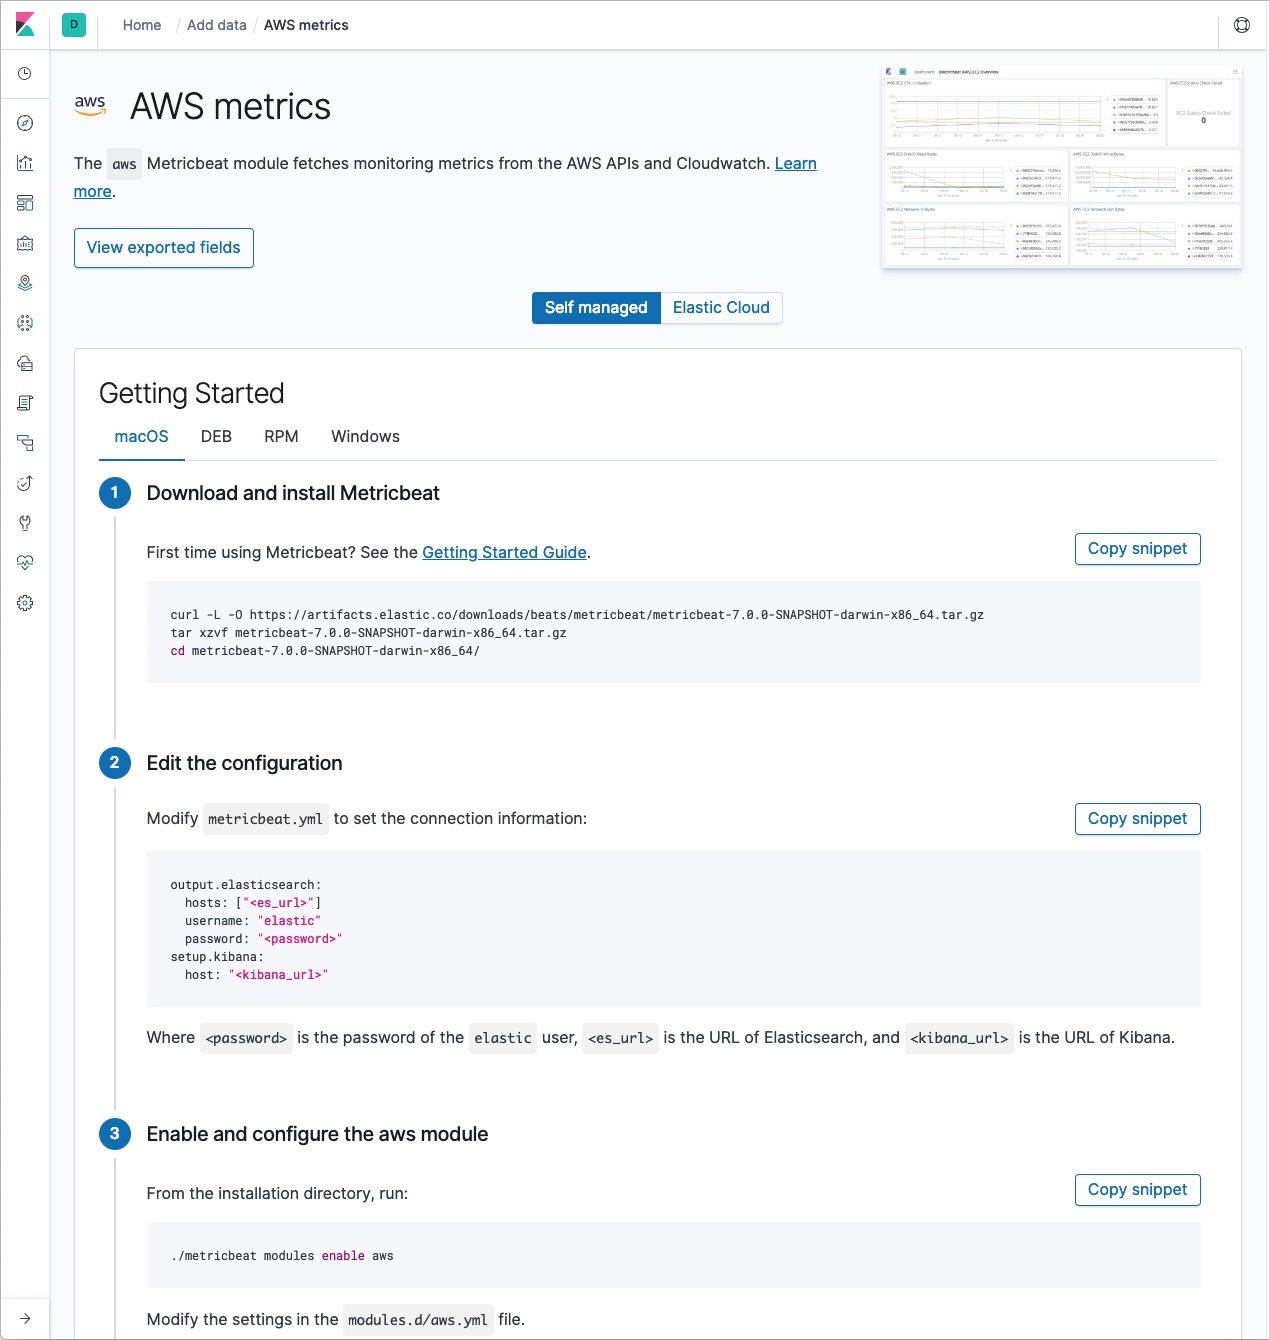
This blog will walk you through them in more detail below.
Enable the AWS module
In the out-of-box configuration of Metricbeat, only the system module is enabled by default, so you will need to explicitly enable the AWS module. The following command enables the AWS configuration in the modules.d directory on MacOS and Linux systems:
./metricbeat modules enable aws
Set AWS credentials in the config file
There are two different kinds of AWS credentials which can be used: access keys and temporary security credentials. Access key ID and secret access key are the two parts of access keys. They are long-term credentials for an IAM user or the AWS account root user to authenticate when making AWS API calls. Temporary security credentials consist of an access key ID, a secret access key, and a security token, which have a limited lifetime.
Because temporary security credentials are short term, after they expire, you need to generate new ones and modify modules.d/aws.yml config file with the new credentials. Unless live reloading feature is enabled for Metricbeat, you need to manually restart Metricbeat after updating the config. This will cause data collection to stop, if the config file is not updated with new credentials before the old ones expire. As a result, for Metricbeat, we recommend you to use access keys in config file to enable the AWS module making AWS API calls without have to generate new temporary credentials and update the config frequently.
Create an IAM policy
An IAM policy is an entity that defines permissions to an object within your AWS environment. Creating a customized IAM policy for Metricbeat with specific permissions is needed. Please see Creating IAM Policies for more details. After Metricbeat IAM policy is created, you need to add this policy to the IAM user which provided the credentials in the previous step.
With the EC2 metric set, four permissions need to be added into Metricbeat IAM policy:
ec2:DescribeRegionsec2:DescribeInstancescloudwatch:ListMetricscloudwatch:GetMetricData
Start Metricbeat
Usage running on mac and linux system as an example:
./metricbeat -E setup.dashboards.enabled=true -e
Note: If you are running Metricbeat from a virtual machine on a cloud instance, such as GCP, AWS, or Azure, you will want to remove or comment out the add_cloud_metadata entry in metricbeat.yml.
Once the EC2 metric set is enabled in Metricbeat with proper AWS credentials, Metricbeat will periodically fetch information about each instance and collect EC2 monitoring metrics from AWS Cloudwatch. The default collection period for the EC2 metric set is 300 seconds. If detailed monitoring for instances are enabled, the EC2 metric set collection period should be changed to 60s, since that paid tier provides higher-granularity metrics collection. The collection period is set in modules.d/aws.yml file, for example:
- module: aws
  period: 60s
  metricsets:
    - "ec2"
  access_key_id: '${AWS_ACCESS_KEY_ID:""}'
  secret_access_key: '${AWS_SECRET_ACCESS_KEY:""}'
  session_token: '${AWS_SESSION_TOKEN:""}'
  default_region: '${AWS_REGION:us-west-1}'
The EC2 metric set will discover new instances automatically and start collecting metrics from them. If an EC2 instance is stopped or terminated, the EC2 metric set will discover the instance state change in next collection cycle and send the new state metric to Elasticsearch.
Using the Kibana AWS module dashboard
The EC2 metric set includes a predefined dashboard, called [Metricbeat AWS] EC2 Overview. By running the setup command when you started Metricbeat, you have automatically set up these dashboards in Kibana. For more information on this, please see Set up the Kibana dashboards.
This dashboard is an overview of AWS EC2 instances. It shows state and status checks for instances, as well as CPU utilization, network, and disk I/O data. There are also filters that you can apply to narrow the data to a specific region, an availability zone or a machine type.
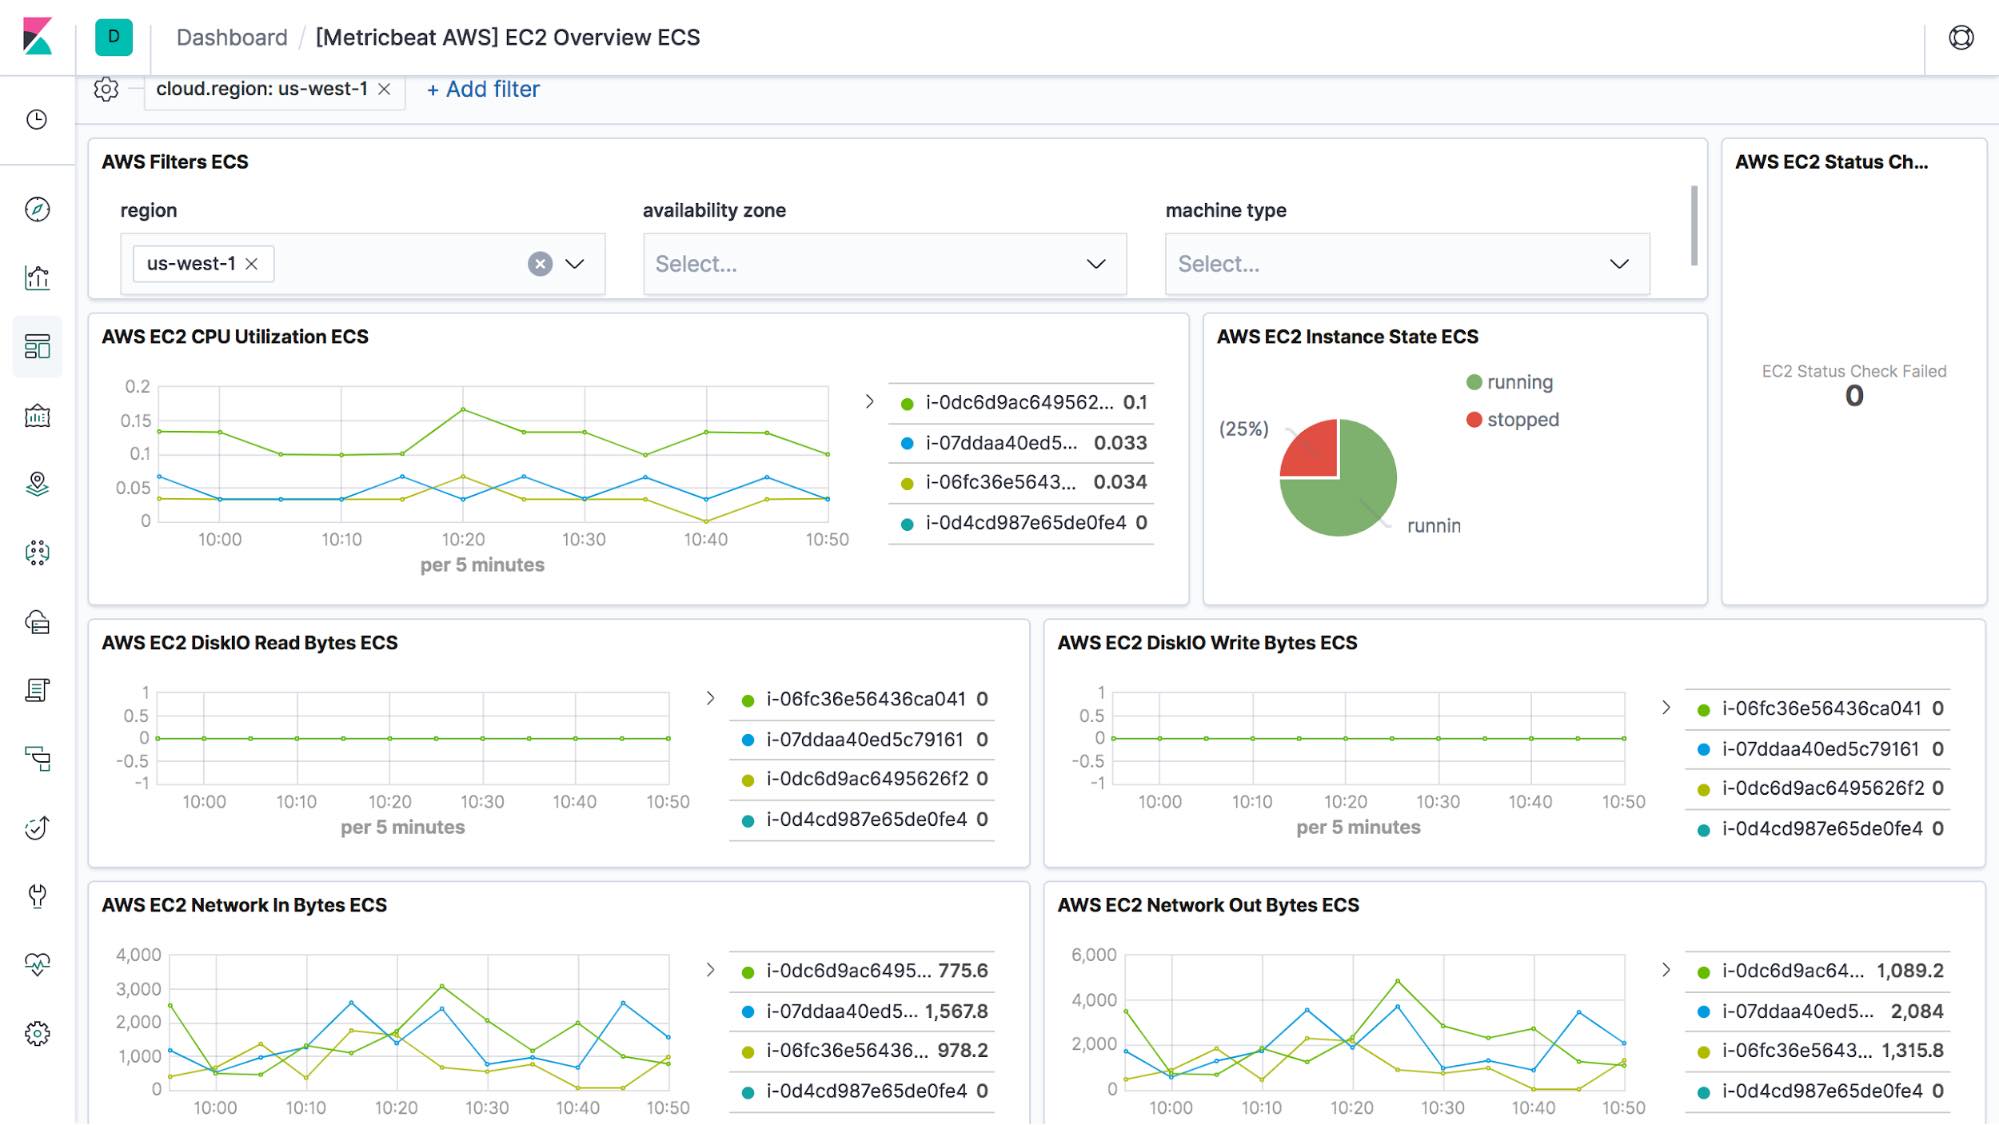
With this dashboard, you can detect issues and make sure every instance is optimized for usage. For example, if you are seeing continuously high CPU utilization and performance issues from the same instance, this possibly indicates that CPU is the bottleneck and this instance needs more CPU power. Also, if you see an instance with low CPU utilization for a long time, this means the instance is oversized on CPU, and possibly can be scaled down or consolidated with another instance.
What’s next
Having a centralized location to visualize monitoring metrics from different AWS services and regions allows you to optimize resources usage, detect and fix issues faster. Give it a try, let us know what you think, give us feedback, and tell us how you are using this in our Beats forum.
The EC2 metricset in the AWS module is just the beginning! We are already hard at work on adding more metric sets to monitor other commonly used services, such as Amazon S3, SQS, RDS, and so on. If you have an opinion on what we should tackle next or want to contribute, please do not hesitate to engage in the Beats Github repository!