Measuring the impact of YouTube chess tutorials on the use of popular openings


 Share on Twitter
Share on Twitter

 Share on LinkedIn
Share on LinkedIn

 Share on Facebook
Share on Facebook

 Share by Email
Share by Email

 Print this page
Print
This is the third blog post in our chess series (don’t forget to check out the first post and second post)! Chess is a fascinating game. What can happen on those 64 squares?
Lichess is a platform that allows you to play chess; it publishes all rated games as archives, starting in 2013. There are a total of over 4 billion games played. Yes, 4 billion matches.
Impact of streamers on chess
GothamChess has nearly 900,000 followers on Twitch and over 3.4 million subscribers on Youtube.* Levy Rozman (GothamChess) is an International Master. He published a video called “The BEST Beginner Chess Opening.” This tutorial about the Ponziani Opening has over 1.2 million views.*
How much impact do those tutorials have on the actual usage of a particular opening? To answer this question, I imported the latest games from March, bringing our total games count to 4.3 billion.
Let’s create a new dashboard and use a Lens visualization. I’ll show you a trick on how to calculate the percentage.
Inside the Lens, add the date histogram for @timestamp and click on the Count of Records, and use the Formula tab. To manually calculate the percentage of games played using the Ponziani opening, use the following snippet:
count(kql='opening.name: *Ponziani*')/count()The formula above counts all games with the Ponziani and divides it by all games played, giving us a percentage.
Another opening tutorial was released on March 12 by Grandmaster Hikaru Nakamura (Twitch: 1.8 million followers, Youtube: 1.87 million subscribers)* on the London System. Inside Lens, we can add a second formula:
count(kql='opening.name: *London*')/count()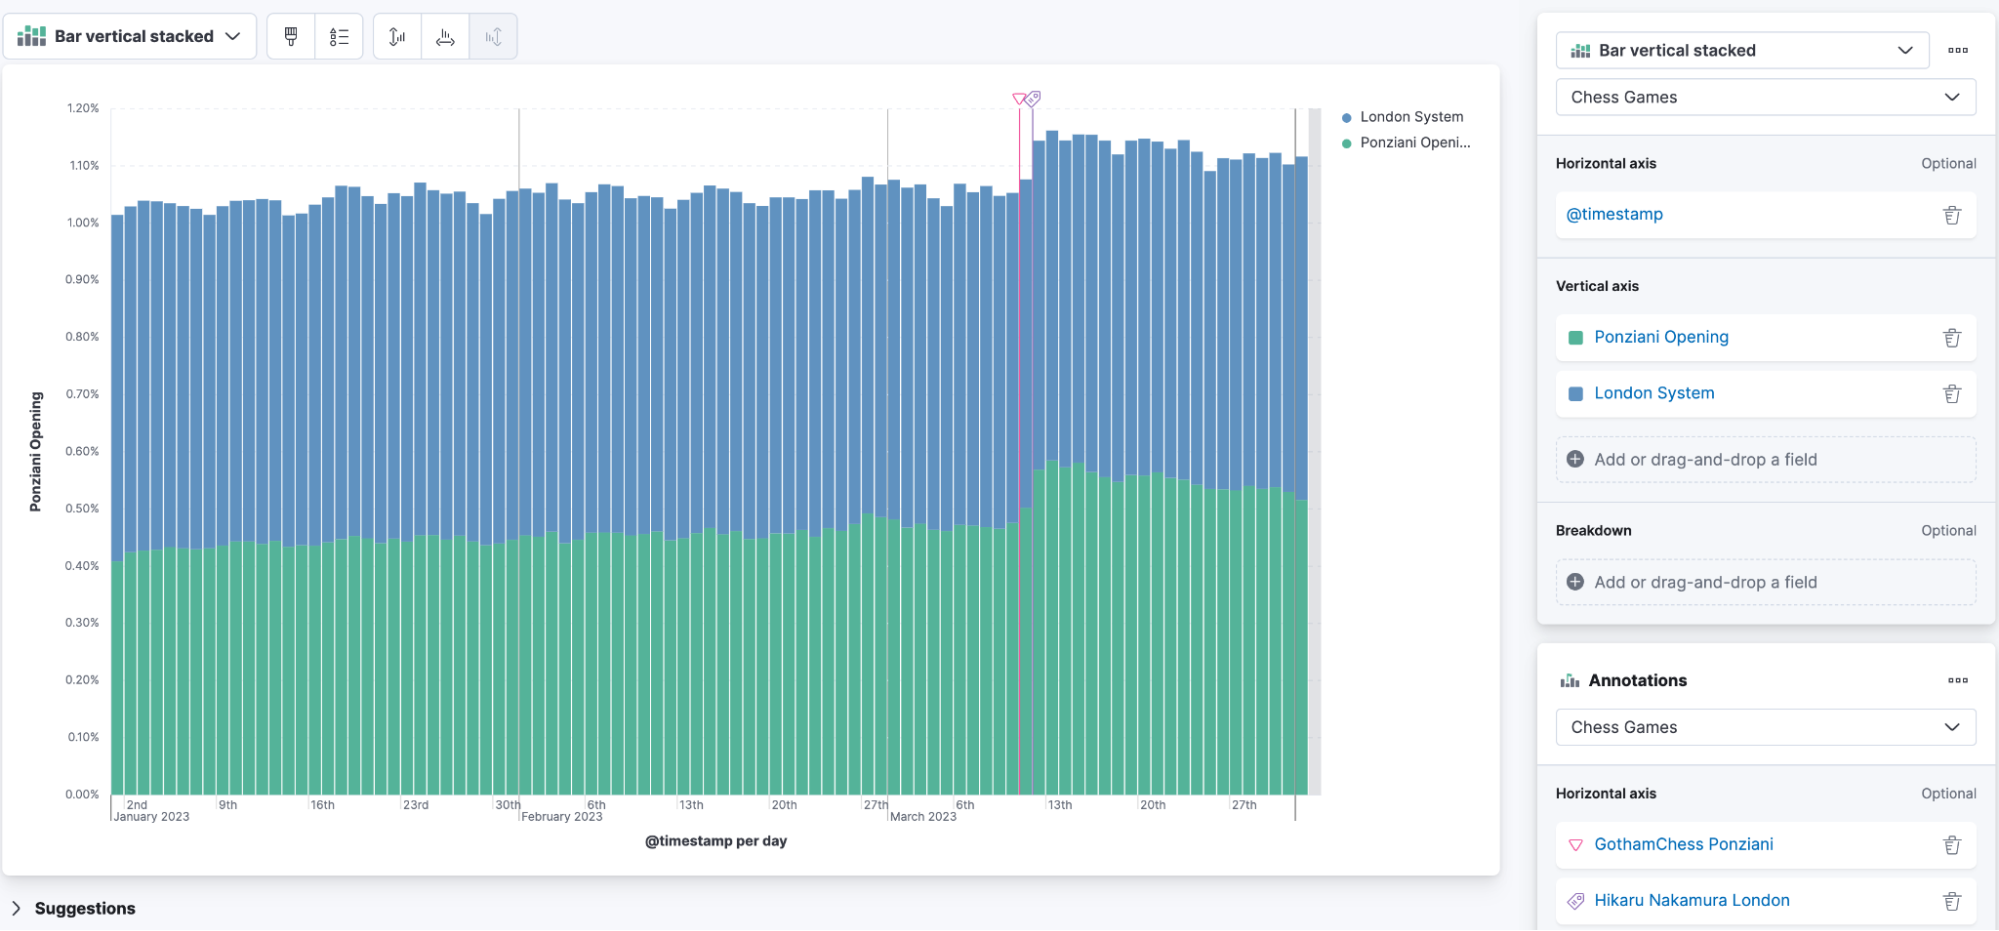
Your Lens should look like the image above. We get a percentage in a stacked bar. The sum of both openings is roughly 1% of all games played. You can see two lines — one in pink, the other in violet. There are two types of annotations in Lens. You can either add manual annotations by selecting the date and giving it a name or use an index with a query that then displays the results as annotations.
Annotations are a way to ensure that whenever you look at the same graph, you know why there is increased activity. Instead of chess data, think about an outage that happened in your infrastructure. You can add an annotation with the ticket id and another annotation when it is resolved. Anyone seeing that graph won’t need to dig into why there is a change in values.
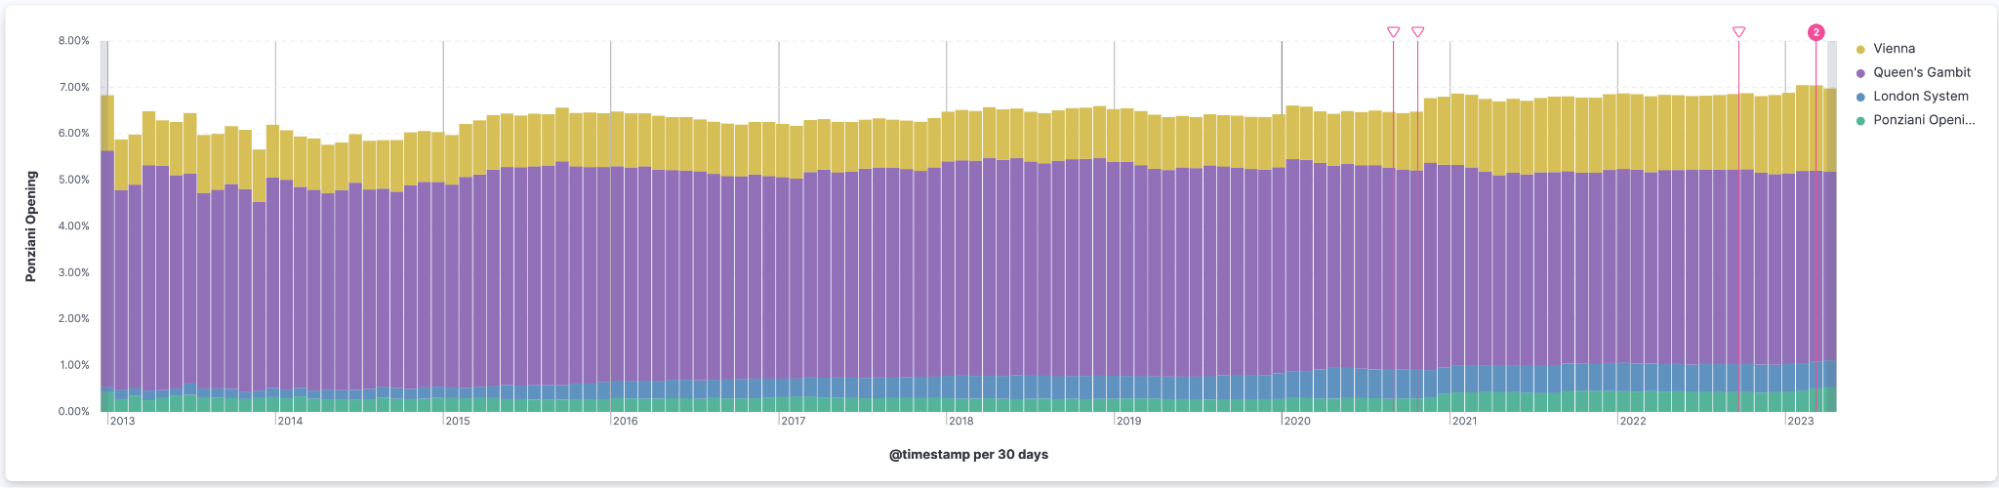
Adding multiple points in time from different GothamChess tutorials, we end up with the following view. The overall trend of all openings on the first look looks like a regular up and down. Queen’s Gambit (violet) has been around forever and is consistently played. One could argue that the Vienna (yellow) has gained more attention since 2021.
How significant is the change in Ponziani openings played? We can use the new Change Point aggregation.
Determining the significance
Significance is often connected to the p-value. P-value explanations are often difficult. The easiest way to explain it is from the perspective of a five-year-old: Imagine you have a sack of candies. The sack has red and blue candies. You are curious and ask yourself, do I have significantly more red candies than blue? You grab a handful of candies and count the blue and red ones. Now you are unsure if what you have counted is the reality or if you are just lucky and grabbed more reds than blues. There comes the magic p-value to the rescue. When your p-value is very small, you can be pretty sure that this is not a coincidence and that your sack of candies has more red than blue ones. If your p-value is big, you must grab another hand of candies and do the calculations again. Lower p-values indicate greater change.
The change point detection allows us to calculate the p-value. This query gets a daily bucket out of the last 100 days and, per day, counts all games played, counts all games played with the Ponziani, and then divides it to get a percentage.
GET chess-summaries*/_search
{
  "size": 0,
  "query": {
    "bool": {
      "filter": [
        {
          "range": {
            "@timestamp": {
              "gte": "now-100d"
            }
          }
        }
      ]
    }
  },
  "aggs": {
    "date": {
      "date_histogram": {
        "field": "@timestamp",
        "fixed_interval": "1d"
      },
      "aggs": {
        "count": {
          "value_count": {
            "field": "opening.name"
          }
        },
        "ponziani": {
          "filter": {
            "bool": {
              "filter": [
                {
                  "wildcard": {
                    "opening.name": {
                      "value": "*Ponziani*"
                    }
                  }
                }
              ]
            }
          }
        },
        "percent": {
          "bucket_script": {
            "buckets_path": {
              "total": "count",
              "ponz": "ponziani>_count"
            },
            "script": "params.ponz/params.total"
          }
        }
      }
    },
    "change_points_count": {
      "change_point": {
        "buckets_path": "date>percent"
      }
    }
  }
}This returns the following:
{
  "aggregations": {
    "date": {
      "buckets":
       [
   {...},
        {
          "key_as_string": "2022-04-04T00:00:00.000Z",
          "key": 1649030400000,
          "doc_count": 1309959,
          "count": {
            "value": 1309959
          },
          "ponziani": {
            "doc_count": 5813
          },
          "percent": {
            "value": 0.004437543465100816
          }
        },
        {...}
      ]
    },
    "change_points_count": {
      "bucket": {
        "key": "2023-03-12T00:00:00.000Z",
        "doc_count": 3540295,
        "count": {
          "value": 3540295
        },
        "ponziani": {
          "doc_count": 20159
        },
        "percent": {
          "value": 0.005694158255173651
        }
      },
      "type": {
        "trend_change": {
          "p_value": 2.6494782968908805e-38,
          "r_value": 2.6494782968908805e-38,
          "change_point": 77
        }
      }
    }
  }
}For easier reading, I left out all possible buckets and focused on interpreting the change_points_count. A significant trend change was detected on the March 12 — a day after GothamChess released the video, which makes sense as he lives in New York City and, therefore, the time zone impacts this. The detected type is a trend_change. Like before, the p-value is associated with a question in our candy example. The change point aggregation asks many questions, like is this a spike, step change, distribution change, and many more. Furthermore, the answer gives the change_point, which is 77. This relates to the 77t bucket of the date_histogram. Then we have the p_value, a tiny number `2.6494782968908805e-38` equals to this: 0.000000000000000000000000000000000000026494782968908805. Statistically, significance is typically mentioned when the p-value is 0.05 or 0.005. Our p-value is much lower than that. Therefore, we can safely assume that the impact GothamChess has is significant.
Running the same query with London instead of Ponziani to analyze the significance of Hikaru Nakamura's video did not detect a significant difference.
Summary
This blog post investigated streamers' and YouTubers’ influence in chess. We showed how one could calculate p-values directly in the Elastic Stack. This lighthearted introduction to p-values showcases how you can use them to detect significant changes and that it does not always need to be for most of your data.
Change point detection is a way to surface things that are difficult or nearly impossible to eyeball from a chart — but this analysis has some caveats. We only checked the impact of a single video from GothamChess. It could be that different chess streamers, such as Alexandra Botez (Twitch: 1.2 million followers, YouTube: 1.27 million subscribers)* played a few Ponzianis on stream. We did not verify if any tournaments were happening where the Ponziani was played. Additionally, we did not analyze the distribution of the rating of Ponziani players. Furthermore, we only verified data on Lichess. Likewise, this analysis only includes rated games, where players can lose/gain ratings. Now I am off to play some Ponziani Openings!
Ready to get started with Elastic? Begin a free 14-day trial of Elastic Cloud. Or download the self-managed version of the Elastic Stack for free.
* All values were retrieved on April 4, 2023, from the respective YouTube channel and Twitch.
Check out the other posts in our chess series:
Share
- Share on Twitter
Share on Twitter
- Share on LinkedIn
Share on LinkedIn
- Share on Facebook
Share on Facebook
- Share by Email
Share by Email
- Print this page
Print