Managing and troubleshooting Elasticsearch memory
.jpg)

 Share on Twitter
Share on Twitter

 Share on LinkedIn
Share on LinkedIn

 Share on Facebook
Share on Facebook

 Share by Email
Share by Email

 Print this page
Print
With Elastic Cloud delivering solutions like Observability, Security, and Search, we've broadened the users who use Elastic Cloud beyond full ops teams to include data engineers, security teams, and consultants. As an Elastic support representative, I’ve enjoyed engaging with a diverse range of users and use cases.
With a wider audience, I’m seeing more questions about managing resource allocation, in particular troubleshooting allocation health and avoiding circuit breakers. I get it! When I started with Elasticsearch, I had the same questions. It was my first intro to managing Java heap and time series database shards and scaling my own infrastructure.
When I joined Elastic, I loved that on top of documentation, we had blogs and tutorials so I could onboard quickly. But then I struggled my first month to correlate my theoretical knowledge to the errors users would send through my ticket queue. Eventually I figured out, like other support reps, that a lot of the reported errors were just symptoms of allocation issues and the same seven-ish links would bring users up to speed to successfully manage their resource allocation.
Speaking as a support rep, I’m going to go over the top allocation management theory links we send users, the top symptoms we see, and where we direct users to update their configurations to resolve their resource allocation issues.
Theory
As a Java application, Elasticsearch requires some logical memory (heap) allocation from the system’s physical memory. This should be up to half of the physical RAM, capping at 32GB. Setting higher heap usage is usually in response to expensive queries and larger data storage. Parent circuit breaker defaults to 95%, but we recommend scaling resources once consistently hitting 85%.
I highly recommend these overview articles for more info:
Configuration
Out of the box, Elasticsearch’s default settings automatically size your JVM heap based on node role and total memory. However, as needed, you can configure it directly in the following three ways:
1. Directly in your config > jvm.options file of your local Elasticsearch files:
## JVM configuration

################################################################
## IMPORTANT: JVM heap size
################################################################

…

# Xms represents the initial size of total heap space
# Xmx represents the maximum size of total heap space

-Xms4g
-Xmx4g2. As an Elasticsearch environment variable in your docker-compose:
version: '2.2'
services:
  es01:
	image: docker.elastic.co/elasticsearch/elasticsearch:7.12.0
	environment:
  	- node.name=es01
  	- cluster.name=es
  	- bootstrap.memory_lock=true
  	- "ES_JAVA_OPTS=-Xms4g -Xmx4g"
  	- discovery.type=single-node
	ulimits:
  	memlock:
    	soft: -1
    	hard: -1
	ports: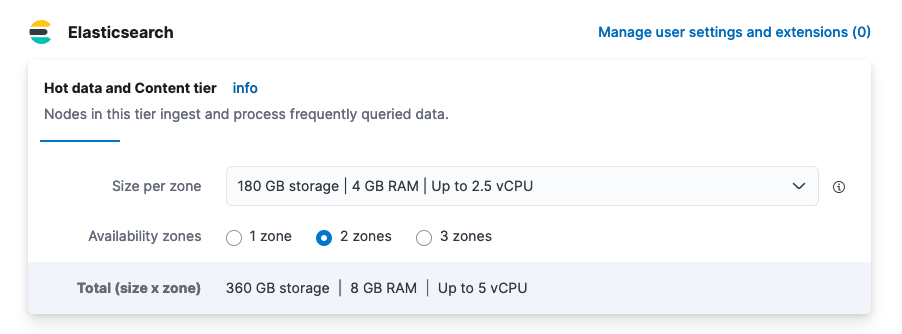
- 9200:92003. Via our Elastic Cloud Hosted > Deployment > Edit view. Note: The drop down assigns physical memory and roughly half will be allotted to the heap.
Troubleshooting
If you’re currently experiencing performance issues with your cluster, it will most likely come down to the usual suspects:
- Configuration issues: Undersized master nodes, no ILM policy
- Volume induced: High request pace/load, overlapping expensive queries/writes
Allocation health
Data indices store into sub-shards, which use heap for maintenance and during search/write requests. Shard size should be no larger than 50GB. Taking the above Elastic Cloud Hosted example with 8GB of physical memory across two zones (which will allocate two nodes in total), let’s join this to an example: _cat/allocation.
GET /_cat/allocation?v=true&h=shards,node
shards node
    41 instance-0000000001
41 instance-0000000000And to: _cluster/health.
GET /_cluster/health?filter_path=status,*_shards

{
  "status": "green",
  "unassigned_shards": 0,
  "initializing_shards": 0,
  "active_primary_shards": 41,
  "relocating_shards": 0,
  "active_shards": 82,
  "delayed_unassigned_shards": 0
}If any shards report >0 outside active_shards or active_primary_shards, you’ve pinpointed a cause for performance issues.
Most commonly if this reports an issue, it will be unassigned_shards>0. If these shards are primary, your cluster will report as status:red, and if only replicas, it will report as status:yellow. (This is why setting replicas on indices is important — if the cluster encounters an issue, it can recover rather than experience data loss.)Let’s pretend we have a status:yellow with a single unassigned shard. To investigate, we’d take a look at which index shard is having trouble via _cat/shards.
GET _cat/shards?v=true&s=state
index                                 	shard prirep state    	docs   store ip       	node
logs                                  	0 	p  	STARTED     	2  10.1kb 10.42.255.40 instance-0000000001
logs                                  	0 	r  	UNASSIGNED
kibana_sample_data_logs               	0 	p  	STARTED 	14074  10.6mb 10.42.255.40 instance-0000000001
.kibana_1 0 p STARTED 2261 3.8mb 10.42.255.40 instance-0000000001So this will be for our non-system index logs, which have an unassigned replica shard. Let’s see what’s giving it grief by running _cluster/allocation/explain. (Pro tip: When you escalate to support, this is exactly what we do.)
GET _cluster/allocation/explain?pretty&filter_path=index,node_allocation_decisions.node_name,node_allocation_decisions.deciders.*
{ "index": "logs",
  "node_allocation_decisions": [{
      "node_name": "instance-0000000005",
      "deciders": [{
          "decider": "data_tier",
          "decision": "NO",
          "explanation": "node does not match any index setting [index.routing.allocation.include._tier] tier filters [data_hot]"
}]}]}This error message points to data_hot, which is part of an index lifecycle management (ILM) policy and indicates that our ILM policy is incongruent with our current index settings. In this case, the cause of this error is from setting up a hot-warm ILM policy without having designated hot-warm nodes. (I needed to guarantee something would fail, so this is me forcing error examples for y’all. For more information, see this example troubleshooting video for resolution walkthrough.)
If you run this command when you don’t have any unassigned shards, you’ll get a 400 error saying unable to find any unassigned shards to explain because nothing’s wrong to report on.If you get a non-logic cause (e.g., a temporary network error like node left cluster during allocation), then you can use Elastic’s handy-dandy _cluster/reroute.
POST /_cluster/rerouteThis request without customizations starts an asynchronous background process that attempts to allocate all current state:UNASSIGNED shards. (Don’t be like me and not wait for it to finish before you contact dev, because I thought it would be instantaneous and coincidentally escalate just in time for them to say nothing’s wrong because nothing was anymore.) For more information, see this troubleshooting video for monitoring Allocation Health.
Circuit breakers
Maxing out your heap allocation can cause requests to your cluster to time out or error and frequently will cause your cluster to experience circuit breaker exceptions. Circuit breaking errors causes elasticsearch.log events like:
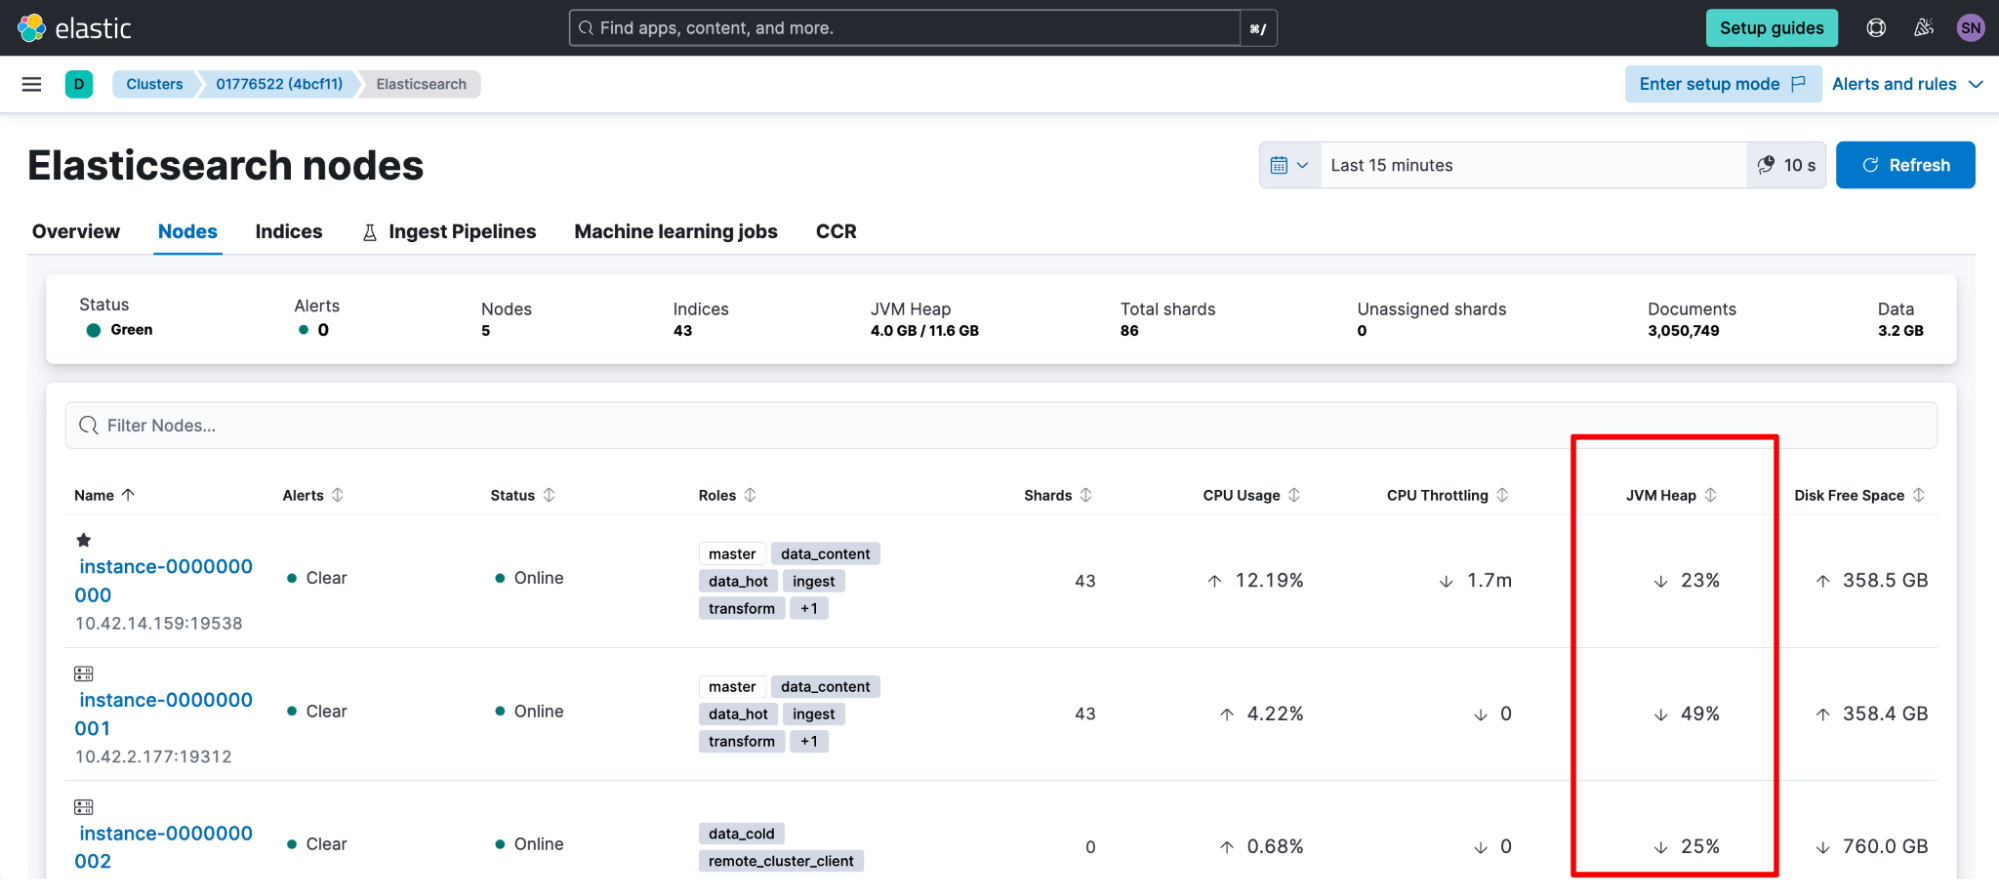
Caused by: org.elasticsearch.common.breaker.CircuitBreakingException: [parent] Data too large, data for [<transport_request>] would be [num/numGB], which is larger than the limit of [num/numGB], usages [request=0/0b, fielddata=num/numKB, in_flight_requests=num/numGB, accounting=num/numGB]To investigate, take a look at your heap.percent, either by looking at _cat/nodes:
GET /_cat/nodes?v=true&h=name,node*,heap*
# heap = JVM (logical memory reserved for heap)
# ram  = physical memory

name                                node.role heap.current heap.percent heap.max
tiebreaker-0000000002 mv             119.8mb           23    508mb
instance-0000000001   himrst           1.8gb           48    3.9gb
instance-0000000000 himrst 2.8gb 73 3.9gbOr if you’ve previously enabled it, navigate to Kibana > Stack Monitoring.
If you've confirmed you're hitting your memory circuit breakers, you'll want to consider increasing heap temporarily to give yourself breathing room to investigate. When investigating root cause, look through your audit logging, slow logging, clusterlogs, or elasticsearch.log for the preceding consecutive events. You'll be looking for:
- Expensive queries, especially:
- High bucket aggregations
- I felt so silly when I found out that searches temporarily allocate a certain portion of your heap before they run the query based on the search size or bucket dimensions, so setting 10,000,000 really was giving my ops team heartburn.
- non-optimized mappings
- The second reason to feel silly was when I thought doing hierarchical reporting would search better than flattened out data (it does not).
- High bucket aggregations
- Request volume/pace: Usually batch or async queries
Time to scale
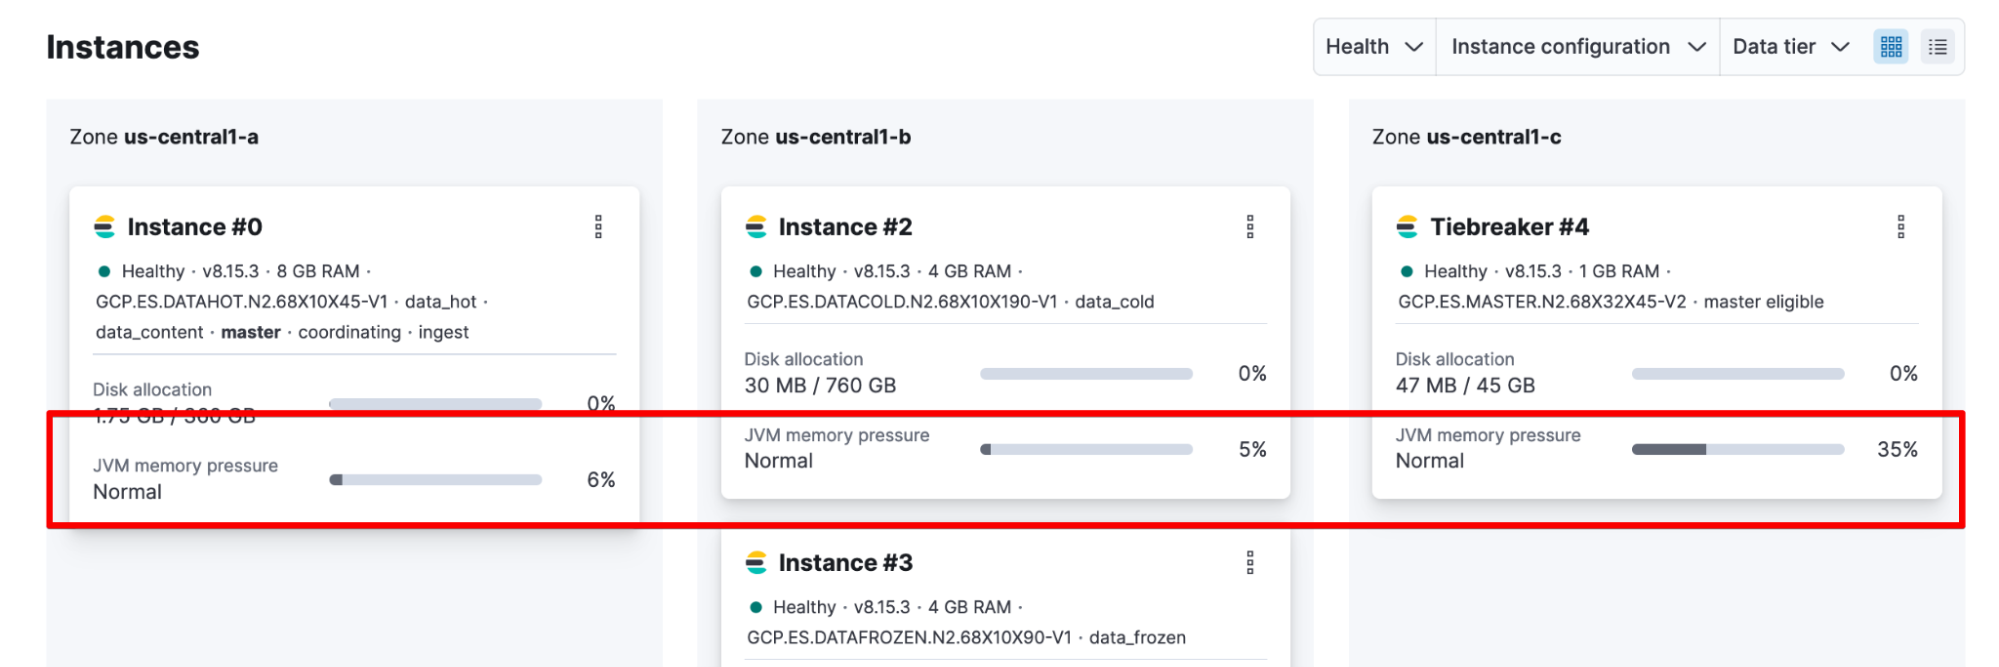
If this isn’t your first time hitting circuit breakers or you suspect it’ll be an ongoing issue (e.g., consistently hitting 85%, so it’s time to look at scaling resources), you’ll want to take a closer look at the JVM Memory Pressure as your long-term heap indicator. You can check this in Elastic Cloud Hosted > Deployment.
Or you can calculate it from _nodes/stats:
GET /_nodes/stats?filter_path=nodes.*.jvm.mem.pools.old

{"nodes": { "node_id": { "jvm": { "mem": { "pools": { "old": {
  "max_in_bytes": 532676608,
  "peak_max_in_bytes": 532676608,
  "peak_used_in_bytes": 104465408,
  "used_in_bytes": 104465408
}}}}}}}Where:
JVM Memory Pressure = used_in_bytes / max_in_bytesA potential symptom of this is high frequency and long duration from garbage collector (gc) events in your elasticsearch.log:
[timestamp_short_interval_from_last][INFO ][o.e.m.j.JvmGcMonitorService] [node_id] [gc][number] overhead, spent [21s] collecting in the last [40s]If you confirm this scenario, you’ll need to take a look either at scaling your cluster or at reducing the demands hitting it. You’ll want to investigate/consider:
- Increasing heap resources (heap/node; number of nodes)
- Decreasing shards (delete unnecessary/old data; use ILM to put data into warm/cold storage so you can shrink it; turn off replicas for data you don’t care if you lose)
We're here to help
Wooh! From what I see in Elastic support, that’s the rundown of most common user tickets: unassigned shards, unbalanced shard-heap, circuit breakers, high garbage collection, and allocation errors. All are symptoms of the core resource allocation management conversation. Hopefully, you now know the theory and resolution steps, too.
At this point, though, if you’re stuck resolving an issue, feel free to reach out. We’re here and happy to help! Contact us:
Cheers to our ability to self-manage the Elastic Stack’s resource allocation as non-Ops (love Ops, too)!
Additional resources:
Originally published April 27, 2021; updated November 5, 2024.
The release and timing of any features or functionality described in this post remain at Elastic's sole discretion. Any features or functionality not currently available may not be delivered on time or at all.
Share
- Share on Twitter
Share on Twitter
- Share on LinkedIn
Share on LinkedIn
- Share on Facebook
Share on Facebook
- Share by Email
Share by Email
- Print this page
Print