Improving the GoDaddy User Experience with Elastic Machine Learning
This post is a recap of a community talk given at Elastic{ON} 2018. Interested in seeing more talks like this? Check out the conference archive or find out when the Elastic{ON} Tour is coming to a city near you.
GoDaddy is known for web hosting and domain management, as anyone that’s watched the Super Bowl in recent years would know. But with over 17 million customers, 75 million domains, and 10 million hosted sites, they’re also well versed in big data. Keeping sites running smoothly requires insight into every piece of their infrastructure, from virtual server patch level to network hiccups to malicious attacks. This could be difficult with over 200,000 messages coming in every second (DNS queries, system logs, business events, and more), but with its speed at scale, the Elastic Stack is up to the task.
GoDaddy’s introduction to Elasticsearch was a lot like other companies that use open source software. Disparate teams throughout the company set up their own clusters to handle their own specific needs. It got the job done, but this unmanaged deployment model led to hundreds of clusters running on varying versions of Elasticsearch analyzing siloed data. Knowing there was a better way, they formed a team around managing the deployment of Elasticsearch in 2014. This team now manages over 60 Elasticsearch clusters spanning 700+ Docker containers, with feeds coming in from teams all over the company. These clusters account for over 270 TB of data from their (11 PB) HDFS environment.
One of the first use cases their new Elasticsearch team tackled was managing patch compliance throughout their entire ecosystem. In the pre-Beats world of 2014, GoDaddy developed Windows and Linux agents (similar to Auditbeat and Winlogbeat) to send system data to Elasticsearch. With these agents installed on all of their servers (bare metal and virtual), GoDaddy was able to gain valuable insight into patching levels and compliance throughout their entire infrastructure. And by utilizing different dashboards and visualizations within Kibana, they were able to easily provide fine-grain patch information to admins and engineers, as well as high-level business reports to executives — all while accessing the same centralized data so everyone is on the same page.
Maintaining server patch levels is important for keeping site traffic flowing, and that flow helps keep users engaged. If a website is loading slowly, visitors will go somewhere else. So, with the experience of their millions of customers in mind, GoDaddy knew they needed to track how well data centers were performing and how their performance impacted visitors. They already had all of the data they needed, as every component of their systems generated logs, but they needed a way to view it holistically.
Centralized Logging with Machine Learning for Anomaly Detection
GoDaddy needed to centralize and analyze their various performance and engagement data sets, and the Elastic Stack was the answer. By sending netflow data, sFlow data, real user management (RUM), and peering relationship and routing data to Elasticsearch, they were able to get a much more detailed view of user experience and system performance data — a level of detail that can only be seen by analyzing all of the different data sources at once. And since then, GoDaddy has begun to take that data even further with the help of Elastic machine learning features.
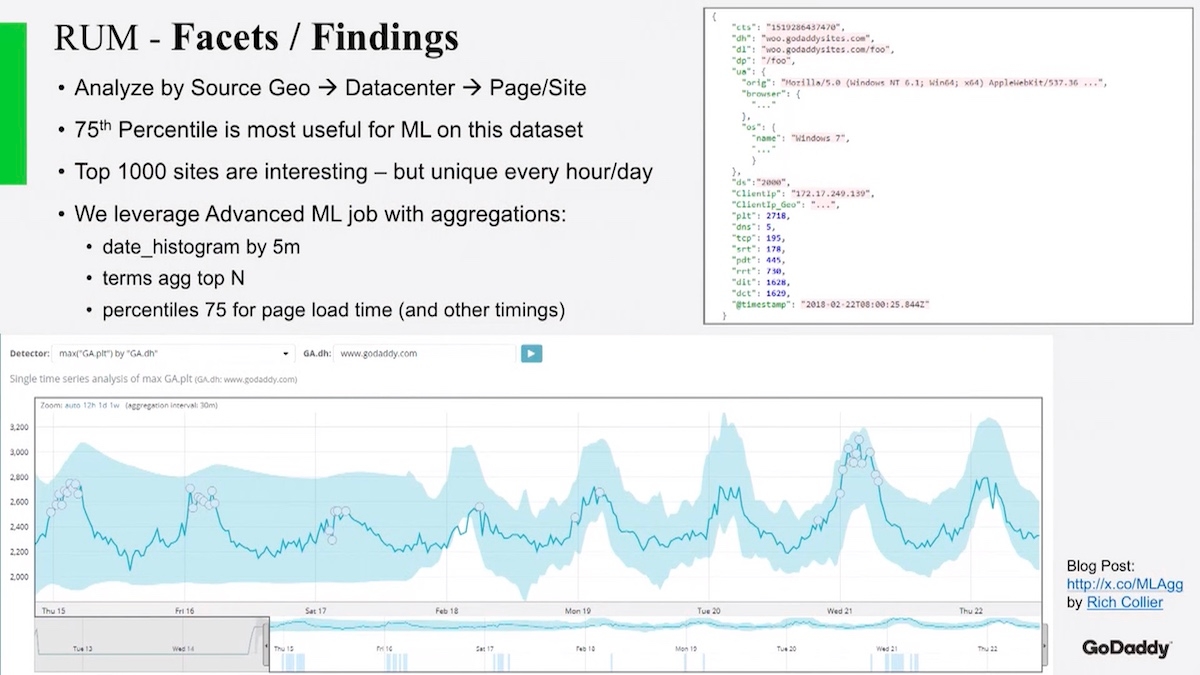
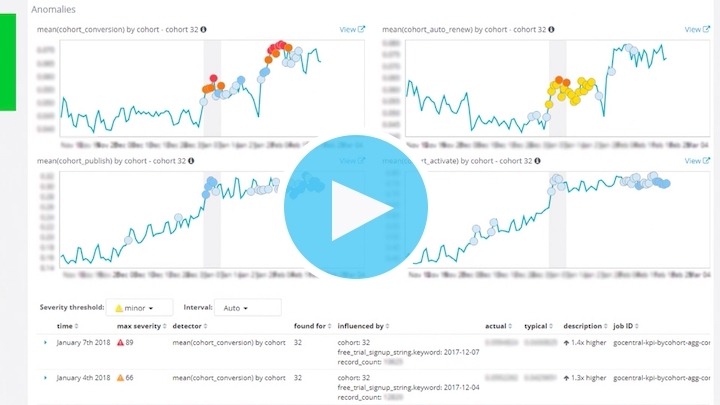
Having centralized access to mountains of system data is great, but tracking down problems can be difficult. GoDaddy tracks every user click and website interaction, but with millions of pages operating around the world, there’s no way any team of humans could sift through all that data. Fortunately, Elastic machine learning features make anomaly detection a simple task. Working with machine learning experts at Elastic, GoDaddy has been able to implement RUM-focused machine learning jobs that have made anomaly detection easy.
“In terms of the overall effort, leverage your Elastic team. They are extremely helpful. We've had a very close partnership and very frequent calls, a completely open line of communication around all the updates, you will get stuck, use them for that. That's really what they're good at.” - Felix Gorodishter, Principal Architect, GoDaddy
By specifying a threshold for page load times and parameters around page traffic, the GoDaddy team lets Elastic machine learning features handle the job of learning what’s normal and what’s anomalous, and then letting them know whenever there’s a problem. Machine learning cuts through the noise so GoDaddy can focus on what’s important.
Learn about how GoDaddy is leveraging Elastic machine learning features to monitor hosted site performance by watching Stories from the Trenches at GoDaddy: How Big Data Insights Equal Big Money from Elastic{ON} 2018. You’ll also get a peek into the interesting ways they’re using machine learning to monitor business KPIs around product adoptions and hear about the lessons they’ve learned along the way.