How to monitor containerized Kafka with Elastic Observability
Kafka is a distributed, highly available event streaming platform which can be run on bare metal, virtualized, containerized, or as a managed service. At its heart, Kafka is a publish/subscribe (or pub/sub) system, which provides a "broker" to dole out events. Publishers post events to topics, and consumers subscribe to topics. When a new event is sent to a topic, consumers that subscribe to the topic will receive a new event notification. This allows multiple clients to be notified of activity without the publisher needing to know who or what is consuming the events that it publishes. For example, when a new order comes in, a web store may publish an event with order details, which could be picked up by consumers in the order picking department to let them know what to pull from the shelves, and by consumers in the shipping department to print a label, or any other interested party to take action. Depending on how you configure consumer groups and partitions, you can control which consumers get new messages.
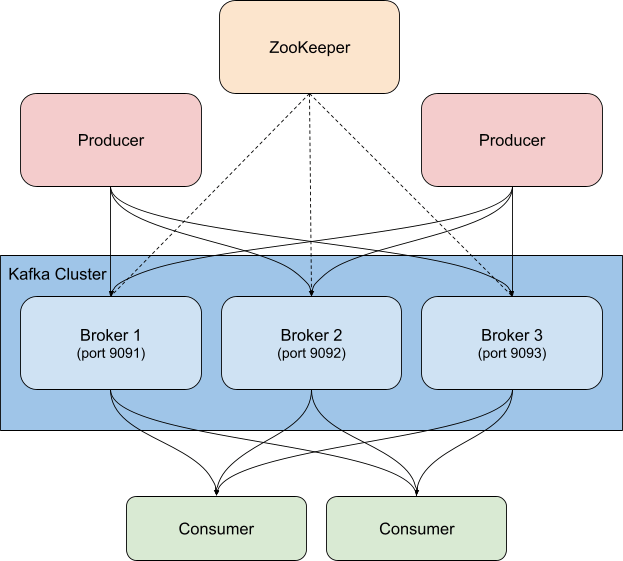
Kafka is usually deployed alongside ZooKeeper, which it uses to store configuration information such as topics, partitions, and replica/redundancy information. When monitoring Kafka clusters it is equally important to monitor the associated ZooKeeper instances as well— if ZooKeeper has issues they will propagate to the Kafka cluster.
There are many ways to use Kafka alongside the Elastic Stack. You can configure Metricbeat or Filebeat to send data to Kafka topics, you can send data from Kafka to Logstash or from Logstash to Kafka, or, you can use Elastic Observability to monitor Kafka and ZooKeeper, so you can keep a close eye on your cluster, which is what this blog will cover. Remember the "order detail" events mentioned above? Logstash, using the Kafka input plugin, can also subscribe to those events and bring data into your Elasticsearch cluster. By adding business (or any other data that you need to truly understand what is happening in your environment) you increase the observability of your systems.
Things to look for when monitoring Kafka
Kafka has several moving parts — there is the service itself, which usually consists of multiple brokers and ZooKeeper instances, as well as the clients that use Kafka, the producers and consumers. There are multiple types of metrics that Kafka provides, some via the brokers themselves, and others via JMX. The broker provides metrics for the partitions and consumer groups. Partitions let you split messages across multiple brokers, parallelizing the processing. Consumers receive messages from a single topic partition, and can be grouped together to consume all of the messages from a topic. These consumer groups allow you to split the load across multiple workers.
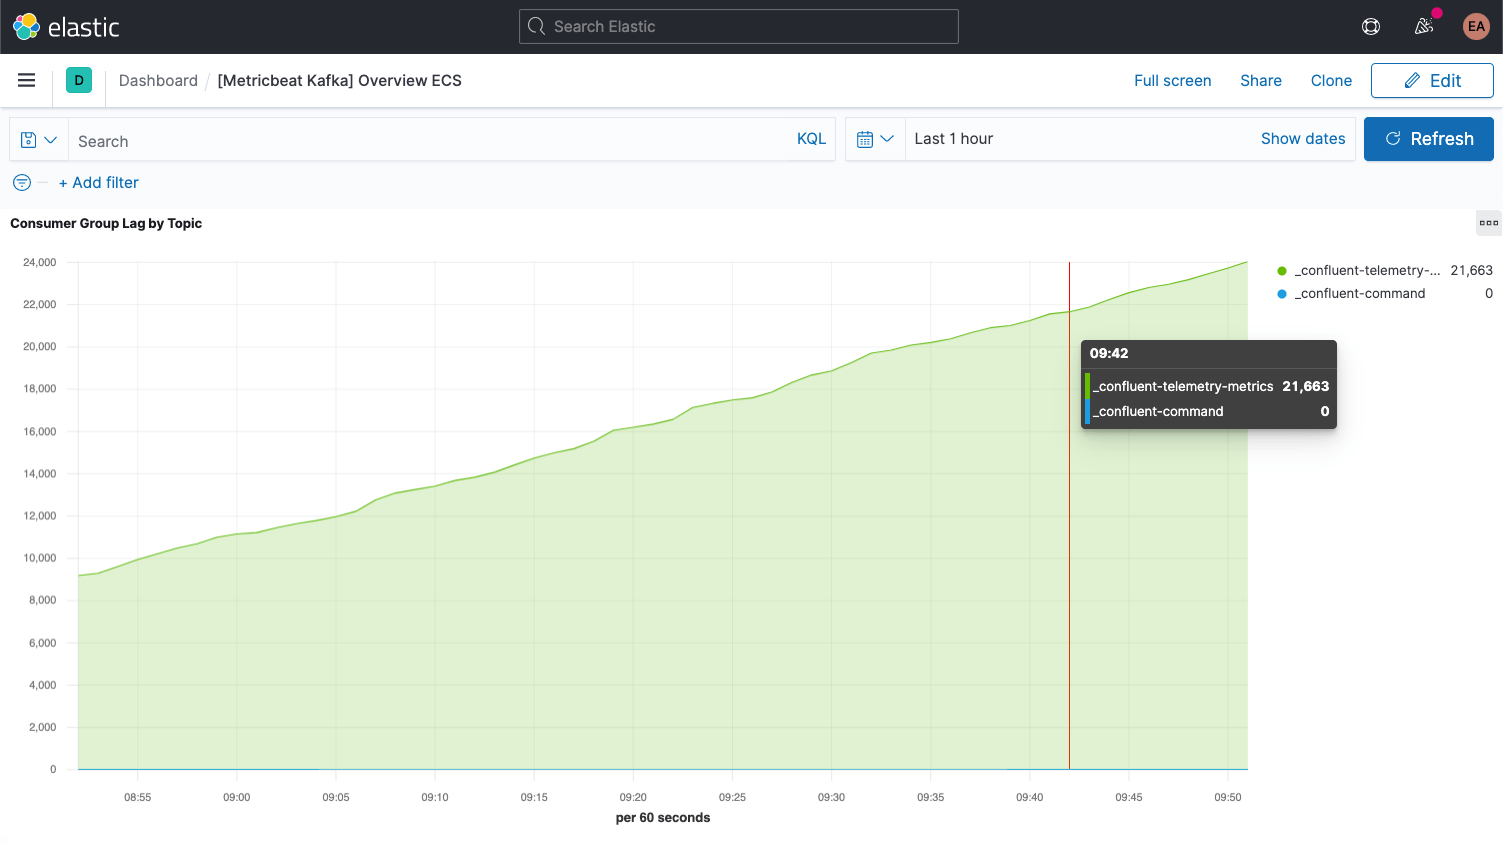
Kafka messages each have an offset. The offset is basically an identifier indicating where the message is in the message sequence. Producers add messages to the topics, each getting a new offset. The newest offset in a partition shows the latest ID. Consumers receive the messages from the topics, and the difference between the newest offset and the offset the consumer receives is the consumer lag. Invariably, the consumers will be a bit behind the producers. What to look out for is when the consumer lag is perpetually increasing, as this indicates that you probably need more consumers to process the load.
When looking at metrics for the topics themselves it is important to look for any topics that don't have any consumers, as it might indicate that something that should be running isn't.
We'll go over some additional key metrics for the brokers once we've got everything all set up.
Setting up Kafka and Zookeeper
In our example we're running a containerized Kafka cluster based on the Confluent Platform, ramped up to three Kafka brokers (cp-server images), alongside a single ZooKeeper instance. In practice you'd probably also want to use a more robust, highly-available configuration for ZooKeeper as well.
I've cloned their setup and switched to the cp-all-in-one directory:
git clone https://github.com/confluentinc/cp-all-in-one.git
cd cp-all-in-one
Everything else in this blog is done from that cp-all-in-one directory.
In my setup I've tweaked the ports to make it easier to tell which port goes with which broker (they need different ports because each is exposed to the host) — for example, broker3 is on port 9093. I've also changed the name of the first broker to broker1 for consistency. You can see the complete file, before instrumentation, in my GitHub fork of the official repository.
The configuration for broker1 after the port realignment looks like this:
broker1:
  image: confluentinc/cp-server:6.1.0
  hostname: broker1
  container_name: broker1
  depends_on:
    - zookeeper
  ports:
    - "9091:9091"
    - "9101:9101"
  environment:
    KAFKA_BROKER_ID: 1
    KAFKA_ZOOKEEPER_CONNECT: 'zookeeper:2181'
    KAFKA_LISTENER_SECURITY_PROTOCOL_MAP: PLAINTEXT:PLAINTEXT,PLAINTEXT_HOST:PLAINTEXT
    KAFKA_ADVERTISED_LISTENERS: PLAINTEXT://broker1:29092,PLAINTEXT_HOST://broker1:9091
    KAFKA_METRIC_REPORTERS: io.confluent.metrics.reporter.ConfluentMetricsReporter
    KAFKA_OFFSETS_TOPIC_REPLICATION_FACTOR: 1
    KAFKA_GROUP_INITIAL_REBALANCE_DELAY_MS: 0
    KAFKA_CONFLUENT_LICENSE_TOPIC_REPLICATION_FACTOR: 1
    KAFKA_CONFLUENT_BALANCER_TOPIC_REPLICATION_FACTOR: 1
    KAFKA_TRANSACTION_STATE_LOG_MIN_ISR: 1
    KAFKA_TRANSACTION_STATE_LOG_REPLICATION_FACTOR: 1
    KAFKA_JMX_PORT: 9101
    KAFKA_JMX_HOSTNAME: localhost
    KAFKA_CONFLUENT_SCHEMA_REGISTRY_URL: http://schema-registry:8081
    CONFLUENT_METRICS_REPORTER_BOOTSTRAP_SERVERS: broker1:29092
    CONFLUENT_METRICS_REPORTER_TOPIC_REPLICAS: 1
    CONFLUENT_METRICS_ENABLE: 'true'
    CONFLUENT_SUPPORT_CUSTOMER_ID: 'anonymous'
As you can see, I've also changed the hostname occurrences from broker to broker1. Of course, any other configuration blocks in the docker-compose.yml that reference broker will also get changed to reflect all three nodes of our cluster, for example, and the Confluent control center now depends on all three brokers:
  control-center:
    image: confluentinc/cp-enterprise-control-center:6.1.0
    hostname: control-center
    container_name: control-center
    depends_on:
      - broker1
      - broker2
      - broker3
      - schema-registry
      - connect
      - ksqldb-server
(...)
Gathering logs & metrics
My Kafka and ZooKeeper services are running in containers, initially with three brokers. If I scale that up or down, or decide to make the ZooKeeper side more robust, I don't want to have to reconfigure and restart my monitoring — I want it to happen dynamically. To accomplish this we'll run the monitoring in Docker containers as well, alongside the Kafka cluster, and leverage Elastic Beats hints-based autodiscover.
Hints-based autodiscover
For monitoring, we'll be gathering logs and metrics from our Kafka brokers and the ZooKeeper instance. We'll use Metricbeat for the metrics, and Filebeat for the logs, both running in containers. To bootstrap this process, we need to download the Docker-flavor configuration files for each, metricbeat.docker.yml and filebeat.docker.yml. I will be sending this monitoring data to my Elastic Observability deployment on the Elasticsearch Service on Elastic Cloud (if you'd like to follow along you can sign up for a free trial). If you'd prefer to manage your cluster yourself you can download the Elastic Stack for free and run it locally — I've included instructions for both scenarios.
Whether you're using a deployment on Elastic Cloud or running a self-managed cluster you'll need to specify how to find the cluster — the Kibana and Elasticsearch URLs, and credentials that allow you to log on to the cluster. The Kibana endpoint lets us load default dashboards and configuration information, and Elasticsearch is where the Beats send the data. With Elastic Cloud, the Cloud ID wraps the endpoint information together:
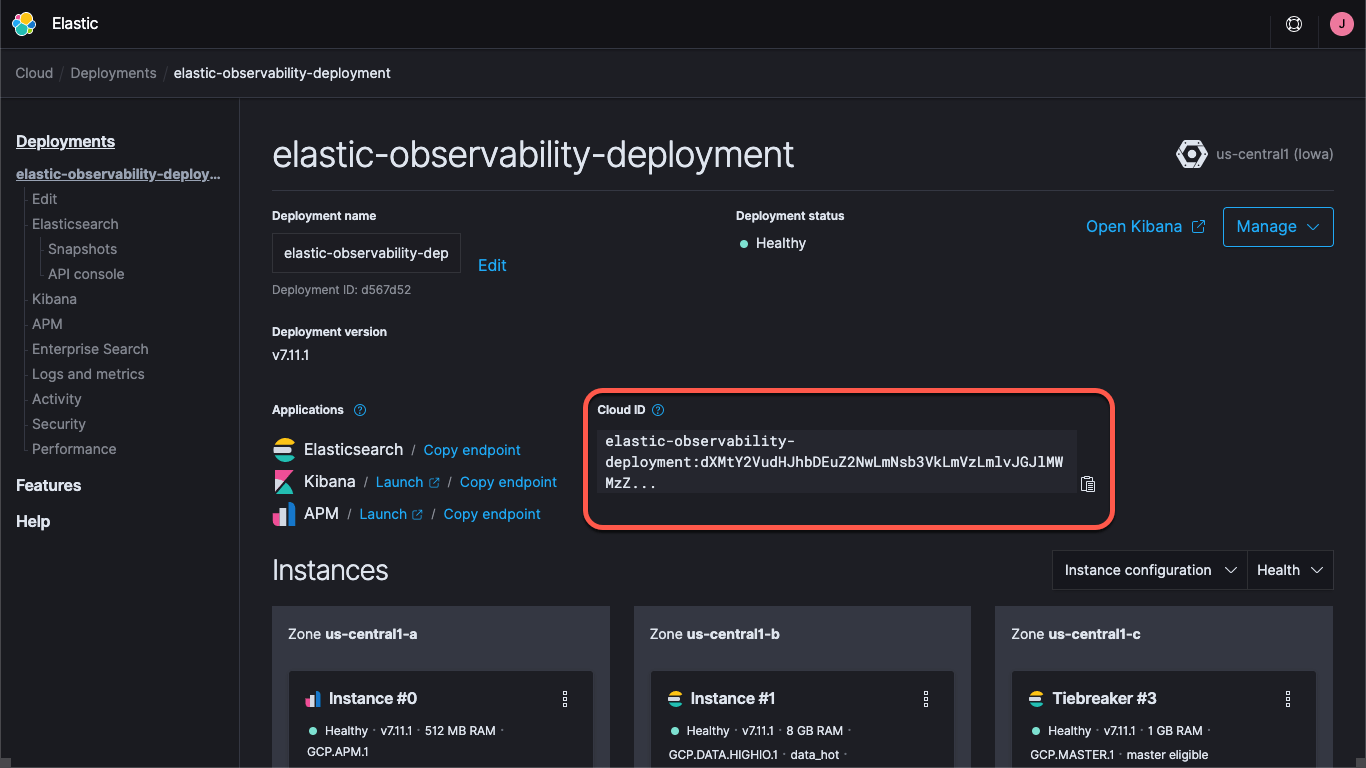
When you create a deployment on Elastic Cloud you are provided a password for the elastic user. In this blog I'll just use these credentials for simplicity, but best practice is to create API keys or users and roles with the least privileges needed for the task.
Let's go ahead and load the default dashboards for both Metricbeat and Filebeat. This only needs to be done once, and is similar for each Beat. To load the Metricbeat collateral, run:
docker run --rm \
    --name=metricbeat-setup \
    --volume="$(pwd)/metricbeat.docker.yml:/usr/share/metricbeat/metricbeat.yml:ro" \
    docker.elastic.co/beats/metricbeat:7.11.1 \
    -E cloud.id=elastic-observability-deployment:dXMtY2VudHJhbDEuZ2NwLmNsb3VkLmV... \
    -E cloud.auth=elastic:some-long-random-password \
    -e -strict.perms=false \
    setup
This command will create a Metricbeat container (called metricbeat-setup), load up the metricbeat.docker.yml file we downloaded, connect to the Kibana instance (which it gets from the cloud.id field), and run the setup command, which will load the dashboards. If you're not using Elastic Cloud, you'd instead provide the Kibana and Elasticsearch URLs via setup.kibana.host and output.elasticsearch.hosts fields, along with individual credential fields, which would look something like this:
docker run --rm \
    --name=metricbeat-setup \
    --volume="$(pwd)/metricbeat.docker.yml:/usr/share/metricbeat/metricbeat.yml:ro" \
    docker.elastic.co/beats/metricbeat:7.11.1 \
    -E setup.kibana.host=localhost:5601 \
    -E setup.kibana.username=elastic \
    -E setup.kibana.password=your-password \
    -E output.elasticsearch.hosts=localhost:9200 \
    -E output.elasticsearch.username=elastic \
    -E output.elasticsearch.password=your-password \
    -e -strict.perms=false \
    setup
The -e -strict.perms=false helps mitigate an inevitable Docker file ownership/permission issue.
Similarly, to set up the logs collateral, you'd run a similar command for Filebeat:
docker run --rm \
    --name=filebeat-setup \
    --volume="$(pwd)/filebeat.docker.yml:/usr/share/filebeat/filebeat.yml:ro" \
    docker.elastic.co/beats/filebeat:7.11.1 \
    -E cloud.id=elastic-observability-deployment:dXMtY2VudHJhbDEuZ2NwLmNsb3VkLmV... \
    -E cloud.auth=elastic:some-long-random-password \
    -e -strict.perms=false \
    setup
By default, these configuration files are set up to monitor generic containers, gathering container logs and metrics. This is helpful to some extent, but we want to make sure that they also capture service-specific logs and metrics. To do this, we'll be configuring our Metricbeat and Filebeat containers to use autodiscover, as mentioned above. There are a couple of different ways to do this. We could set up the Beats configurations to look for specific images or names, but that requires knowing a lot up front. Instead, we'll use hints-based autodiscovery, and let the containers themselves instruct the Beats how to monitor them.
With hints-based autodiscover, we add labels to the Docker containers. When other containers start up, the metricbeat and filebeat containers (which we haven't started yet) get a notification which allows them to start monitoring. We want to set up the broker containers so they get monitored by the Kafka Metricbeat and Filebeat modules, and we also want Metricbeat to use the ZooKeeper module for metrics. Filebeat will collect the ZooKeeper logs without any special parsing.
The ZooKeeper configuration is more straightforward than Kafka, so we'll start there. The initial configuration in our docker-compose.yml for ZooKeeper looks like this:
  zookeeper:
    image: confluentinc/cp-zookeeper:6.1.0
    hostname: zookeeper
    container_name: zookeeper
    ports:
      - "2181:2181"
    environment:
      ZOOKEEPER_CLIENT_PORT: 2181
      ZOOKEEPER_TICK_TIME: 2000
We want to add a labels block to the YAML to specify the module, the connection information, and the metricsets, which looks like this:
    labels:
      - co.elastic.metrics/module=zookeeper
      - co.elastic.metrics/hosts=zookeeper:2181
      - co.elastic.metrics/metricsets=mntr,server
These tell the metricbeat container that it should use the zookeeper module to monitor this container, and that it can access it via the host/port zookeeper:2181, which is the port ZooKeeper is configured to listen on. It also tells it to use the mntr and server metricsets from the ZooKeeper module. As a side note, recent versions of ZooKeeper lock down some of what they call "four letter words", so we also need to add the srvr and mntr commands to the approved list in our deployment via KAFKA_OPTS. Once we do that, the ZooKeeper configuration in the compose file looks like this:
  zookeeper:
    image: confluentinc/cp-zookeeper:6.1.0
    hostname: zookeeper
    container_name: zookeeper
    ports:
      - "2181:2181"
    environment:
      ZOOKEEPER_CLIENT_PORT: 2181
      ZOOKEEPER_TICK_TIME: 2000
      KAFKA_OPTS: "-Dzookeeper.4lw.commands.whitelist=srvr,mntr"
    labels:
      - co.elastic.metrics/module=zookeeper
      - co.elastic.metrics/hosts=zookeeper:2181
      - co.elastic.metrics/metricsets=mntr,server
Capturing logs from the brokers is pretty straightforward; we just add a label to each of them for the logging module, co.elastic.logs/module=kafka. For the broker metrics it's a little more complicated. There are five different metricsets in the Metricbeat Kafka module:
- Consumer Group metrics
- Partition metrics
- Broker metrics
- Consumer metrics
- Producer metrics
The first two sets of metrics come from the brokers themselves, while the last three come via JMX. The last two, consumer and producer, are only applicable to Java-based consumers and producers (the clients to the Kafka cluster) respectively, so we won't be covering those (but they follow the same patterns that we'll be going over). Let's tackle the first two first, because they're configured the same way. The initial Kafka configuration in our compose file for broker1 looks like this:
  broker1:
    image: confluentinc/cp-server:6.1.0
    hostname: broker1
    container_name: broker1
    depends_on:
      - zookeeper
    ports:
      - "9091:9091"
      - "9101:9101"
    environment:
      KAFKA_BROKER_ID: 1
      KAFKA_ZOOKEEPER_CONNECT: 'zookeeper:2181'
      KAFKA_LISTENER_SECURITY_PROTOCOL_MAP: PLAINTEXT:PLAINTEXT,PLAINTEXT_HOST:PLAINTEXT
      KAFKA_ADVERTISED_LISTENERS: PLAINTEXT://broker1:29091,PLAINTEXT_HOST://broker1:9091
      KAFKA_METRIC_REPORTERS: io.confluent.metrics.reporter.ConfluentMetricsReporter
      KAFKA_OFFSETS_TOPIC_REPLICATION_FACTOR: 1
      KAFKA_GROUP_INITIAL_REBALANCE_DELAY_MS: 0
      KAFKA_CONFLUENT_LICENSE_TOPIC_REPLICATION_FACTOR: 1
      KAFKA_CONFLUENT_BALANCER_TOPIC_REPLICATION_FACTOR: 1
      KAFKA_TRANSACTION_STATE_LOG_MIN_ISR: 1
      KAFKA_TRANSACTION_STATE_LOG_REPLICATION_FACTOR: 1
      KAFKA_JMX_PORT: 9101
      KAFKA_JMX_HOSTNAME: broker1
      KAFKA_CONFLUENT_SCHEMA_REGISTRY_URL: http://schema-registry:8081
      CONFLUENT_METRICS_REPORTER_BOOTSTRAP_SERVERS: broker1:29091
      CONFLUENT_METRICS_REPORTER_TOPIC_REPLICAS: 1
      CONFLUENT_METRICS_ENABLE: 'true'
      CONFLUENT_SUPPORT_CUSTOMER_ID: 'anonymous'
Similar to the configuration for ZooKeeper, we need to add labels to tell Metricbeat how to gather the Kafka metrics:
    labels:
      - co.elastic.logs/module=kafka
      - co.elastic.metrics/module=kafka
      - co.elastic.metrics/metricsets=partition,consumergroup
      - co.elastic.metrics/hosts='$${data.container.name}:9091'
This sets up the Metricbeat and Filebeat kafka modules to gather Kafka logs and the partition and consumergroup metrics from the container, broker1 on port 9091. Note that I've used a variable, data.container.name (escaped with a double dollar sign) rather than the hostname — you can use whichever pattern you prefer. We need to repeat this for each broker, adjusting the port 9091 for each (which is why I aligned them at the start— we'd use 9092 and 9093 for brokers 2 and 3, respectively).
We can start the Confluent cluster by running docker-compose up --detach, and we can also now start up Metricbeat and Filebeat and they will start gathering Kafka logs and metrics.
After bringing up the cp-all-in-one Kafka cluster, it creates and runs in its own virtual network, cp-all-in-one_default. Because we're using service/host names in our labels, Metricbeat needs to run in the same network so it can resolve the names and connect correctly. To start Metricbeat we include the network name in the run command:
docker run -d \
    --name=metricbeat \
    --user=root \
    --network cp-all-in-one_default \
    --volume="$(pwd)/metricbeat.docker.yml:/usr/share/metricbeat/metricbeat.yml:ro" \
    --volume="/var/run/docker.sock:/var/run/docker.sock:ro" \
    docker.elastic.co/beats/metricbeat:7.11.1 \
    -E cloud.id=elastic-observability-deployment:dXMtY2VudHJhbDEuZ2NwLmNsb3VkLmV... \
    -E cloud.auth=elastic:some-long-random-password \
    -e -strict.perms=false
Filebeat's run command is similar, but doesn't require the network because it's not connecting to the other containers, but rather directly from the Docker host:
docker run -d \
    --name=filebeat \
    --user=root \
    --volume="$(pwd)/filebeat.docker.yml:/usr/share/filebeat/filebeat.yml:ro" \
    --volume="/mnt/data/docker/containers:/var/lib/docker/containers:ro" \
    --volume="/var/run/docker.sock:/var/run/docker.sock:ro" \
    docker.elastic.co/beats/filebeat:7.11.1 \
    -E cloud.id=elastic-observability-deployment:dXMtY2VudHJhbDEuZ2NwLmNsb3VkLmV... \
    -E cloud.auth=elastic:some-long-random-password \
    -e -strict.perms=false
In each case, we load the configuration YAML file, map the docker.sock file from the host to the container, and include the connectivity information (if you're running a self-managed cluster, grab the credentials that you used when loading the collateral). Note that if you're running on Docker Desktop on a Mac you won't have access to the logs, because they're stored inside the virtual machine.
Visualizing Kafka and ZooKeeper performance and history
Now we're capturing service-specific logs from our Kafka brokers, and logs and metrics from Kafka and ZooKeeper. If you navigate to the dashboards in Kibana and filter you should see dashboards for Kafka,
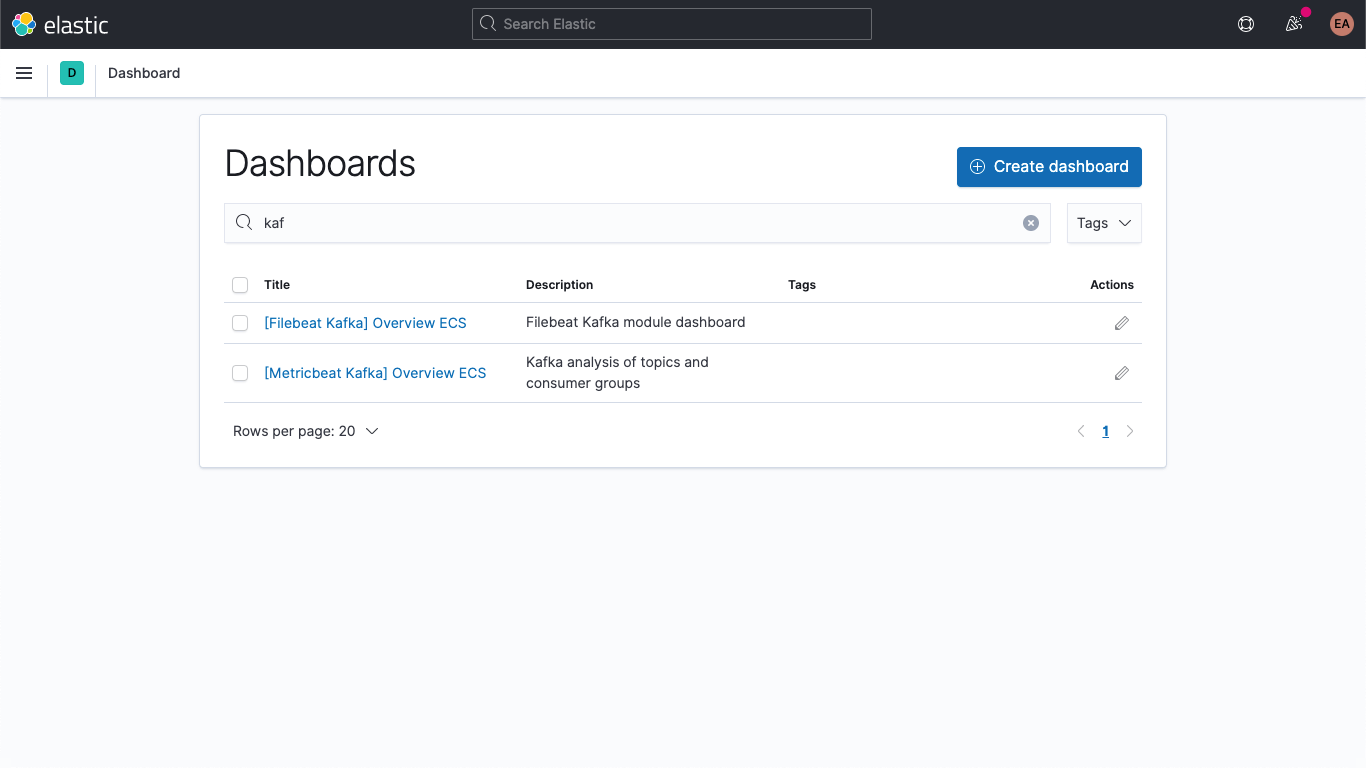
Including the Kafka logs dashboard:
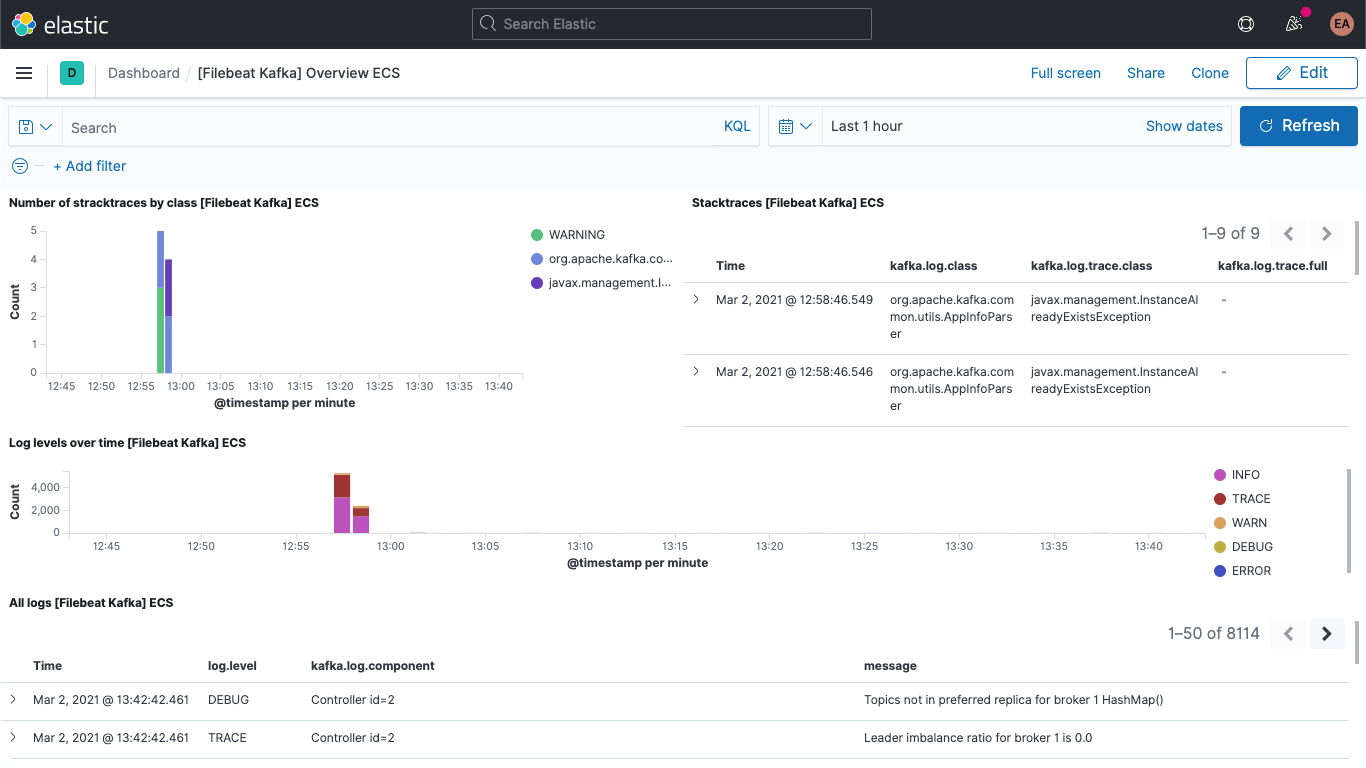
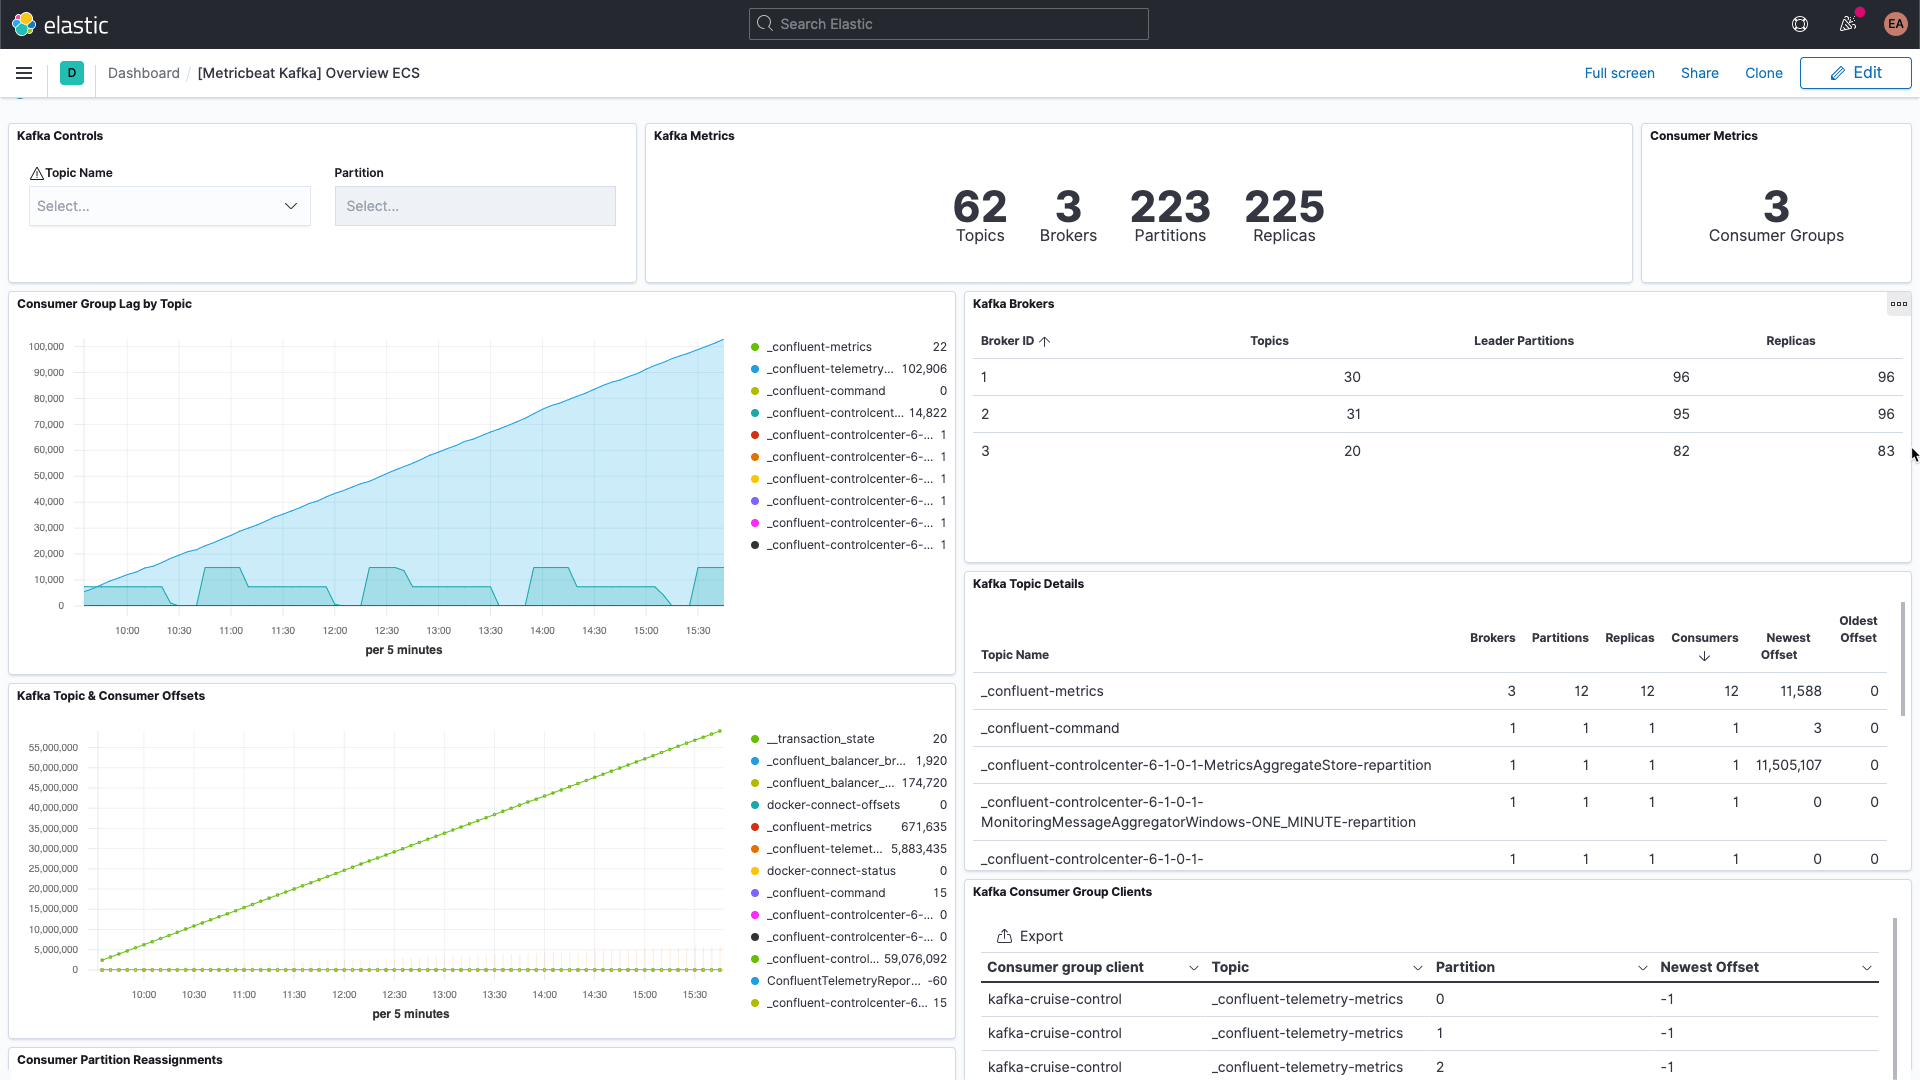
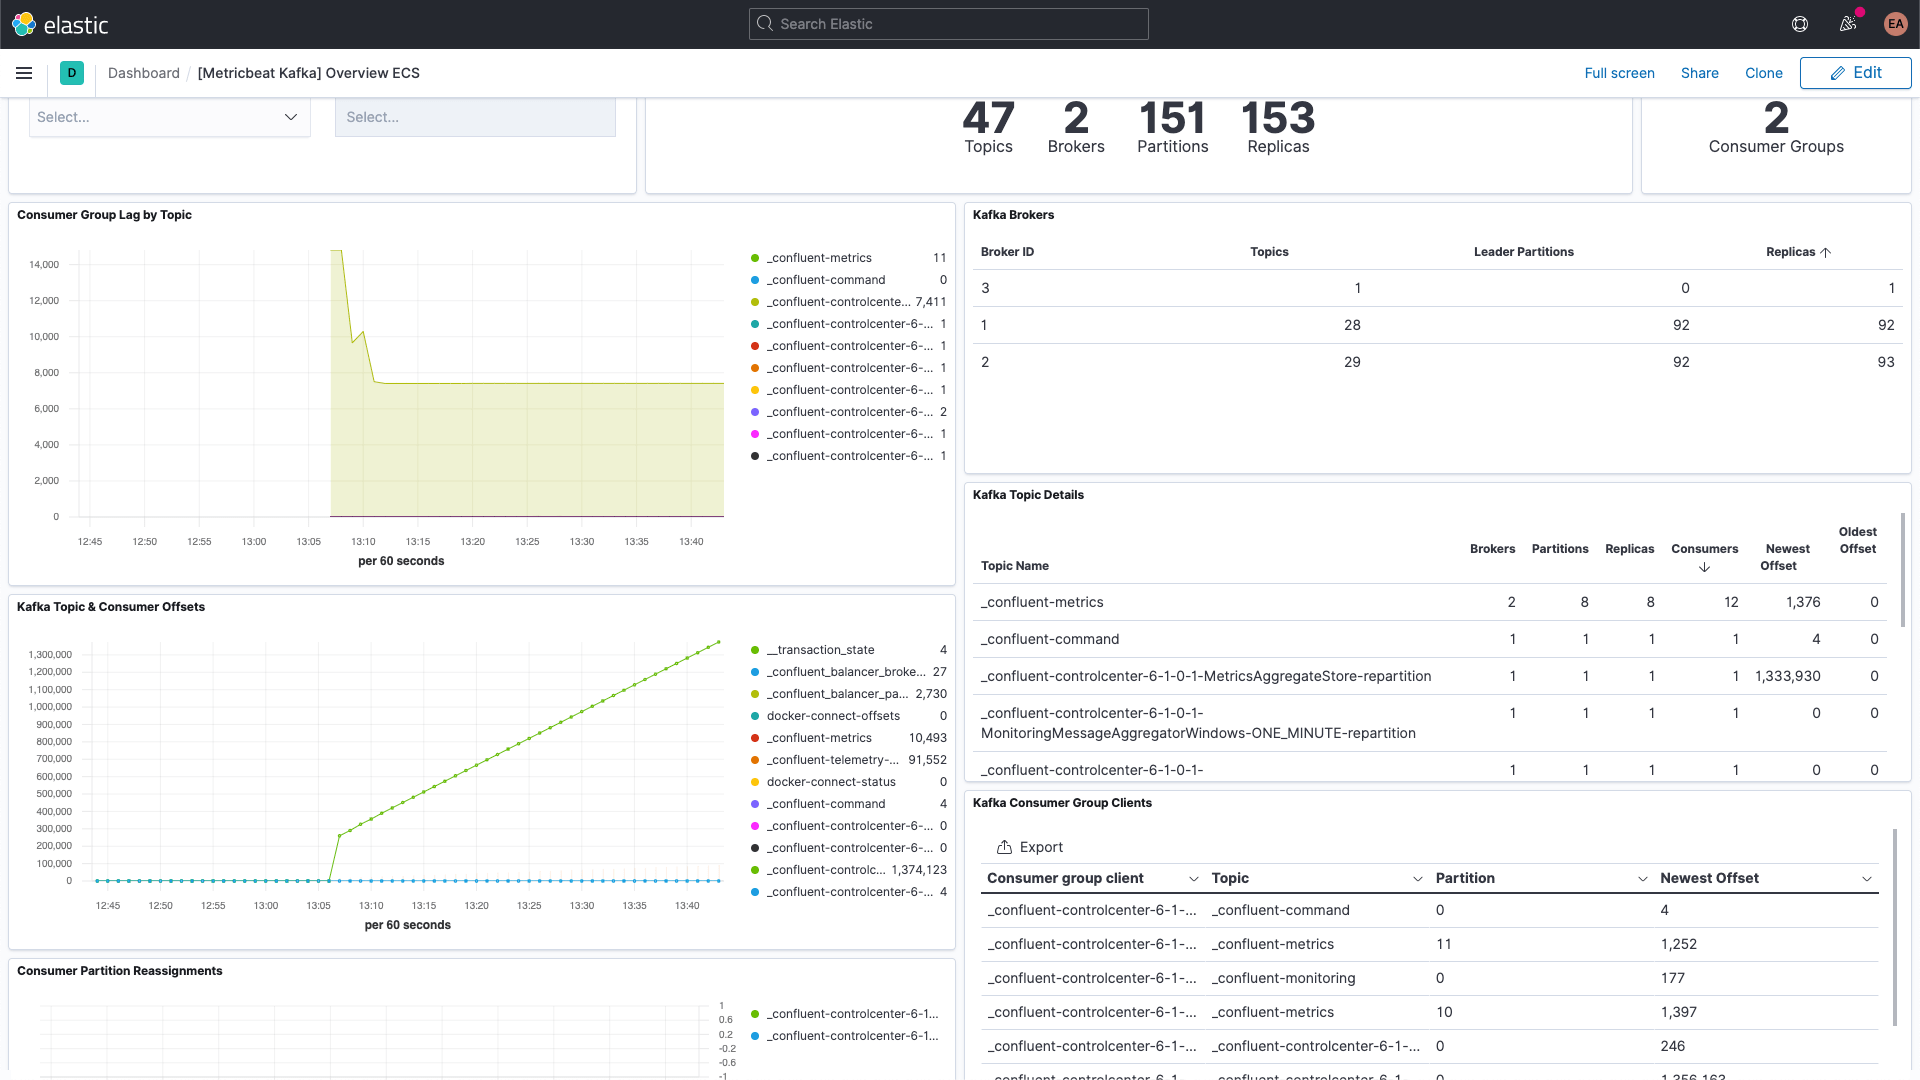
And the Kafka metrics dashboard:
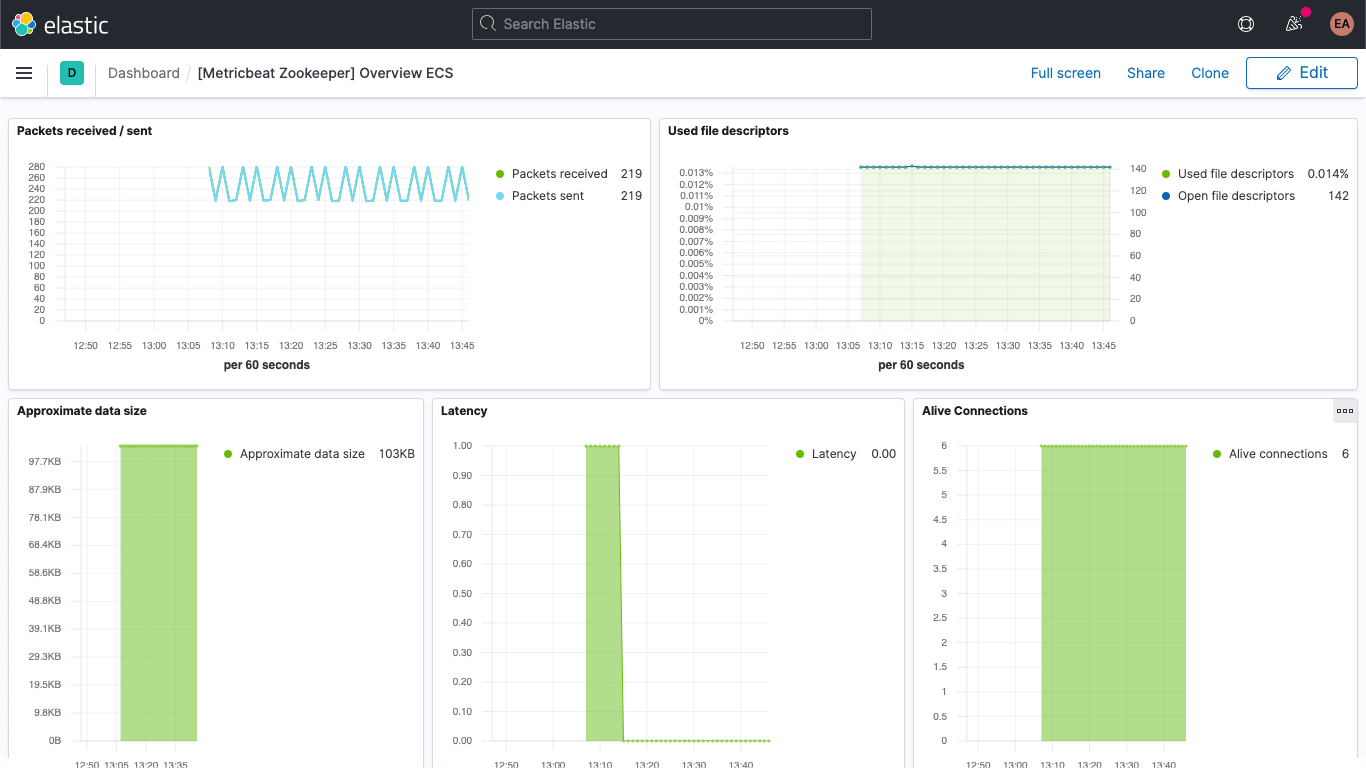
There is also a dashboard for ZooKeeper metrics.
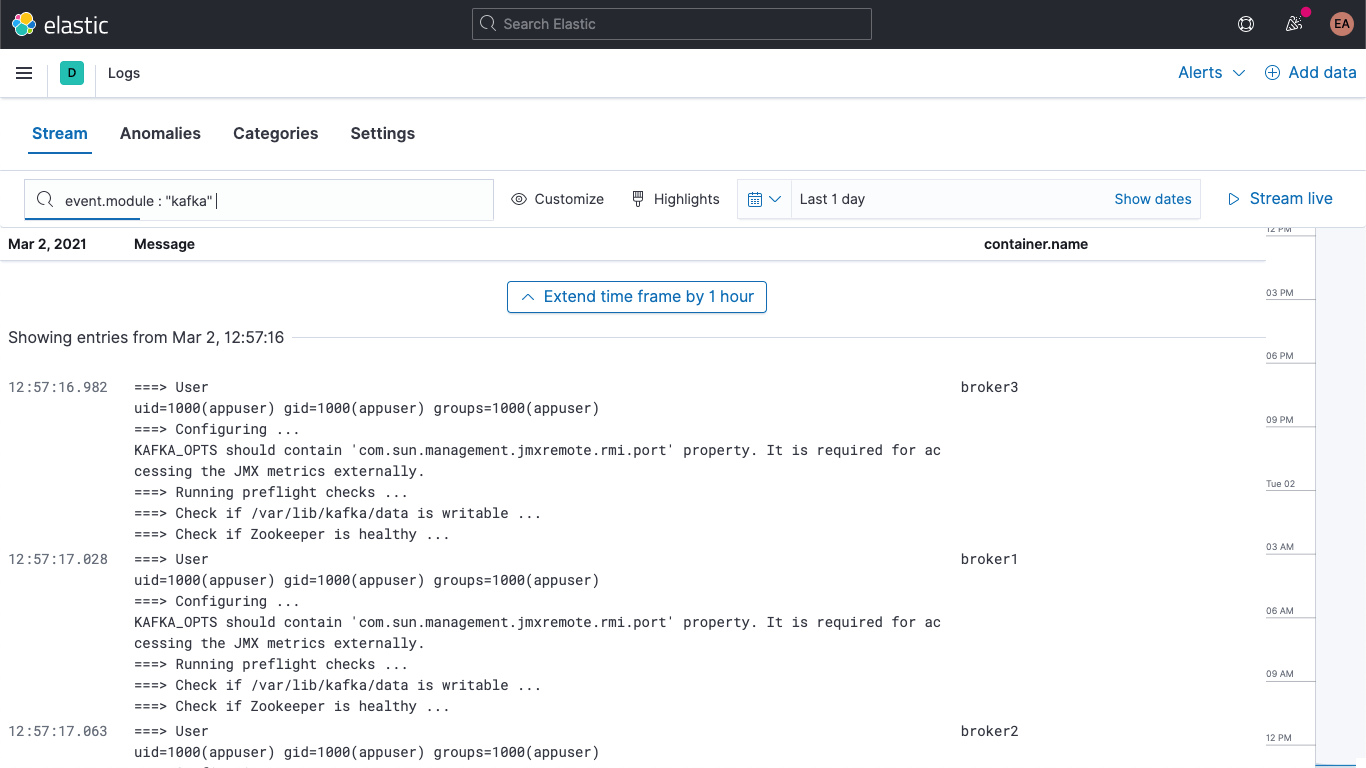
Additionally, your Kafka and ZooKeeper logs are available in the Logs app in Kibana, allowing you to filter, search, and break them down:
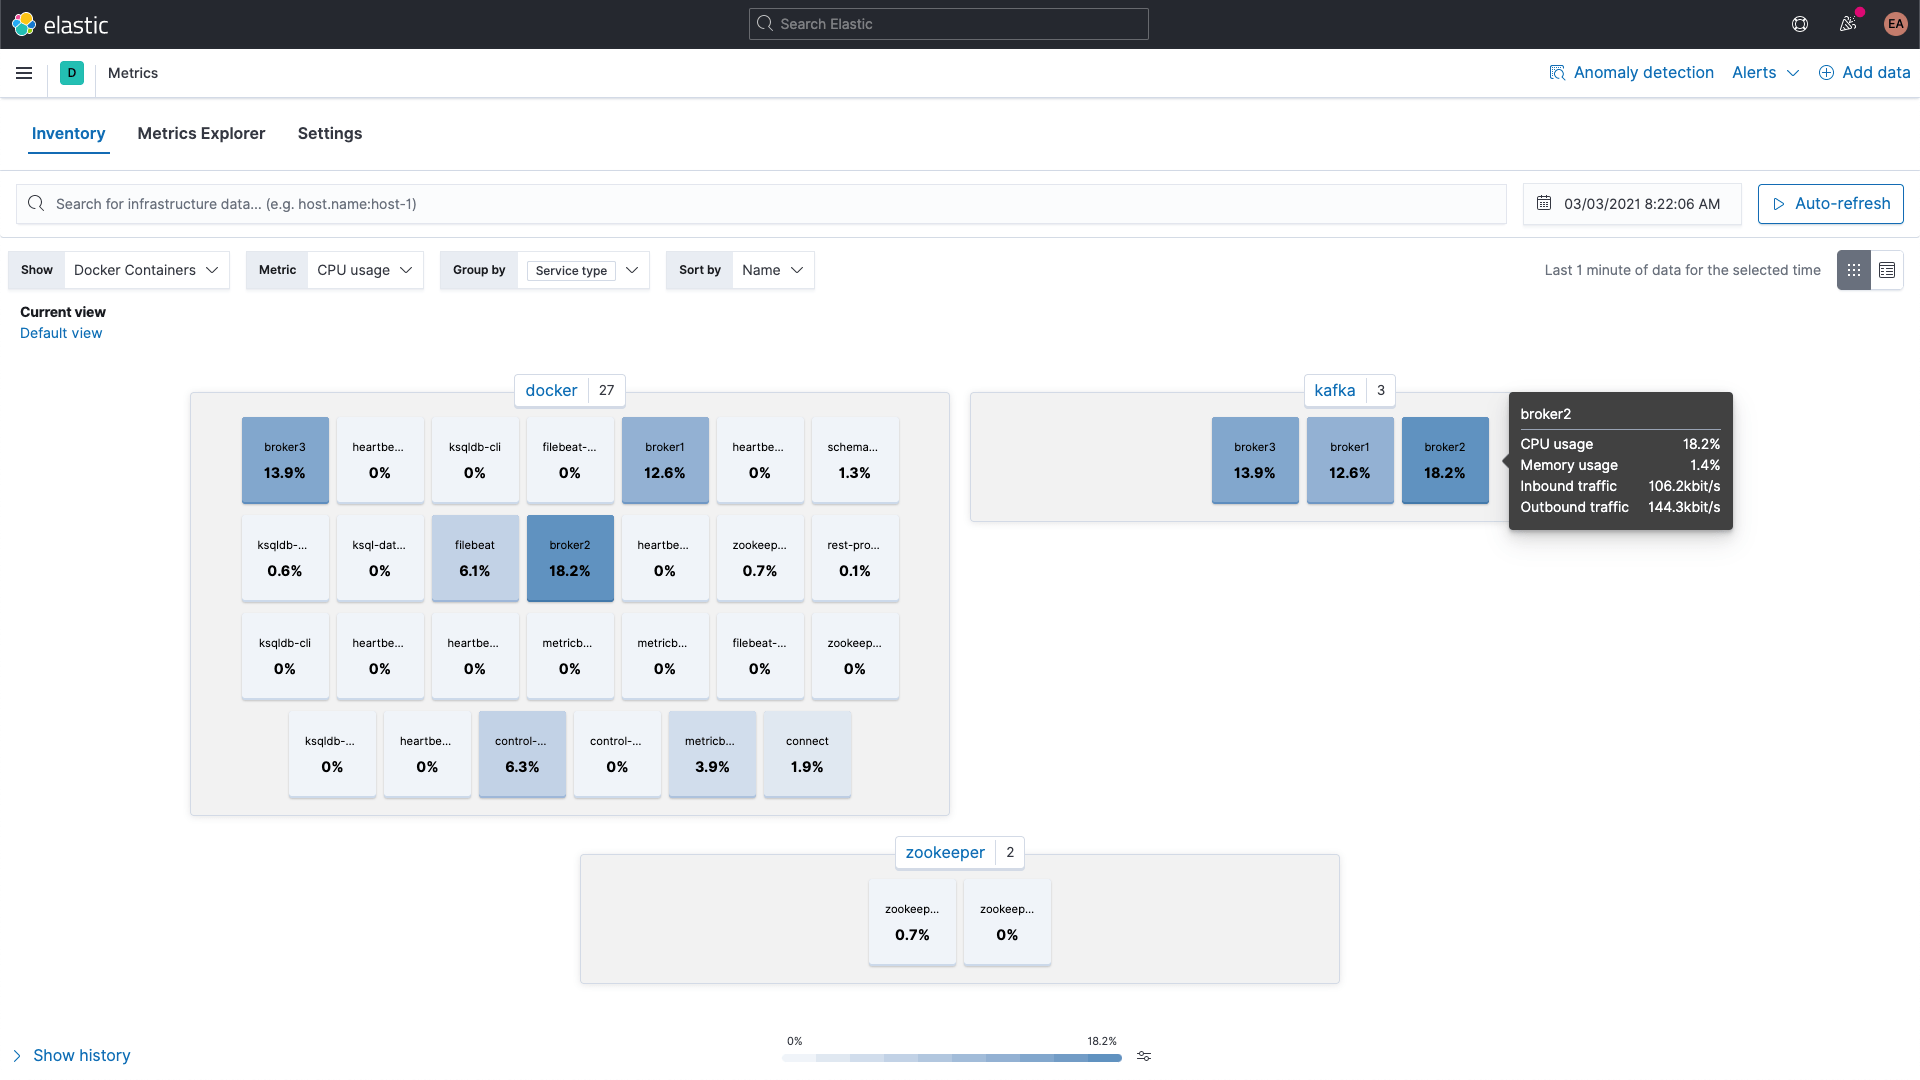
While the Kafka and ZooKeeper containers' metrics can be browsed using the Metrics app in Kibana, shown here grouped by service type:
Broker metrics
Let's jump back and also gather metrics from the broker metricset in the kafka module. I mentioned earlier that those metrics are retrieved from JMX. The broker, producer, and consumer metricsets leverage Jolokia, a JMX to HTTP bridge, under the covers. The broker metricset is also part of the kafka module, but because it uses JMX it has to use a different port than the consumergroup and partition metricsets, which means we need a new block in the labels for our brokers, similar to the annotation configuration for multiple sets of hints.
We also need to include the jar for Jolokia — we'll add that to the broker containers via a volume, and set it up as well. According to the download page, the current version of the Jolokia JVM agent is 1.6.2, so we'll grab that (the -OL tells cURL to save the file as the remote name, and to follow redirects):
curl -OL https://search.maven.org/remotecontent?filepath=org/jolokia/jolokia-jvm/1.6.2/jolokia-jvm-1.6.2-agent.jar</a>
We add a section to the configuration for each of the brokers to attach the JAR file to the containers:
    volumes:
      - ./jolokia-jvm-1.6.2-agent.jar:/home/appuser/jolokia.jar
And specify the KAFKA_JVM_OPTS to attach the JAR as a Java agent (note that the ports are per broker, so it's 8771-8773 for brokers 1, 2, and 3):
KAFKA_JMX_OPTS: '-javaagent:/home/appuser/jolokia.jar=port=8771,host=broker1 -Dcom.sun.management.jmxremote=true -Dcom.sun.management.jmxremote.authenticate=false -Dcom.sun.management.jmxremote.ssl=false'
I am not using any kind of authentication for this, so I have to add a couple flags to the launch. Notice that the jolokia.jar file path in the KAFKA_JMX_OPTS matches the path on the volume.
We need to make a couple more minor tweaks. Because we're using Jolokia we no longer need to expose the KAFKA_JMX_PORT in the ports section. Instead, we'll expose the port that Jolokia is listening on, 8771. We'll also remove the KAFKA_JMX_* values from the configuration.
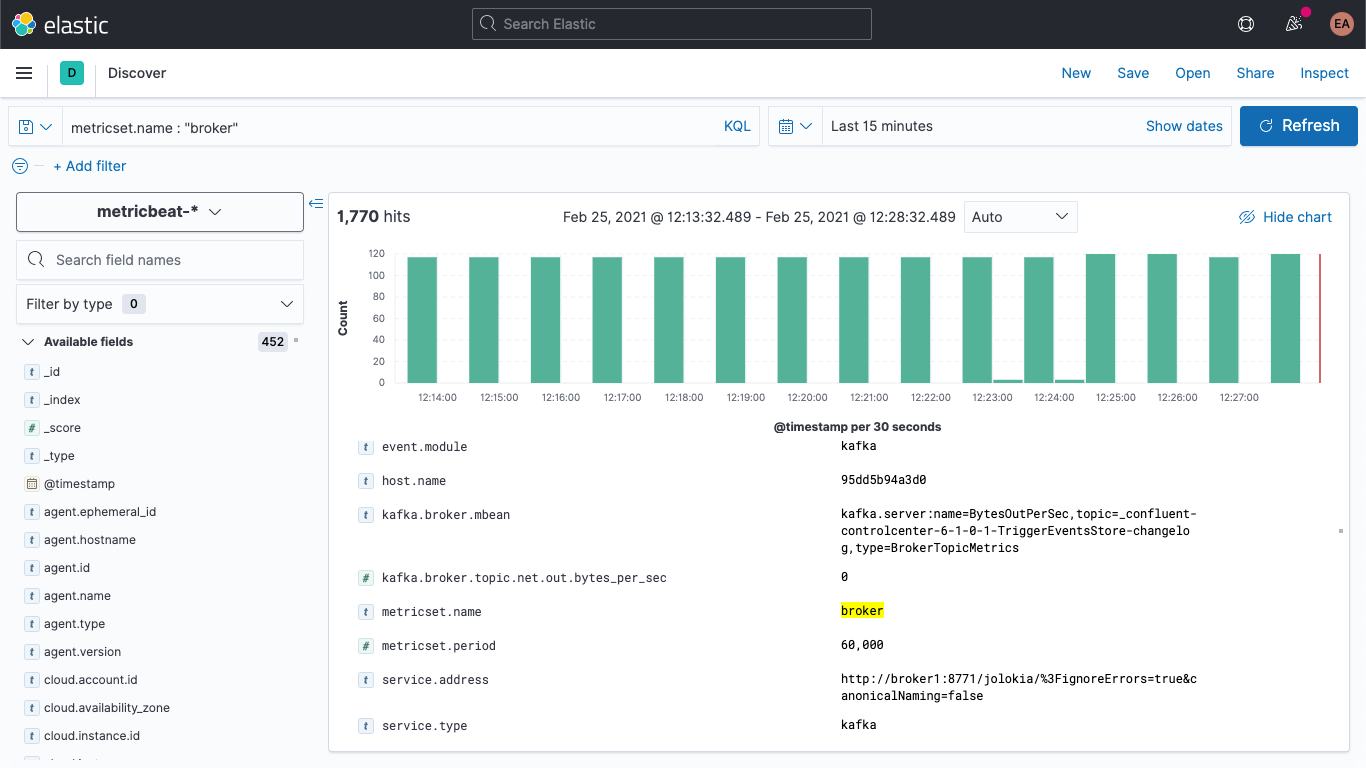
If we restart our Kafka cluster (docker-compose up --detach) we'll start to see the broker metrics showing up in our Elasticsearch deployment. If I jump over to the discover tab, select the metricbeat-* index pattern, and search for metricset.name : "broker" I can see that I indeed have data:
The structure of the broker metrics looks kind of like this:
kafka
 └─ broker
    ├── address
    ├── id
    ├── log
    │   └── flush_rate
    ├── mbean
    ├── messages_in
    ├── net
    │   ├── in
    │   │   └── bytes_per_sec
    │   ├── out
    │   │   └── bytes_per_sec
    │   └── rejected
    │       └── bytes_per_sec
    ├── replication
    │   ├── leader_elections
    │   └── unclean_leader_elections
    └── request
        ├── channel
        │   ├── fetch
        │   │   ├── failed
        │   │   └── failed_per_second
        │   ├── produce
        │   │   ├── failed
        │   │   └── failed_per_second
        │   └── queue
        │       └── size
        ├── session
        │   └── zookeeper
        │       ├── disconnect
        │       ├── expire
        │       ├── readonly
        │       └── sync
        └── topic
            ├── messages_in
            └── net
                ├── in
                │   └── bytes_per_sec
                ├── out
                │   └── bytes_per_sec
                └── rejected
                    └── bytes_per_sec
Essentially coming out as name/value pairs, as indicated by the kafka.broker.mbean field. Let's look at the kafka.broker.mbean field from an example metric:
kafka.server:name=BytesOutPerSec,topic=_confluent-controlcenter-6-1-0-1-TriggerEventsStore-changelog,type=BrokerTopicMetrics
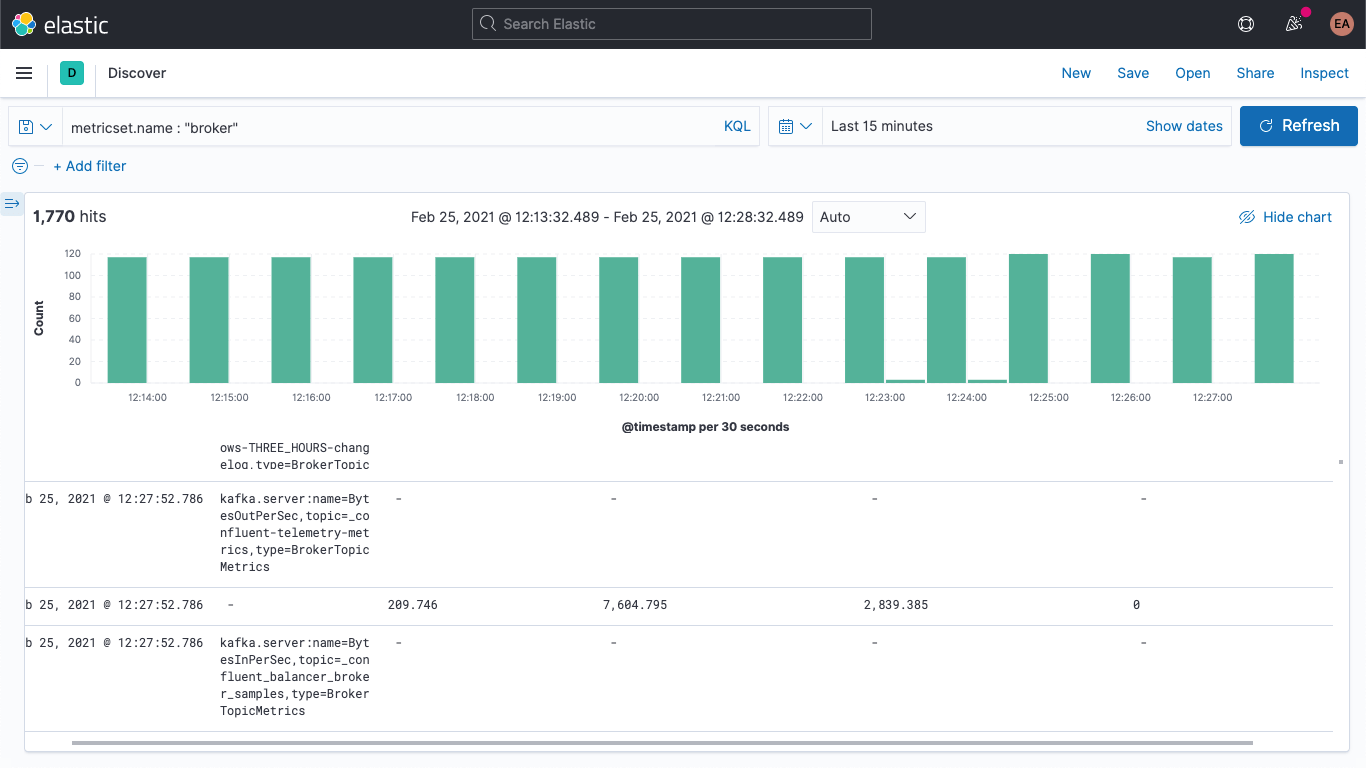
This contains the metric name (BytesOutPerSec), the Kafka topic that it refers to (_confluent-controlcenter-6-1-0-1-TriggerEventsStore-changelog), and the metric type (BrokerTopicMetrics). Depending on the metric type and name, different fields will be set. In this example, only the kafka.broker.topic.net.out.bytes_per_sec is populated (it's 0). If we look at this in a somewhat columnar fashion, you can see that the data is very sparse:
We can collapse this a bit if we add an ingest pipeline, to break the mbean field down into individual fields, which will also allow us to more easily visualize the data. We're going to break it down into three fields:
- KAFKA_BROKER_METRIC (which would beBytesOutPerSec from the example above)
- KAFKA_BROKER_TOPIC (which would be_confluent-controlcenter-6-1-0-1-TriggerEventsStore-changelog from the example above)
- KAFKA_BROKER_TYPE (which would beBrokerTopicMetrics from the example above)
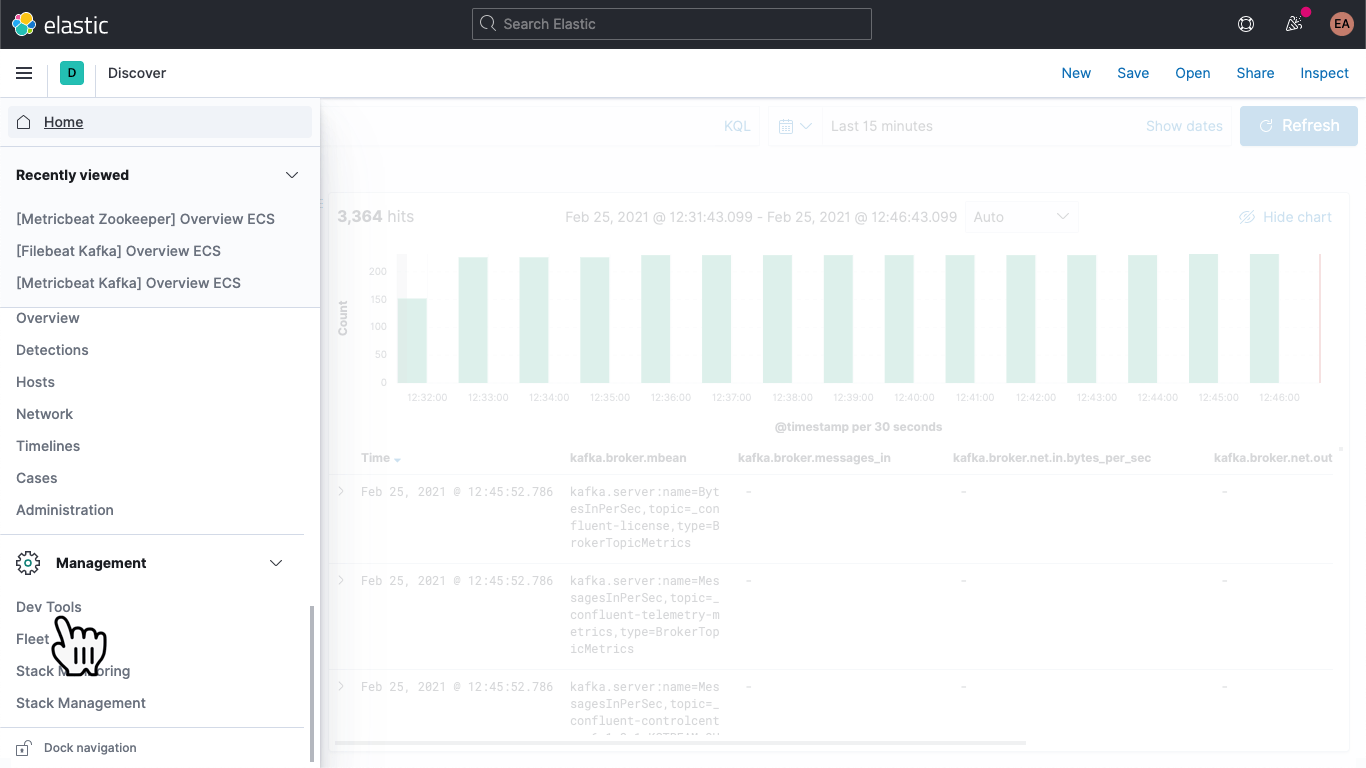
In Kibana, navigate over to DevTools:
Once there, paste in the following to define an ingest pipeline called kafka-broker-fields
PUT _ingest/pipeline/kafka-broker-fields
{
  "processors": [
    {
      "grok": {
        "if": "ctx.kafka?.broker?.mbean != null",
        "field": "kafka.broker.mbean",
        "patterns": ["kafka.server:name=%{GREEDYDATA:kafka_broker_metric},topic=%{GREEDYDATA:kafka_broker_topic},type=%{GREEDYDATA:kafka_broker_type}"
        ]
      }
    }
  ]
}
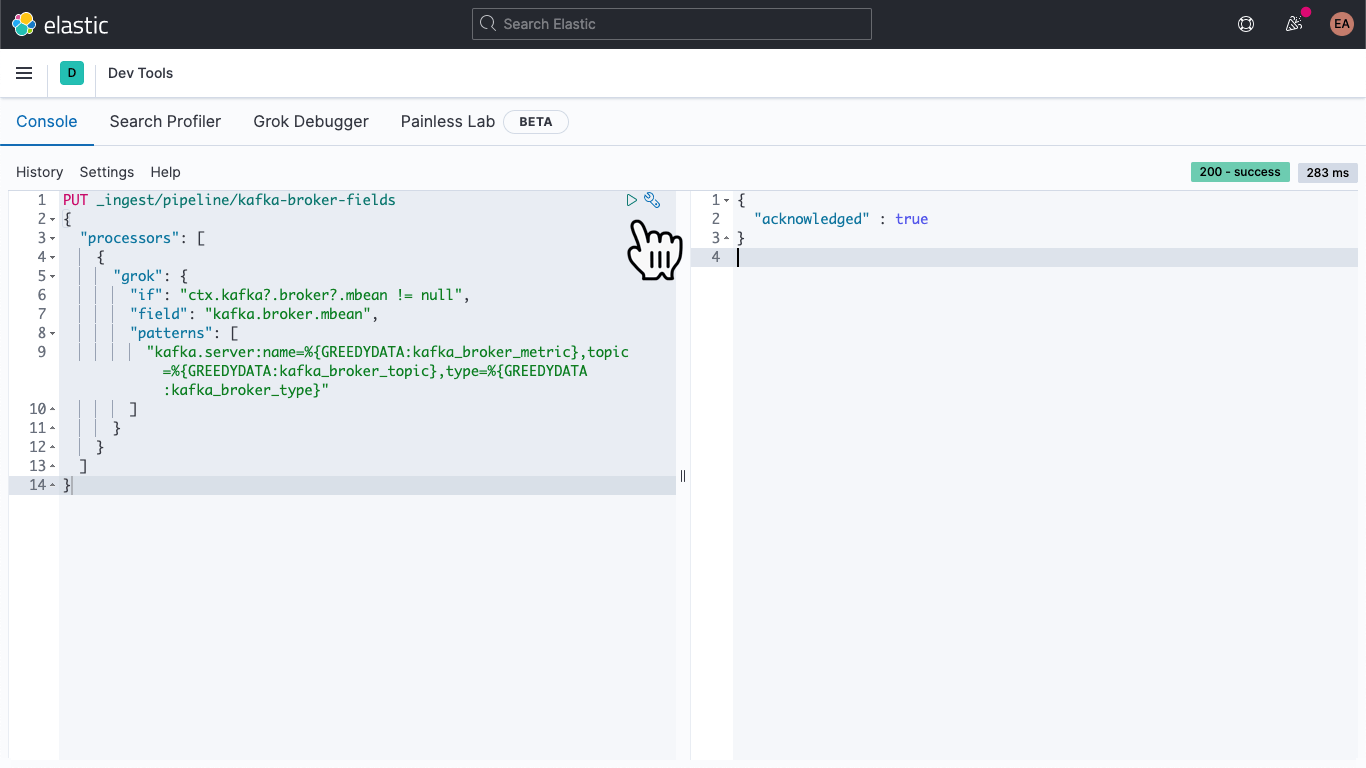
Then hit the "play" icon. You should end up with an acknowledgement, as shown above.
Our ingest pipeline is in place, but we haven't done anything with it yet. Our old data is still sparse and tricky to access, and new data is still coming in the same way. Let's address the latter part first.
Open up the metricbeat.docker.yml file in your favorite text editor, and add a line to the output.elasticsearch block (you can remove the hosts, username, and password config there if you aren't using it), and specify our pipeline, as such:
output.elasticsearch:
  pipeline: kafka-broker-fields
This tells Elasticsearch that each document that comes in should pass through this pipeline to check for our mbean field. Restart Metricbeat:
docker rm --force metricbeat
docker run -d \
    --name=metricbeat \
    --user=root \
    --network cp-all-in-one_default \
    --volume="$(pwd)/metricbeat.docker.yml:/usr/share/metricbeat/metricbeat.yml:ro" \
    --volume="/var/run/docker.sock:/var/run/docker.sock:ro" \
    docker.elastic.co/beats/metricbeat:7.11.1 \
    -E cloud.id=elastic-observability-deployment:dXMtY2VudHJhbDEuZ2NwLmNsb3VkLmV... \
    -E cloud.auth=elastic:some-long-random-password \
    -e -strict.perms=false
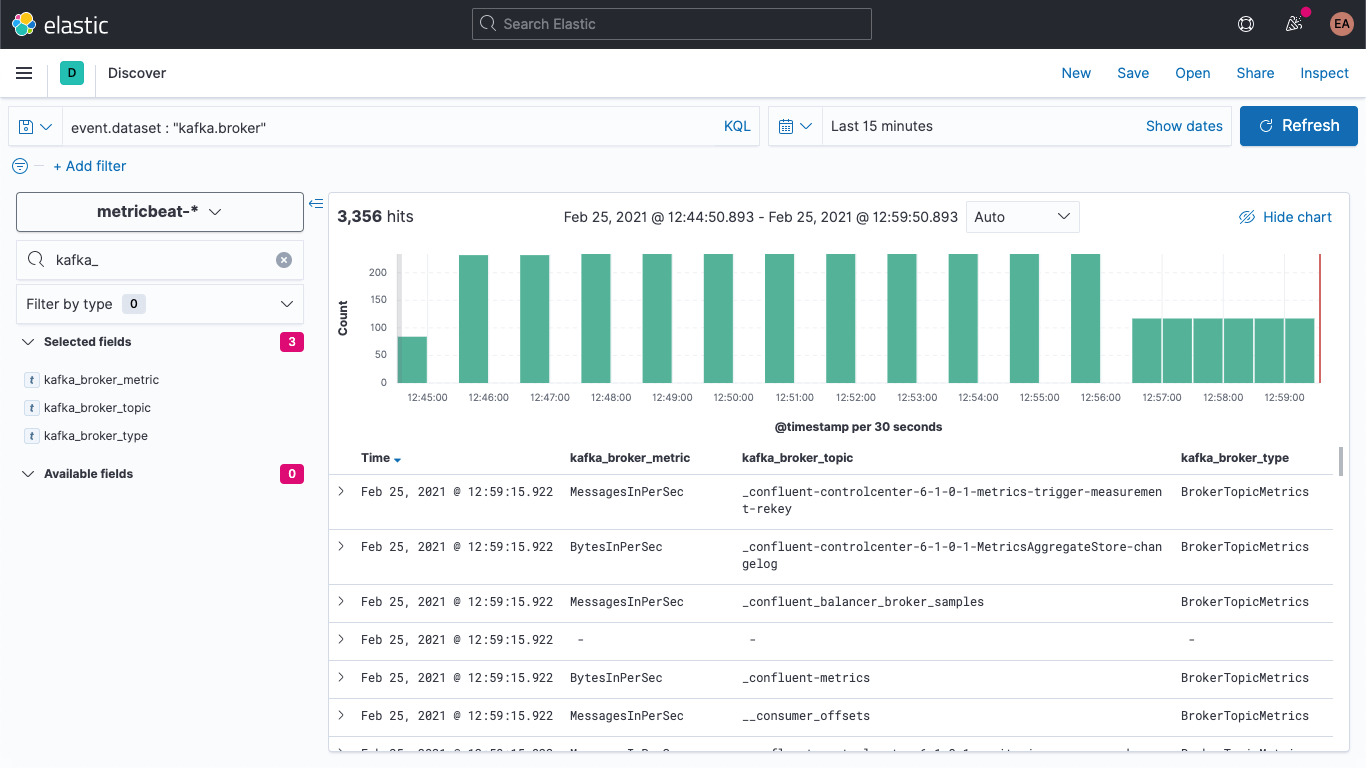
We can verify in Discover that new documents have the new fields:
We can also update the older documents so they have these fields populated as well. Back in DevTools, run this command:
POST metricbeat-*/_update_by_query?pipeline=kafka-broker-fields
It will probably warn you that it timed out, but it's running in the background and will finish asynchronously.
Visualizing Broker metrics
Jump over to the Metrics app, and select the "Metrics Explorer" tab to take our new fields for a spin. Paste in kafka.broker.topic.net.in.bytes_per_sec and kafka.broker.topic.net.out.bytes_per_sec to see these plotted together:
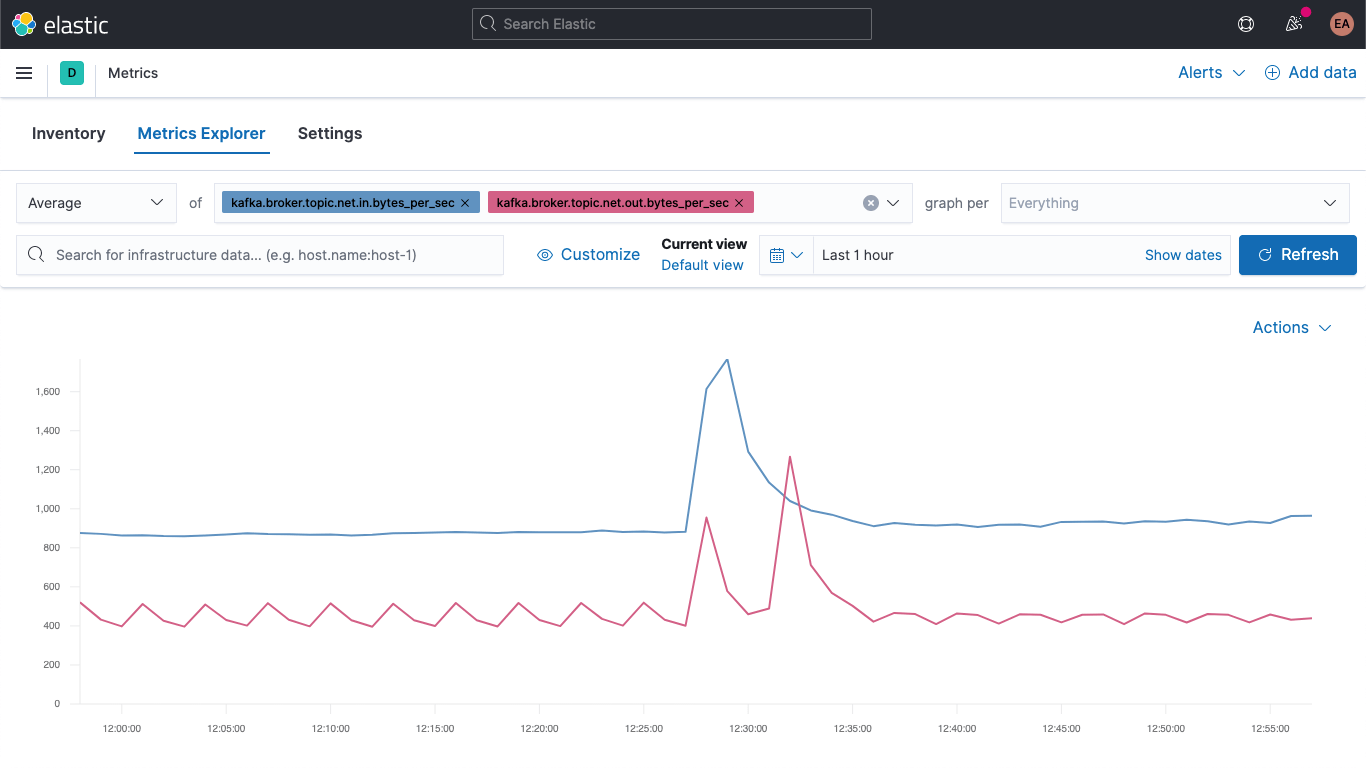
And now, leveraging one of our new fields, open the "graph per" dropdown and select kafka_broker_topic:
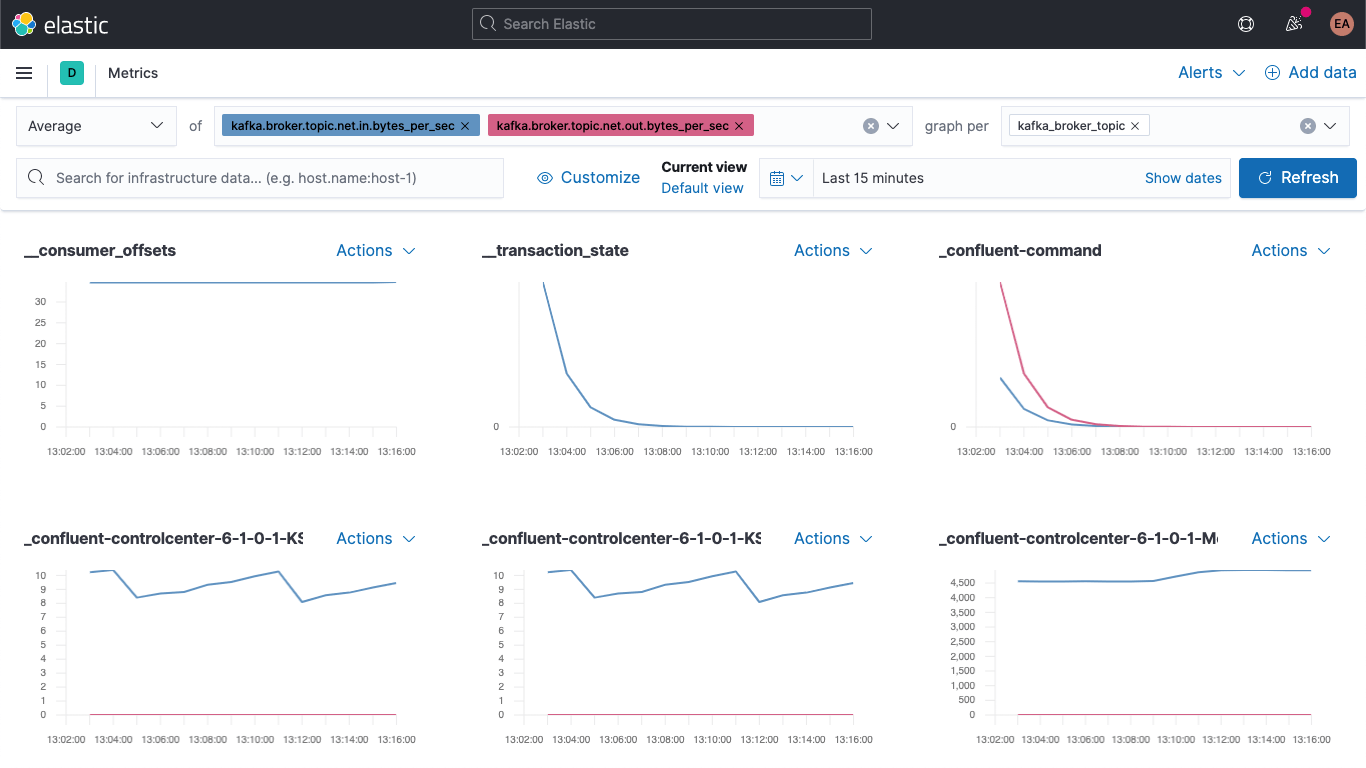
Not everything will have non-zero values (there's not a lot going on in the cluster right now), but it's a lot easier to plot the broker metrics and break them down by topic now. You can export any of these graphs as visualizations and load them onto your Kafka metrics dashboard, or create your own visualizations using the variety of charts and graphs available in Kibana. If you'd prefer a drag-and-drop experience for visualization building, try Lens.
A good place to start with visualizations of broker metrics are the failures in produce and fetch blocks:
kafka
 └─ broker
    └── request
        └── channel
            ├── fetch
            │   ├── failed
            │   └── failed_per_second
            ├── produce
            │   ├── failed
            │   └── failed_per_second
            └── queue
                └── size
The severity of failures here really depends on the use case. If the failures occur in an ecosystem where we are just getting intermittent updates — for example, stock prices or temperature readings, where we know that we'll get another one soon — a couple of failures might not be that bad, but if it's, say, an order system, dropping a few messages could be catastrophic, because it means that someone's not getting their shipment.
Wrapping up
We can now monitor Kafka brokers and ZooKeeper using Elastic Observability. We've also seen how to leverage hints to allow you to automatically monitor new instances of containerized services, and learned how an ingest pipeline can make your data easier to visualize. Try it out today with a free trial to the Elasticsearch Service on Elastic Cloud, or download the Elastic Stack and run it locally.
If you're not running a containerized Kafka cluster, but instead are running it as a managed service or on bare metal, stay tuned. In the near future we'll be following up on this blog with a couple related blogs:
- How to monitor a standalone Kafka cluster with Metricbeat and Filebeat
- How to monitor a standalone Kafka cluster with Elastic Agent