How to deploy the Elastic Stack using ECK to monitor OpenShift
Managing hundreds or thousands of containers has quickly become the standard for many organizations. With infrastructures growing more complex, we want every user to find value with Elastic (regardless of where or how they operate). We created Elastic Cloud on Kubernetes (ECK) — the official Operator — to simplify setup, upgrades, scaling, and more for running Elasticsearch and Kibana on Kubernetes. When you use ECK on OpenShift, Red Hat's Kubernetes container platform, you can fully orchestrate and manage a stateful Elastic Stack deployment in minutes, as well as take advantage of ECK's built-in best practices well beyond day 1.
Of course, with diverse infrastructures, monitoring becomes both more challenging and more critical. With Elastic Observability, you can store and analyze the logs and metrics from your OpenShift ecosystem alongside your other infrastructure monitoring data for a unified view. In this blog post we're going to see how easy it is to get the Elastic Stack up and running on OpenShift with ECK, as well as how to start monitoring OpenShift.
You will learn to:
- Set up Elasticsearch and Kibana on OpenShift using ECK.
- Ship OpenShift logs and metrics to Elasticsearch using Beats (also on ECK).
Prerequisites
To run the following instructions, you must first:
- Be a
system:adminuser or a user with the privileges to create Projects, CRDs, and RBAC resources at the cluster level. - Set virtual memory settings on the Kubernetes nodes (as described in Step 1 below).
Part 1: Set up an Elasticsearch deployment
In this first part, we're going to walk through deploying Elasticsearch and Kibana on OpenShift using ECK. By the end of this section, you'll have a fully functional Elastic Stack deployment up and running.
Step 1: Increase your virtual memory (recommended)
Elasticsearch uses a mmapfs directory by default to efficiently store its indices. The default operating system limits on mmap counts is likely to be too low, which may result in out of memory exceptions. For production workloads, it is strongly recommended to increase the kernel setting vm.max_map_count to 262144. The kernel setting vm.max_map_count=262144 can be set on the host either directly or by a dedicated init container, which must be privileged.
echo 'vm.max_map_count=262144' >> /etc/sysctl.conf
Step 2: Create new project
Create an elastic OpenShift project:
oc new-project elastic
Step 3: Install the ECK operator
oc apply -f <a href="https://download.elastic.co/downloads/eck/1.3.0/all-in-one.yaml">https://download.elastic.co/downloads/eck/1.3.0/all-in-one.yaml</a>
Step 4: Deploy Elasticsearch
Create an Elasticsearch monitoring cluster with an OpenShift route.
cat <<EOF | oc apply -n elastic -f -
# This sample sets up an Elasticsearch cluster with an OpenShift route
apiVersion: elasticsearch.k8s.elastic.co/v1
kind: Elasticsearch
metadata:
  name: monitoring
spec:
  version: 7.10.0
  nodeSets:
  - name: default
    count: 3
    config:
      node.store.allow_mmap: false
---
apiVersion: route.openshift.io/v1
kind: Route
metadata:
  name: monitoring
spec:
  #host: elasticsearch.example.com # override if you don't want to use the host that is automatically generated by OpenShift (<route-name>[-<namespace>].<suffix>)
  tls:
    termination: passthrough # Elasticsearch is the TLS endpoint
    insecureEdgeTerminationPolicy: Redirect
  to:
    kind: Service
    name: monitoring-es-http
EOF
Step 5: Deploy Kibana
cat <<EOF | oc apply -n elastic -f -
apiVersion: kibana.k8s.elastic.co/v1
kind: Kibana
metadata:
  name: kibana
spec:
  version: 7.10.0
  count: 1
  elasticsearchRef:
    name: "monitoring"
  podTemplate:
    spec:
      containers:
      - name: kibana
        resources:
          limits:
            memory: 1Gi
            cpu: 1
---
apiVersion: v1
kind: Route
metadata:
  name: kibana
spec:
  #host: kibana.example.com # override if you don't want to use the host that is automatically generated by OpenShift (<route-name>[-<namespace>].<suffix>)
  tls:
    termination: passthrough # Kibana is the TLS endpoint
    insecureEdgeTerminationPolicy: Redirect
  to:
    kind: Service
    name: kibana-kb-http
EOF
Step 6: Collect ES admin password
To extract the Elasticsearch elastic admin user, run the following command:
PW=$(oc get secret "monitoring-es-elastic-user" -o go-template='{{.data.elastic | base64decode }}')
Part 2: Monitoring OpenShift using Metricbeat and Filebeat on ECK
Now that the Elastic Stack is deployed, we can start using it to monitor OpenShift. We'll deploy Metricbeat and Filebeat on ECK to ingest observability data directly from OpenShift, and then we'll be able to easily monitor system health right from Elastic Observability.
Step 1: Setup Beats
Download the Beats manifests:
curl -L -O https://raw.githubusercontent.com/liladler/eck-on-openshift/main/filebeat_openshift.yaml
curl -L -O https://raw.githubusercontent.com/liladler/eck-on-openshift/main/metricbeat_openshift.yaml
Step 2: Add permissions to the Beats service accounts
Now that the Beats are configured, they're going to need proper access to OpenShift.
oc adm policy add-scc-to-user privileged system:serviceaccount:openshift-monitoring:metricbeat
oc adm policy add-scc-to-user privileged system:serviceaccount:openshift-monitoring:filebeat
Step 3: Patch node-selector
Override the default node selector for the openshift-monitoring namespace (or your custom namespace) to allow for scheduling on any node:
oc patch namespace openshift-monitoring -p \ '{"metadata": {"annotations": {"openshift.io/node-selector": ""}}}'
Step 4: Enable network between projects
oc adm pod-network join-projects --to=elastic openshift-monitoring
Step 5: Deploy the Beats
oc apply -f filebeat_openshift.yaml
oc apply -f metricbeat_openshift.yaml
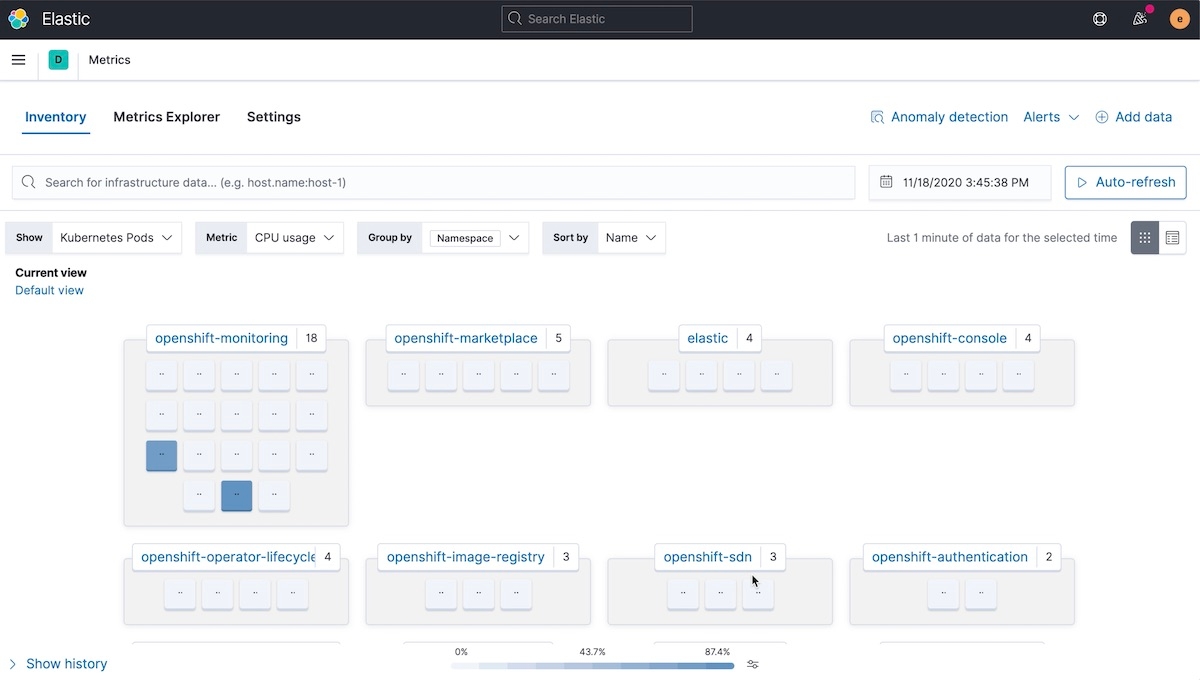
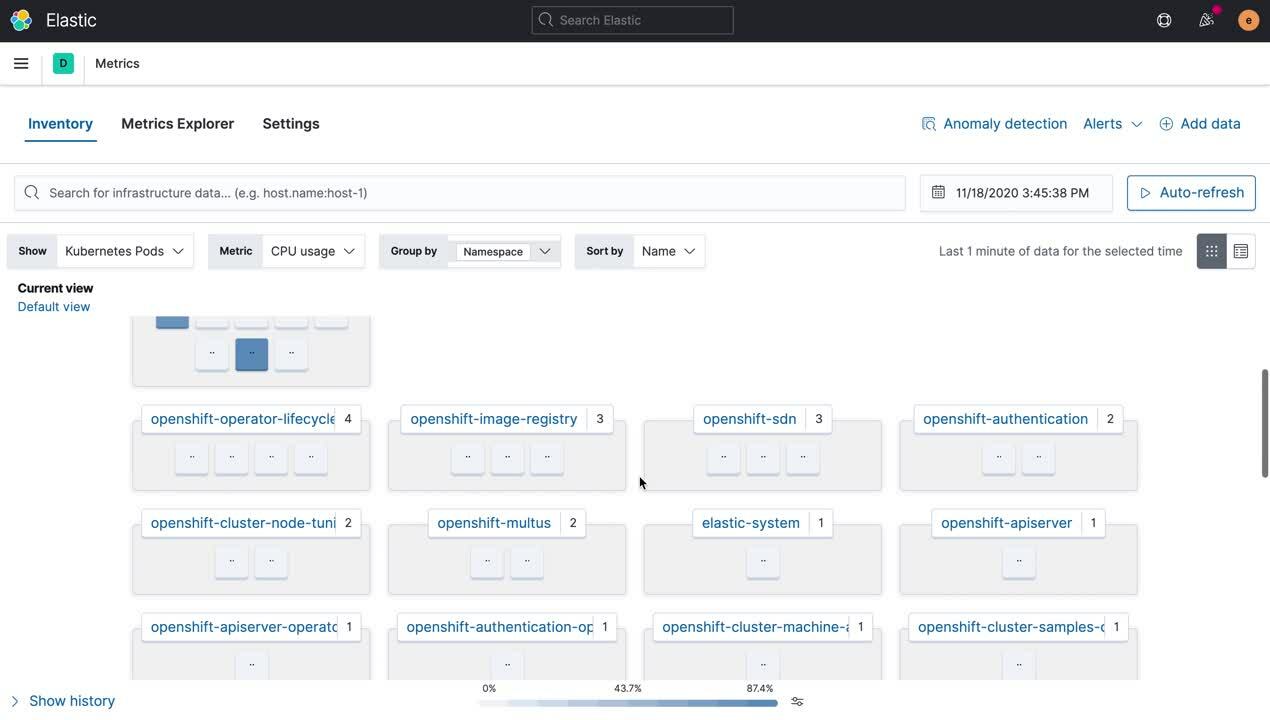
Monitor OpenShift with Elastic Observability
Now that we have Filebeat and Metricbeat shipping OpenShift logs and metrics to Elasticsearch, we can open up Kibana and start monitoring system health from Elastic Observability.
Wrapping up
Congratulations! You’ve provisioned a monitored OpenShift environment with maintainable and reusable manifests! If you'd like to take your system observability even further, you can deploy Elastic APM Server on ECK and bundle your application with the Elastic APM Agent.
With logs, metrics, and APM you can easily correlate it all into a single view allowing you to observe and troubleshoot your production environment in a single tool. Try it yourself free for 14-days on Elastic Cloud. And if you'd like to learn more about Elastic Observability, we'd recommend watching the Elastic Observability: A single pane of glass for all your observability data webinar.