Elastic on Elastic: How InfoSec uses the Elastic Stack for vulnerability management

 Share on Twitter
Share on Twitter

 Share on LinkedIn
Share on LinkedIn

 Share on Facebook
Share on Facebook

 Share by Email
Share by Email

 Print this page
Print
Vulnerability management (VM) is a challenging task. Of the three pillars of people, process, and technology, it is the latter that we have the most control over and that can make the greatest impact. We recognize that technology alone is not sufficient and must be accompanied by strong processes and skilled personnel. However, the right technology can greatly facilitate and improve the effectiveness of our vulnerability management efforts.
In this blog post, we will illustrate the value of the Elastic Stack as a data management platform for vulnerability management and demonstrate how we have fully automated the process of retrieving, enriching, and disseminating scan results to various teams.
While we are proud of and pleased with our accomplishments, there is still much work to be done. Every day, we grapple with a range of challenges and issues that are not necessarily mentioned in this blog post (e.g., asset ownership, vulnerability lifecycle) or not yet complete. Nonetheless, we remain committed to improving and addressing these challenges.
Architecture
To provide a clearer understanding of our environment, here are some additional details:
- We have approximately 27,000 instances across multiple cloud providers and regions. We have one person dedicated to vulnerability management, and we place a strong emphasis on automation as our environment is likely to grow faster than the InfoSec team.
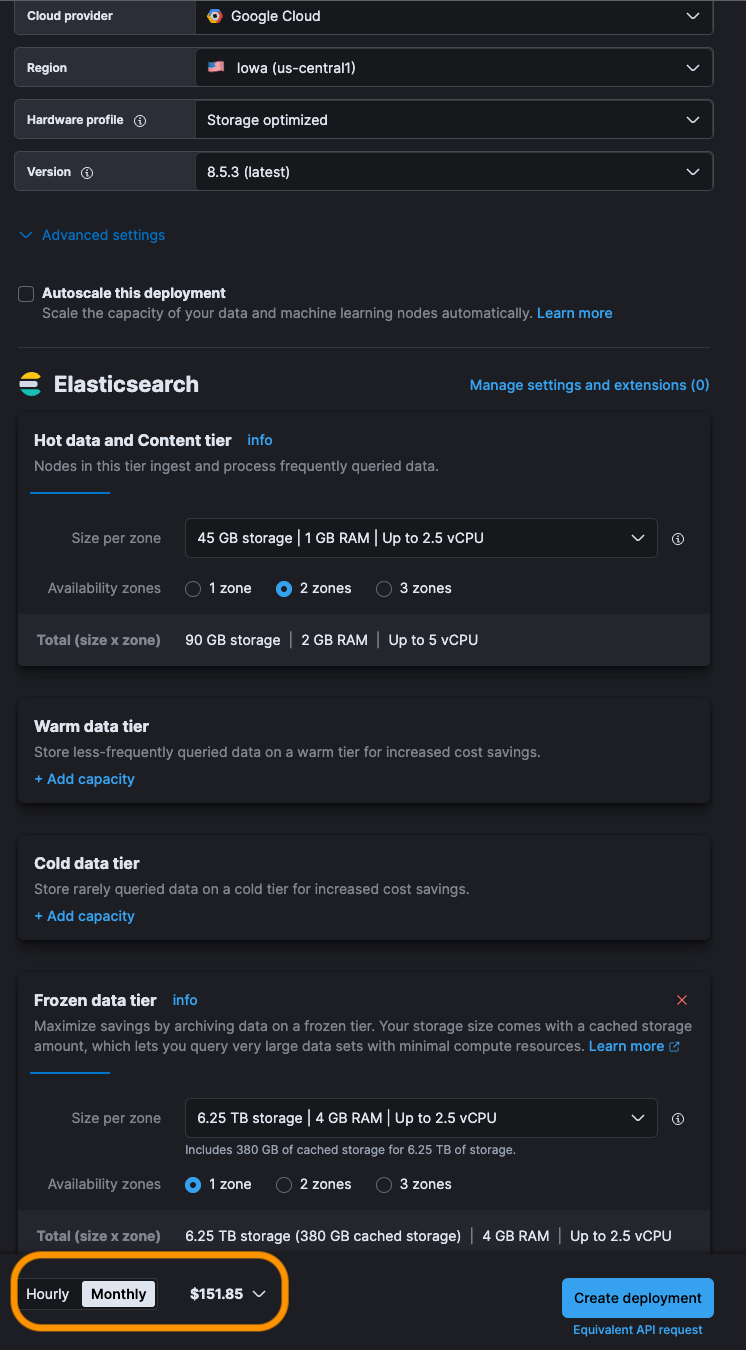
- Our Elastic Stack is deployed using Elastic Cloud on Kubernetes (ECK) on Google Kubernetes Engine (GKE) instances. We have chosen not to use Elastic Cloud as we want to separate the security monitoring platform from customer workloads.
- We ingest around 90GB of vulnerability data per month. On Elastic Cloud, this setup would cost approximately $150 per month for a retention period of 15 days in the hot tier and 5 years in the frozen tier.
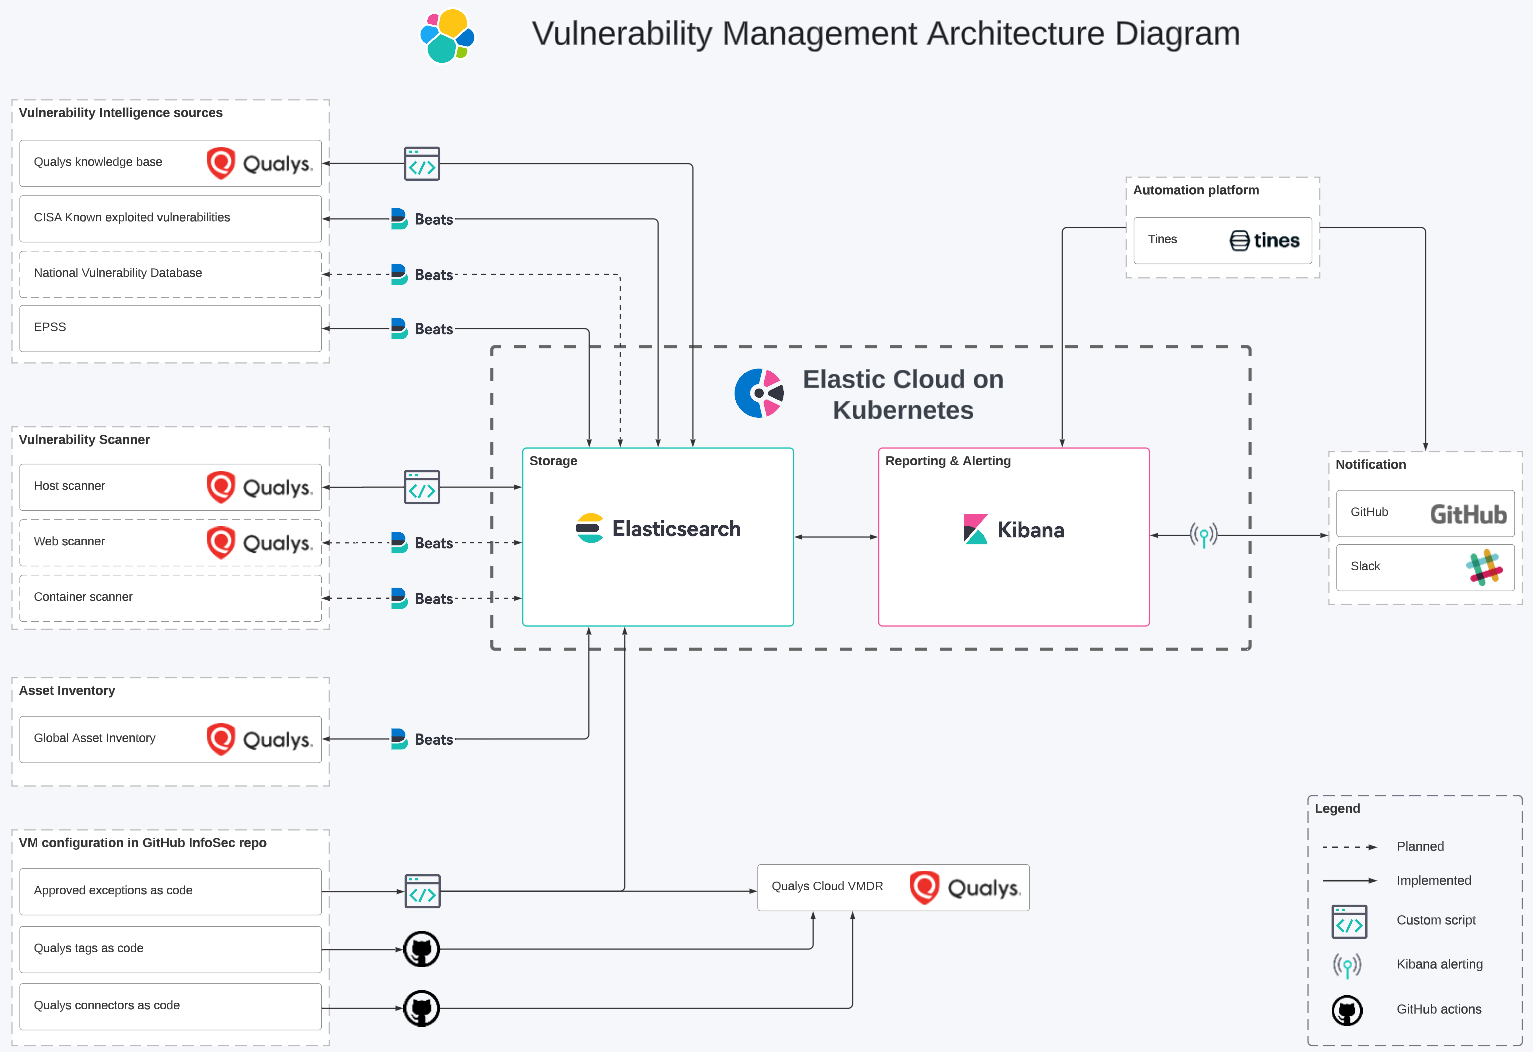
Our vulnerability management architecture consists of three main components:
- Data ingestion and enrichments: It involves the retrieval, transportation, formatting, and enhancement of data.
- Reporting and notification: It is the core component of our solution, utilizing the capabilities of Elasticsearch and Kibana to deliver pertinent information to the appropriate teams and individuals.
- Configuration management: It includes various processes for managing Qualys and tracking exceptions “as code.”
Data ingestion and enrichment
We took the approach of adding context and enrichment as close as possible to the source, as we want to limit the impact of a broken integration. It allows us to check data consistency, which would be really hard if we only relied on ingest/enrich pipelines. To add contextual information (environment, data classification, team owner, etc.) to our VM data, we are heavily using Qualys tags that are managed through code.
Ingestion
In order to efficiently ingest data into the Elastic Stack, we strive to utilize Elastic capabilities as much as possible. Our preferred method is Filebeat with the HTTP JSON module. With the recent inclusion of pagination and chain requests, we are able to accommodate the majority of our use cases. For example, we can have a first request to retrieve an authentication token and chain pagination requests to retrieve data, with the authentication token from the initial request.
Currently, we are using this method to ingest data from the First EPSS and CISA Known Exploited Vulnerability catalog. We are also in the process of incorporating data from NVD and VirusTotal data sources.
Qualys is the primary technology we utilize for vulnerability scanning. Since its VM and Knowledge Base APIs are XML-based only, our talented colleagues in the Security Engineering team have written a Go script to extract and push the data to the Elastic Stack.
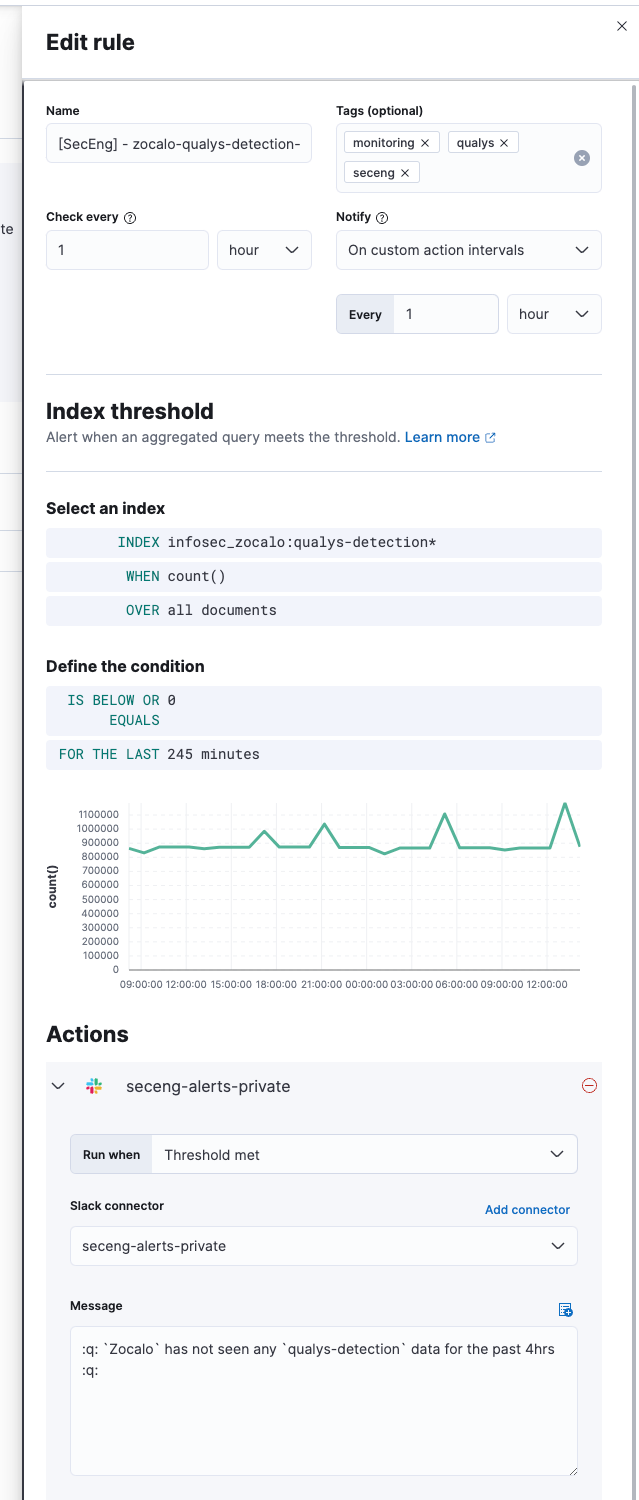
The native Elastic monitoring capabilities can be used to monitor ingestion. We have set up alerting in the event that no data is received.
ECS mapping
One of the primary advantages of using a single data platform is the ability to present data from multiple sources. However, this requires normalizing the data, which we can accomplish using Elastic Common Schema (ECS).
While not all of our data is currently ECS-compliant due to the schema's release after the data was collected, we are reaching a point where this is becoming problematic: we have difficulties creating dashboards with data from different sources/indices. As such, we are reevaluating our approach and considering storing raw source data while copying fields to ECS fields, allowing us to differentiate between the two.
We use a combination of processors and script fields in ingest pipelines to achieve our goals. Runtime fields are particularly useful for new needs, allowing us to test fields or dashboards without the need to re-ingest historical data.
Enrich from other indices
To fully optimize our vulnerability management solution, it is essential to enrich vulnerability and asset data. Context is crucial!
The enrich pipeline is where the transformation occurs. You can configure enrich processors (in an ingest pipeline) to retrieve data from another index and add it to the current event/index. We use this to enrich VM data with Qualys KnowledgeBase information, vulnerability intelligence from various sources, and eventually asset details from our custom asset inventory.
The only drawback to this approach is the need to utilize an external system to execute the enrich pipeline on a regular basis. However, this can be easily accomplished with a simple API call using curl.
Reporting and notifications
Metrics
One of the primary objectives of a vulnerability management program is to provide visibility across the entire organization. To this end, we have created multiple dashboards based on SANS recommendations, including executive, operational, and technical dashboards.
So far, the most used metric is what we refer to as Vulnerability Management SLO adherence. This metric is essentially the percentage of vulnerabilities outside of the SLO divided by the total number of vulnerabilities and assets. It can be thought of as the uptime percentage applied to vulnerabilities. We drew inspiration for this metric from the Business-friendly vulnerability management article. The age of a vulnerability is the difference between the Qualys detection was released and the last time it was found. If you spin up an instance with a vulnerability from 2021, it’ll be seen as outside of the expected SLO adherence from day one.
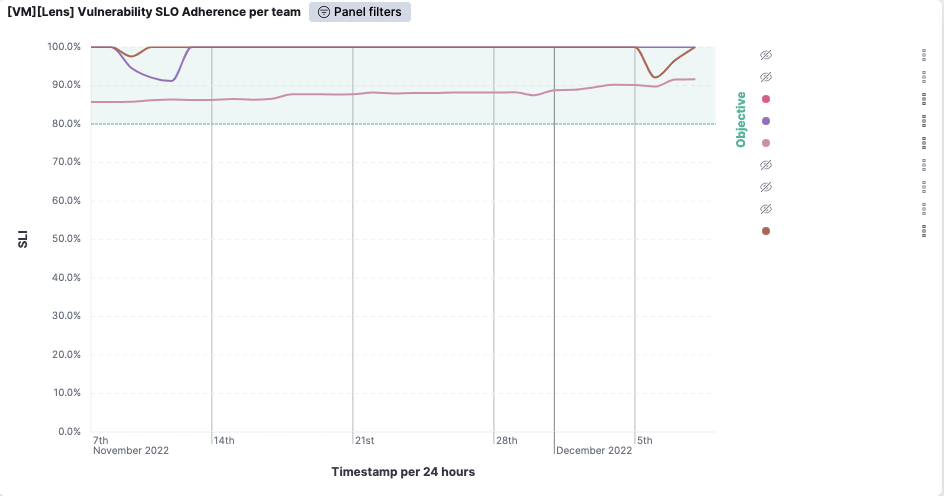
In the screenshot above (taken from one of our non-production environments), you can see that the violet team successfully patched all vulnerabilities early in November. Since the number of assets does not directly affect the score, we can easily compare teams and identify those that require the most attention.
By implementing Qualys connectors, we are able to track our coverage metric. For each cloud account that we have configured, we can see the percentage of instances that have the Qualys cloud agent installed.
Role-based access control (RBAC)
Vulnerability management data access is managed through document-level security. We use Qualys Connectors to add tags to assets associated with cloud accounts. By retrieving this asset tag data along with the vulnerability data, we can easily associate a role (Okta group) with the tag value. Since this role is defined at the document level, it affects all visualizations.
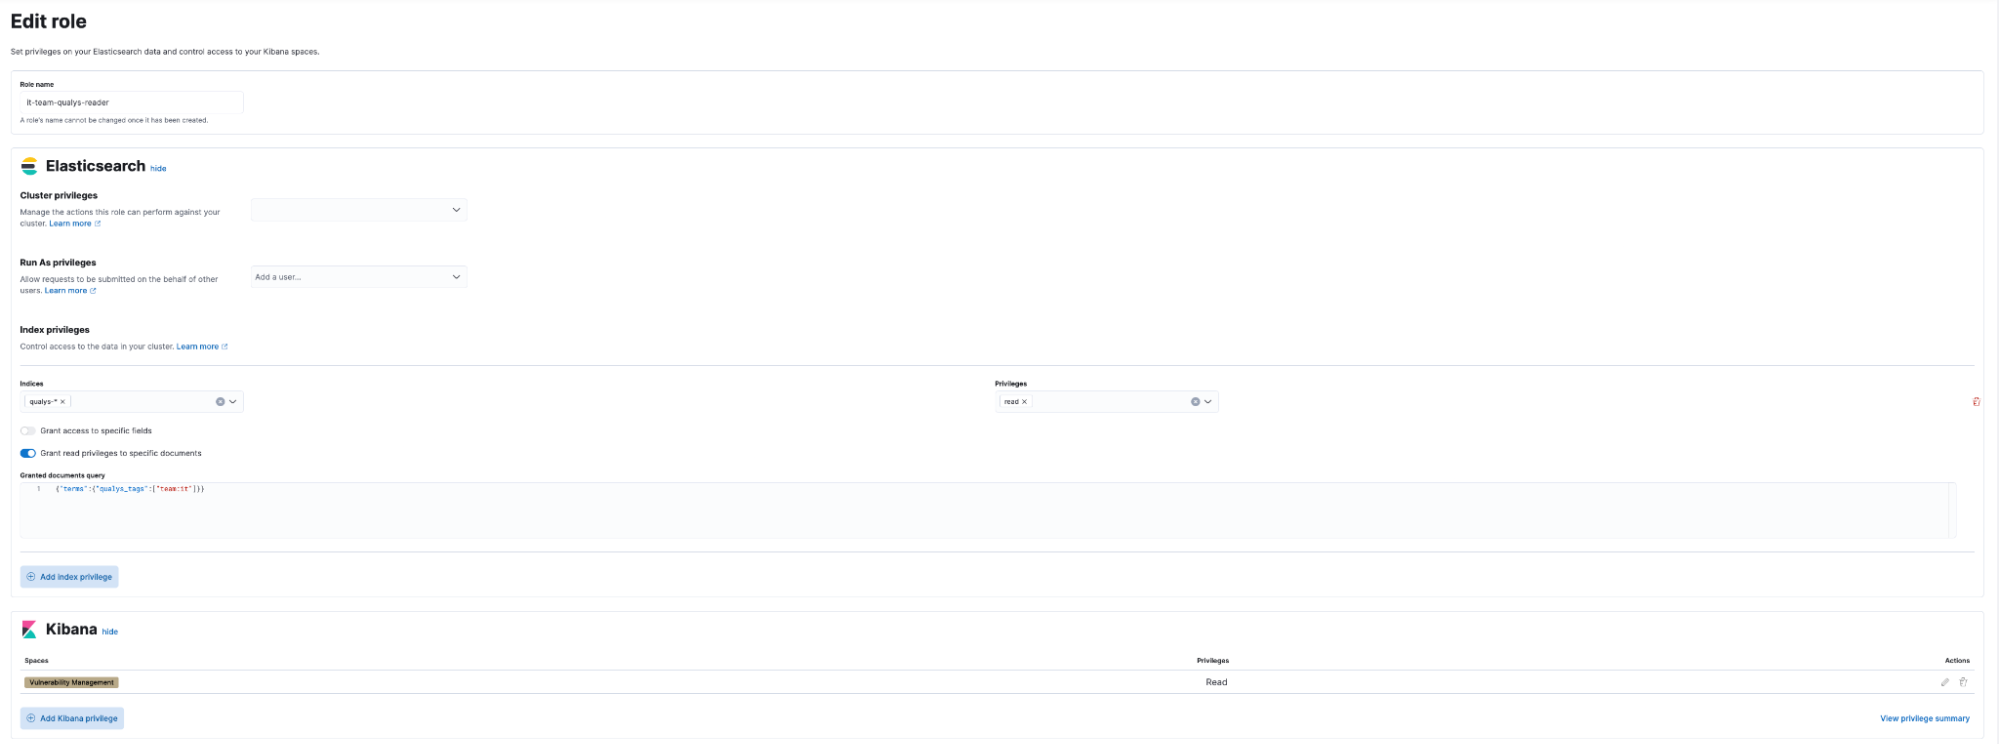
It is also possible to grant access at the dashboard level.
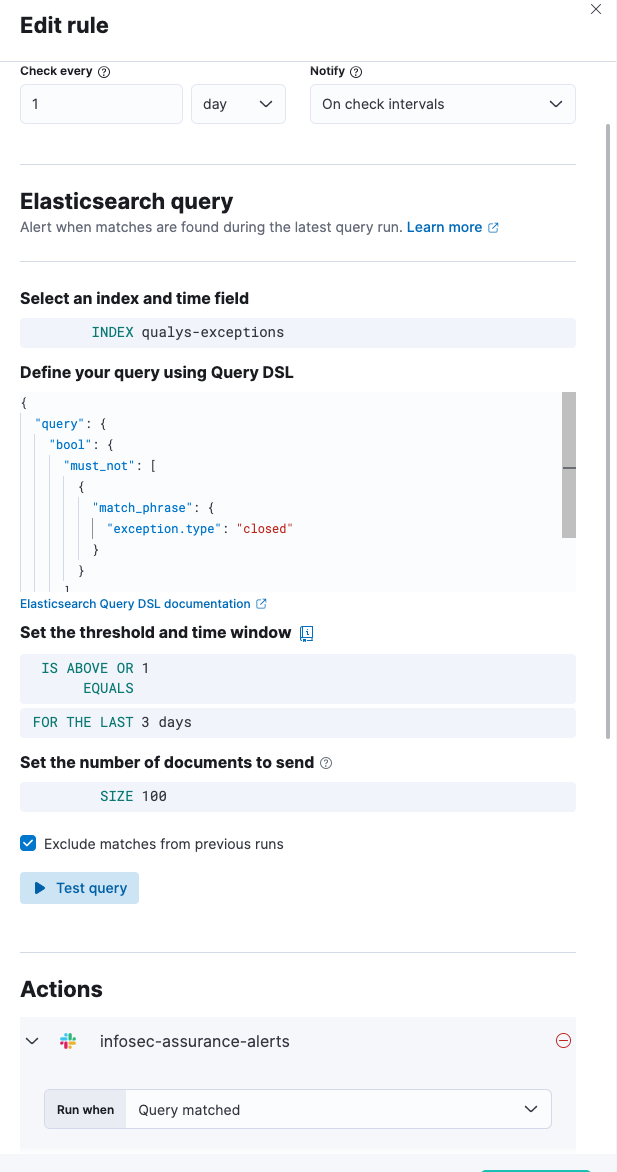
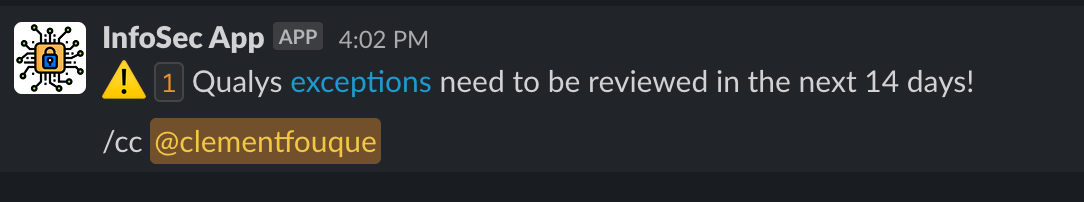
Notifications
Kibana alerting. Implementing alerts is straightforward: we simply write the Elasticsearch query, select the action, and format the message. This is how we are notified of Qualys exceptions that require review.
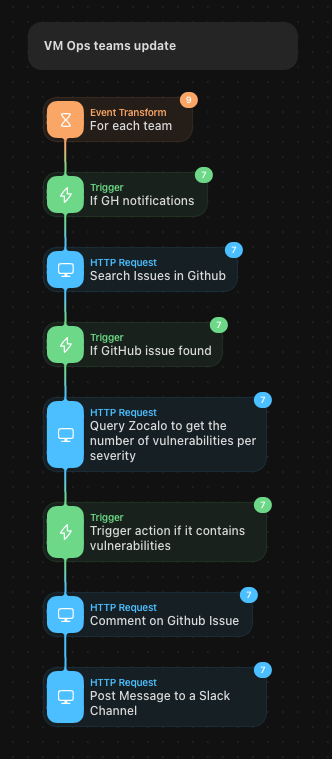
Tines. We use a no-code automation tool designed specifically for security teams, which allows us to create various workflows for tasks such as alerting teams when the Qualys Cloud agent is missing or generating monthly issues and updating teams on a weekly basis.
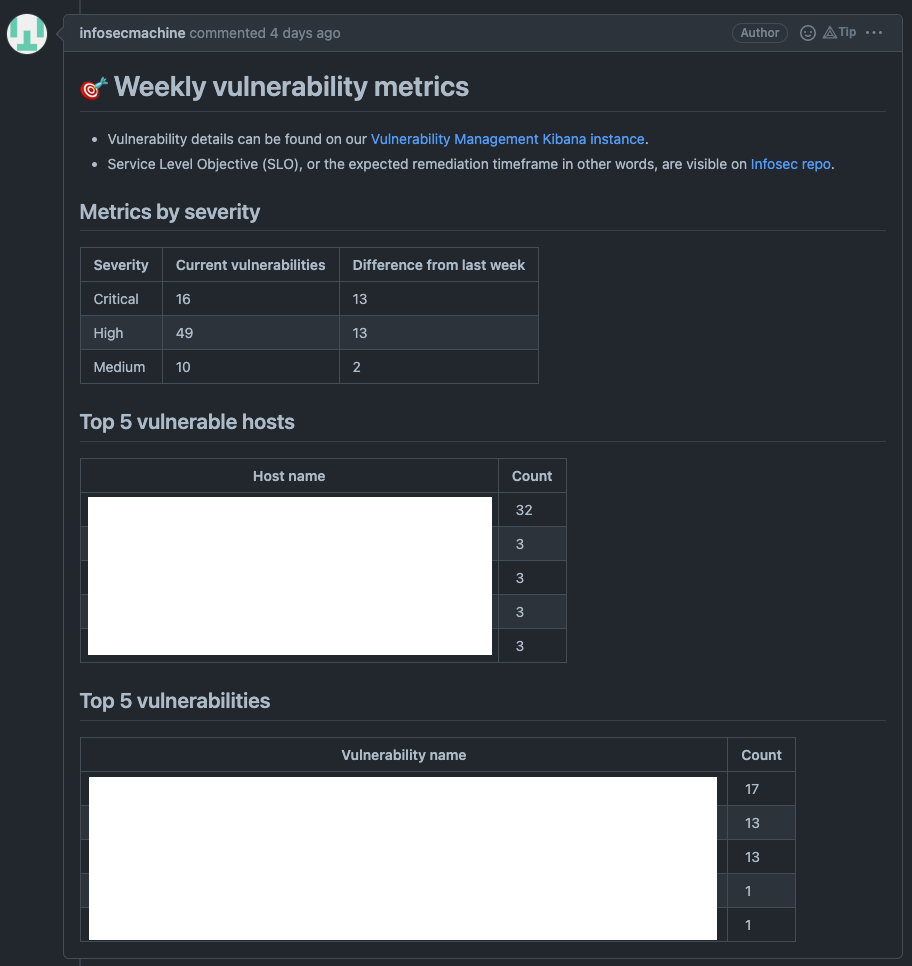
The example below demonstrates how our weekly notification system works. We query Elasticsearch, aggregate the data, and share it with various teams. In the near future, we plan to use this workflow to provide prioritization using a host risk score (calculated from EPSS scoring and asset context). To comply with our certifications, we are and will still rely on CVSS scores.
Configuration management
Managing Qualys "as code" has several benefits:
- Traceability: We can easily track who made a change and when, and why.
- Approval: All modifications to the configuration must be approved by another team member.
- Speed: It is much faster to modify multiple JSON files than to navigate through multiple screens in Qualys.
- Consistency: The risk of misconfiguration is lower compared to manual changes.
The process is straightforward. Configuration files are stored in our InfoSec GitHub repository. When we want to update a configuration, we simply make the necessary changes to the file, have a peer review of the pull request, and a GitHub Action is automatically triggered to push those changes to Qualys Cloud once merged.
Here is an example of a tag:
{
 "ServiceRequest": {
   "data": {
     "Tag": {
       "id": 68075484,
       "parentTagId": 68074273,
       "description": "team:platform:automation",
       "ruleType": "GROOVY",
       "ruleText": "return asset.tags.toString().contains(\"team:platform:automation:\");"
     }
   }
 }
}And the GitHub action:
- name: Update Qualys tags
       if: steps.qualys-tags-changed-files.outputs.any_changed == 'true'
       env:
         QUALYS_USERNAME: ${{ secrets.QUALYS_USERNAME }}
         QUALYS_PASSWORD: ${{ secrets.QUALYS_PASSWORD }}
       run: |
         for file in ${{ steps.qualys-tags-changed-files.outputs.all_changed_files }}; do
           # Only needed for loging purpose
           #CONNECTOR_ID=$(cat $file | jq .ServiceRequest.data.AwsAssetDataConnector.id)
           #echo "Updating connector $CONNECTOR_ID"
           echo " "

           # Call to Qualys AWS connectors API
           curl --request POST 'https://qualysapi.xxx.apps.qualys.com/qps/rest/2.0/update/am/tag' \
             --location \
             --header 'Accept: application/json' \
             --header 'Content-Type: application/json' \
             --silent \
             -u "$QUALYS_USERNAME:$QUALYS_PASSWORD" \
             --data "@$file"

doneWe utilize a similar method to track exceptions on Qualys. As the Qualys exception API is only XML based, we couldn’t use it to push data to both Qualys and elasticsearch. We have created a custom python script that is called when a pull request is merged.
Next steps
We have several ideas for improving this solution:
- Adding context to increase or decrease the asset risk score: we can easily identify private IPs using a simple range processor and use this information to calculate a host risk score (similar to the Kenna Security host risk score calculation)
- Adding vulnerability intelligence sources to gain deeper insights into the exploitation of vulnerabilities
- Utilizing RSS feeds to monitor vulnerabilities in real time (similar to the work of Joey Dreijer)
- Leveraging Kibana drill down to make dashboards interactive
Final thoughts
The Elastic stack is a powerful tool for a vulnerability management program, offering the flexibility we need without the burden of maintaining our own solution or dealing with feature requests with a third-party vulnerability management solution.
You can get started with the Elastic Stack to solve vulnerability management, too. Try Elastic for free as a 14-day trial of Elastic Cloud, and understand why Elastic Stack is a top choice for application search in the most diverse industries.
Share
- Share on Twitter
Share on Twitter
- Share on LinkedIn
Share on LinkedIn
- Share on Facebook
Share on Facebook
- Share by Email
Share by Email
- Print this page
Print