Getting started with the Elastic Stack and Docker Compose: Part 2


 Share on Twitter
Share on Twitter

 Share on LinkedIn
Share on LinkedIn

 Share on Facebook
Share on Facebook

 Share by Email
Share by Email

 Print this page
Print
Welcome to part two of Getting Started with the Elastic® Stack and Docker Compose. In the part one blog, we worked through the basics of Docker Compose and how to stand up a single-node cluster as your local playground, which includes Elasticsearch®, Kibana®, Logstash®, Metricbeat, and Filebeat. If you haven't read the first blog yet, you may want to hop over and read it before continuing.
In this blog, we’ll be building on top of our previous cluster and implementing additional features such as Fleet, Agent, APM, and a demo application for your POC delight! Remember, Docker Compose is not recommended for production, even if the cluster sizing is larger.
Of course, if you’re already familiar and just want to code, feel free to TL;DR to the GitHub repo for the files.
Let’s get started!
Agent, Fleet, APM, oh my!
If you’re unfamiliar with these terms and products, don’t sweat it! Let's start by taking a few minutes to cover what these features are and why they may be useful to you.
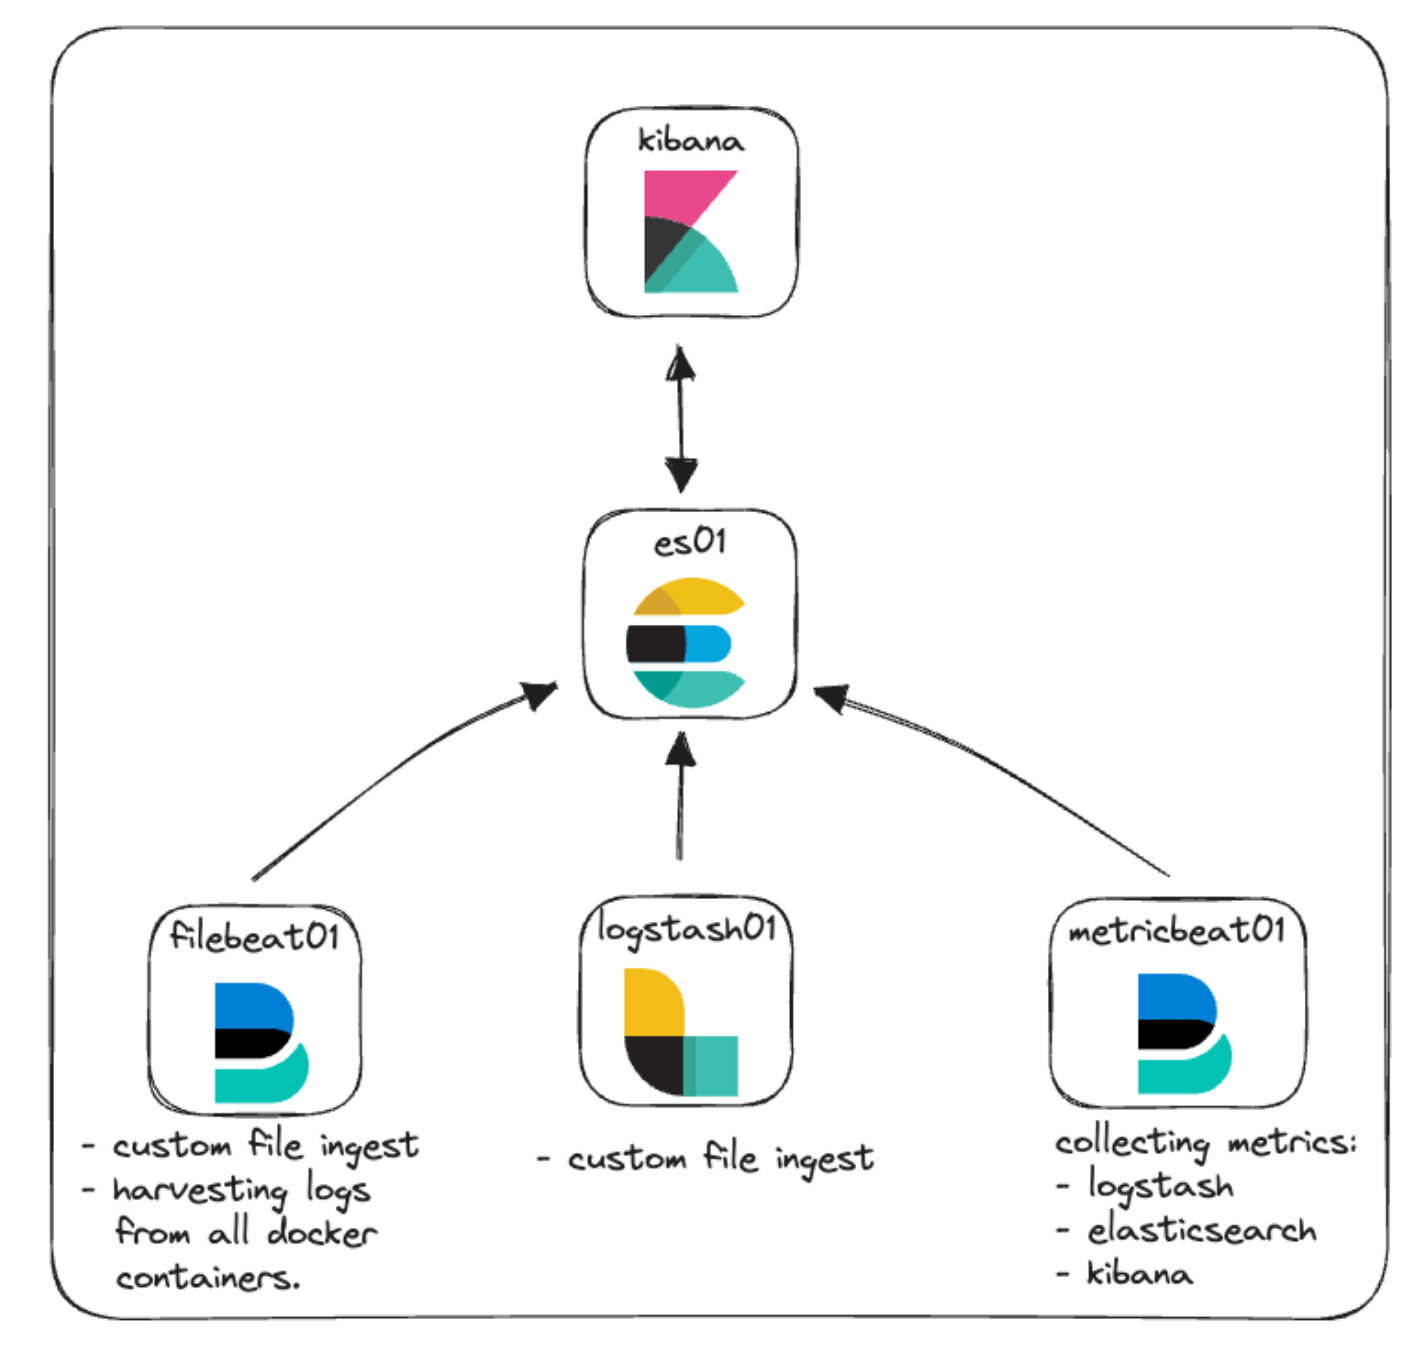
In our original architecture for this cluster, we focused on the basics with some monitoring and file ingestion. Here you can see a representation of that.
Elastic Agent: A quick overview
Let’s start with Elastic Agent and some of the additional terminology that comes with it.
Elastic Agent provides a unified way to enable host monitoring of various data types such as logs, metrics, and other data. Additionally, it offers protection from security threats, operating system data querying, remote service or hardware data forwarding, and more. Agent streamlines and accelerates monitoring deployments across your infrastructure. Each agent is associated with policies that can be updated to incorporate integrations for new data sources, security measures, and additional functionalities.
Elastic Integrations are designed to enable you to quickly and easily collect data from external sources to gain insight. These integrations often use pre-built settings, dashboards, visualizations, and pipelines to help make sense of metrics, logs, and events. The Integrations page can be found in your local Kibana instance, making it easy to browse, install, and configure integrations in conjunction with Elastic Agent and their policies. You can also see a list of available integrations on the Elastic website.
Policies are collections of settings and integrations that define how an Elastic Agent will function. Multiple integrations can be assigned to an Agent Policy allowing flexibility in what data agents are able to capture. Assigning an Elastic Agent Policy to multiple agents allows you to manage and configure many agents at a greater scale with the use of Fleet.
Fleet is the user interface within Kibana that allows for centralized management of the Elastic Agents and associated policies. This user interface gives you the ability to see the health of each Agent, the installed version, the last check-in or activity time, and policy information. The communication to each of the Elastic Agents is facilitated by Fleet via Fleet Server. This allows for remotely pushing out new policy updates upon check-in as well as upgrading the Agent binaries or integrations.
Fleet Server is an instance of Elastic Agent that is running as the coordinator of communication between Fleet and all the deployed Elastic Agents.
*whew*
Check out Elastic’s documentation to read more about all of these topics relating to Agent and Fleet.
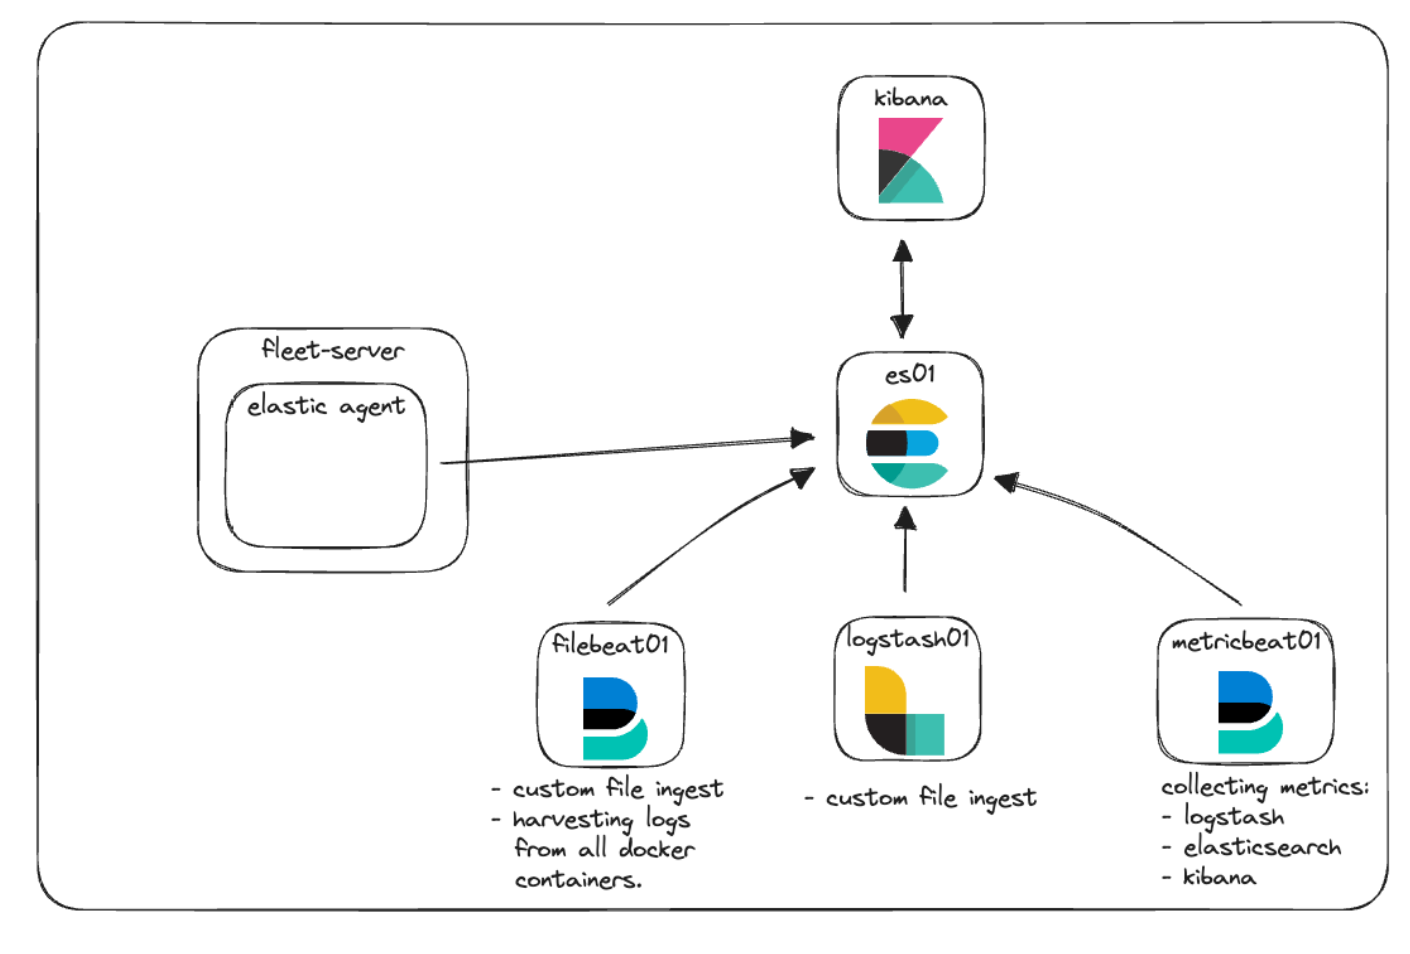
We’ll be integrating Elastic Agent and Fleet to provide a demonstration of how logs and metrics can be collected along with managing policies. Let's add it to our architecture diagram to see how this will look.
Elastic APM and custom web app
Elastic APM is an application performance monitor built on the Elastic Stack. Using Elastic APM Agents to instrument your code can help simplify troubleshooting and performance questions by gathering metrics, traces, logs, errors, and exceptions and shipping them into Elasticsearch for visibility in the APM user interface.
Elastic APM can be set up in the cloud or locally self-managed. When managing a local instance of APM, you can choose to manage a standalone APM Server binary or utilize APM as an integration via Elastic Agent.
For our local POC, we’ll implement Elastic APM managed by Elastic Agent and Fleet services.
The ability to monitor application performance doesn’t do much good if you don't have an application to monitor. Ideally, you already have some code you would like to instrument using one of our APM Agents. If not, the GitHub repo has a small Python application that we’ll stand up to do some basic testing.
New architecture
Let's take a look at our architecture diagram again and see how everything fits into place.
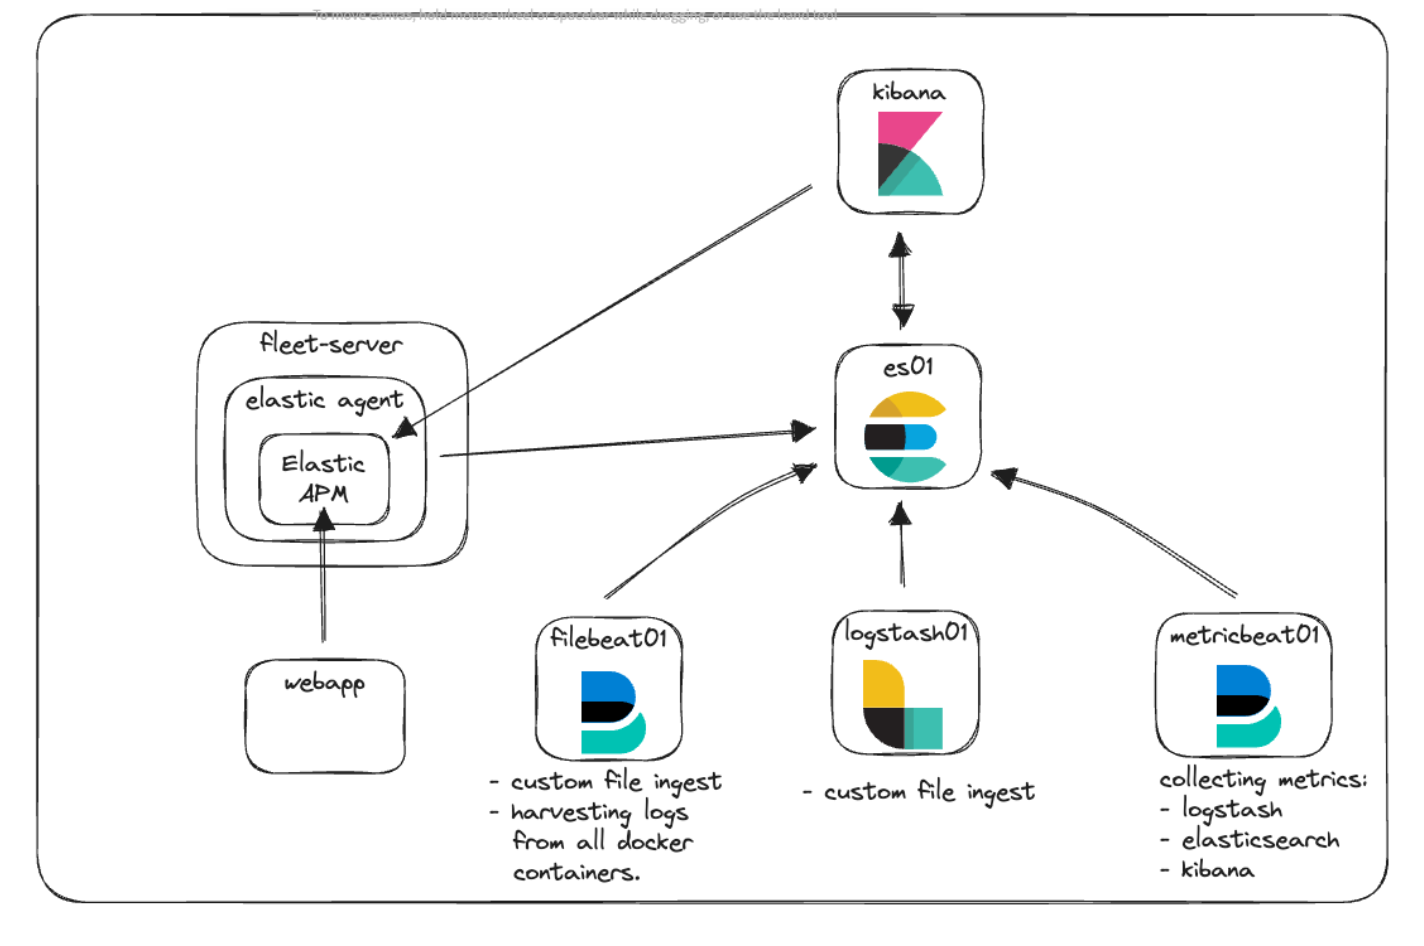
Here you can see we have the new Fleet-Server container, which is running the Elastic Agent to act as the central communication point for all agent communications with the Elastic cluster. The Elastic Agent is running the Elastic APM integration in order to collect telemetry information from both our custom web application and Kibana.
Communication and access
Many of the common challenges that arise when getting started with Docker in general is understanding how communications work. With all the containers, ports, certificates, and URLs that have been mentioned, let’s take a step back and see how this new architecture looks when the different pieces need to talk to one another.
Within our docker-compose.yml file, you have seen the code that we use to generate certificates for the different containers. It looks something like this:
echo "Creating certs";
echo -ne \
"instances:\n"\
"  - name: es01\n"\
"    dns:\n"\
"       - es01\n"\
"       - localhost\n"\
"    ip:\n"\
"      - 127.0.0.1\n"\
"  - name: kibana\n"\
"    dns:\n"\
"      - kibana\n"\
"      - localhost\n"\
"    ip:\n"\
"      - 127.0.0.1\n"\
"  - name: fleet-server\n"\
"    dns:\n"\
"      - fleet-server\n"\
"      - localhost\n"\
"    ip:\n"\
"      - 127.0.0.1\n"\
> config/certs/instances.yml;This block of code is creating a file called instances.yml that resides in the “setup” container, which is a list of all of the container’s names along with their DNS entries as they relate to each other within the Docker Engine. We use this file in conjunction with the elasticsearch-certutil utility to create a certificate for each container in order to secure communication between the containers when they communicate and when you communicate with them.
All of our containers communicate with each other using the default network we set in docker-compose.yml like this:
networks:
  default:
name: elasticThis network is internal to the Docker Engine and allows all the containers to talk to each other and resolve other containers’ names. In order to allow traffic from your browser to reach the container, we expose the necessary ports in each service. For example:
es01:
  depends_on:
    setup:
      condition: service_healthy
  image: docker.elastic.co/elasticsearch/elasticsearch:${STACK_VERSION}
  labels:
    co.elastic.logs/module: elasticsearch
  volumes:
    - certs:/usr/share/elasticsearch/config/certs
    - esdata01:/usr/share/elasticsearch/data
  ports:
    - ${ES_PORT}:9200
  environment:
    - node.name=es01
    - cluster.name=${CLUSTER_NAME}
    - discovery.type=single-node
...Specifically, we’re looking at the “ports:” section. This is telling Docker Compose to map the ports specified with the format of “host:container”. In this example, `${ES_PORT}` would be replaced with 9200 from our .env file and this would be opened on your computer (host). The second 9200 represents the port on the container to which we map our host. In this way, when you access https://localhost:9200 from your browser, your traffic will be sent to the es01 container.
Elasticsearch, by default, opens port 9300 as well for internode communication. While the other containers in your Docker engine will be able to access that port if necessary, you will not be able to from your host because we haven’t exposed that port.
If we were to try and visualize these concepts using our new architecture, it could look like this:
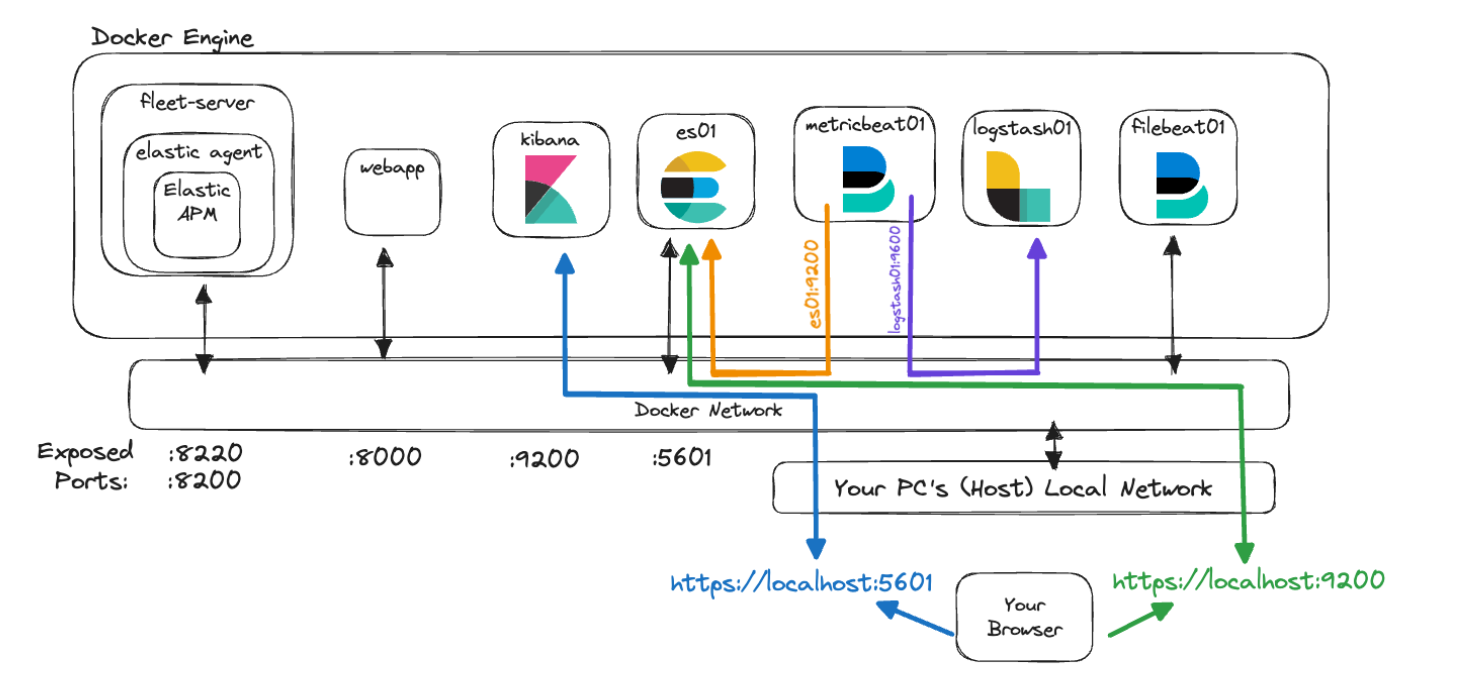
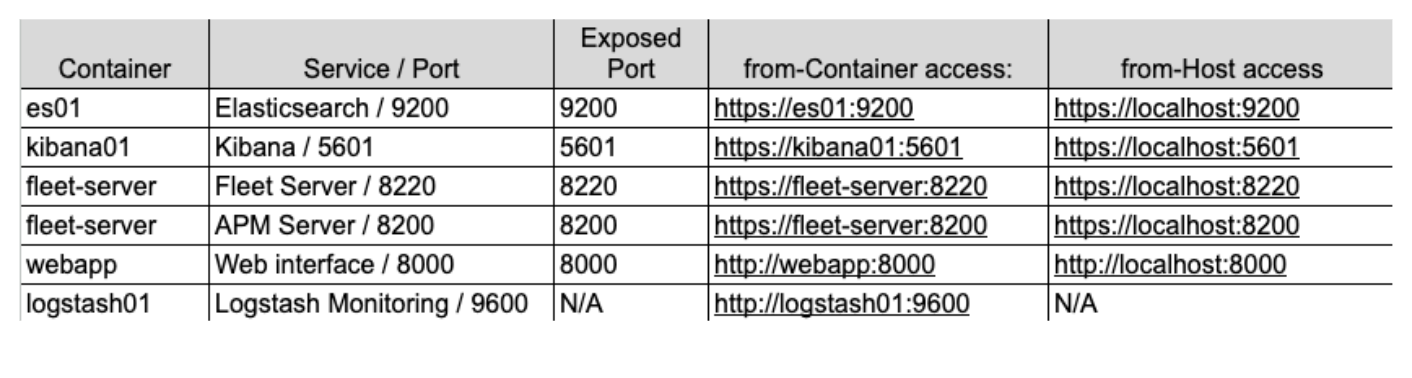
In this graphic, the container metricbeat01 is able to resolve the names we have given to “es01” and “logstash01” and even access the unexposed monitoring port of 9600 on “logstash01” because they reside in the same Docker network.
However, we can see that in order for you to reach Elasticsearch on 9200 and Kibana on 5601, you will need to access “localhost” so that your machine can route the traffic into the Docker network and to the correct containers.
Lastly, deciding which address to use when referencing one of these services can be tricky. The key to remember is that when one of your containers is accessing another container that’s been configured with the Elastic network, then use the proper service/container name. But, if traffic originating from your host machine is accessing one of the containers, then you will need to verify that the correct port is exposed in docker-compose.yml and access that port via localhost.
Please also note that these configurations are ways to get started with local development, but they are not recommended to be used in production environments.
Implementation
So, how do we implement all of this?
First, we’ll do a quick review of our base stack and highlight a couple of changes, starting with our file structure, .env file, and the docker-compose.yml
File structure
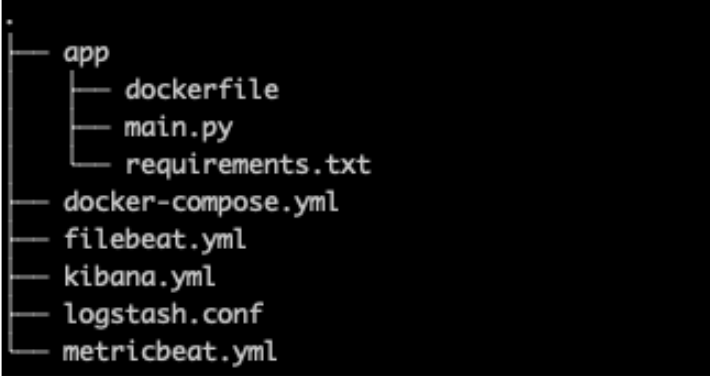
For our file structure, we’ve added the “app” folder to hold all the code and configuration for our custom web app alongside a new kibana.yml because we’ll be adding more specific settings relating to both Elastic Agent and APM.
.env
Our .env file (GitHub link) remains mostly unchanged with the exceptions of new ports for Fleet, APM Server, and an APM secret token as seen below.
The secret token will be used later in our implementation to authorize requests to the APM Server. You can read more about them in the documentation.
# Port to expose Fleet to the host
FLEET_PORT=8220


# Port to expose APM to the host
APMSERVER_PORT=8200


# APM Secret Token for POC environments only
ELASTIC_APM_SECRET_TOKEN=supersecrettokenPlease remember that any passwords or keys listed in this blog are for demonstration purposes and should be changed immediately in your environments.
docker-compose.yml
For our docker-compose.yml file, we have a few additions to the base stack — namely, containers for “Fleet Server” and “webapp” including adding additional volumes and adding fleet-server to our server list for certificate generation as mentioned above.
You can find the whole file on GitHub, but we’ll cover just a few of the edits.
A note on environment variables
There are a number of environment variables in existing services where certificates have been specified and passed through to the container or their corresponding configuration file.
Much like our .env file, environment variables in docker-compose.yml allow us to pass variables to our containers. In this way, we set the variable CA_CERT equal to the certificate path one time on our container, and then within the metricbeat.yml file, we can now use that variable wherever needed. If we needed to update the CA_CERT for example, we would only need to update the path one time in docker-compose.yml and then redeploy the metricbeat container.
The metricbeat01 container and metricbeat.yml file are good examples of passing the CA_CERT environment variable and using it several times in the yml file.
Read more about setting and using environment variables.
docker-compose.yml (fleet-server container)
Adding a fleet-server container into the docker-compose.yml file (GitHub link) stands up an additional container pulling the Elastic Agent image. The agent image is used for both edge data collection as well as the base image used to configure the Fleet management server as well.
Please keep in mind that we are using some additional flags to lessen how strict the certificate checks are since this is a local POC. In a production environment, you will want to have all certificates properly issued and verified.
As mentioned above, we’re exposing two ports for communications.
ports:
  - ${FLEET_PORT}:8220
- ${APMSERVER_PORT}:8200- 8220 handles all traffic destined for Agent/Fleet communications.
- 8200 handles all traffic that will be utilized by the APM server since our Agent is housing the APM integration.
A couple of the key environment configurations here:
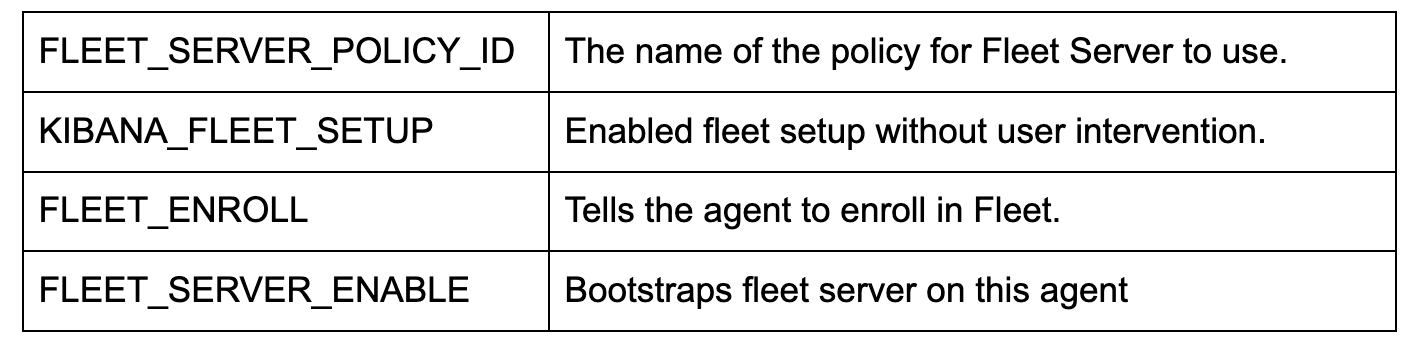
Note: If you want to also configure and run Synthetic tests, then you will need to use the Docker image of docker.elastic.co/beats/elastic-agent-complete:${STACK_VERSION} instead. We will not be covering this portion, but you can read more about it in our documentation.
docker-compose.yml (kibana container)
Two changes are required to the kibana container (GitHub link). The first is the very important connection between the docker-compose.yml and the kibana.yml file in the "volumes" section. This line tells Docker to “bind mount” the local kibana.yml file into the container to utilize.
- ./kibana.yml:/usr/share/kibana/config/kibana.yml:roNext, a simple change was added to the bottom of the environment variables, which allows us to pass through the APM secret token that we originally set in the .env file.
- ELASTIC_APM_SECRET_TOKEN=${ELASTIC_APM_SECRET_TOKEN}kibana.yml
We’re adding a new yml file for configuring Kibana in order to incorporate Fleet and Agent (GitHub link).
Notably, xpack.fleet.packages allows us to specify that packages will automatically pull in their assets:
xpack.fleet.packages:
  - name: fleet_server
    version: latest
  - name: system
...While xpack.fleet.agentPolicies allows for the definition of the base policies to be used for the initial Fleet and Agent:
xpack.fleet.agentPolicies:
  - name: Fleet-Server-Policy
    id: fleet-server-policy
    namespace: default
    monitoring_enabled:
      - logs
      - metrics
...You can read more about configuring policies without the UI in our documentation.
We are also adding a policy to support Elastic APM as well as the associated APM package assets:
- name: apm-1
        package:
          name: apm
        inputs:
        - type: apm
          enabled: true
          vars:
          - name: host
            value: 0.0.0.0:8200
          - name: secret_token
value: ${ELASTIC_APM_SECRET_TOKEN}We set the server URL and the secret_token in order to make sure our applications can communicate properly.
One bonus is telemetry.enabled: "true" which allows us to run Elastic APM against our own Kibana instance to see additional usage of how APM works.
docker-compose.yml (webapp container)
 webapp:
    build:
      context: app
    volumes:
      - "/var/lib/docker/containers:/var/lib/docker/containers:ro"
      - "/var/run/docker.sock:/var/run/docker.sock:ro"
      - "/sys/fs/cgroup:/hostfs/sys/fs/cgroup:ro"
      - "/proc:/hostfs/proc:ro"
      - "/:/hostfs:ro"
    ports:
- 8000:8000For our sample webapp, we’re using a dockerfile to help us build our application and deploy in Docker.
This container configuration relies heavily on the context: app build command. Docker is making the assumption that “app” is a folder and inside that folder is our Dockerfile. These attributes can be more specific, but for our purposes, the default assumptions are perfectly fine.
When Docker Compose builds this container, it will read into the “app” folder and grab the Dockerfile for instructions on how to build the image to use in the container.
We’re also specifying that we want to expose port 8000, as well as passing in some “volumes” similar to what Metricbeat has available in order to monitor resources.
app/dockerfile
# syntax=docker/dockerfile:1


FROM python:3.9-slim-buster


WORKDIR /app


COPY requirements.txt requirements.txt


RUN pip3 install -r requirements.txt


COPY main.py main.py


CMD ["uvicorn", "main:app", "--host", "0.0.0.0", "--port", "8000", "--log-level", "info", "--workers", "1"]Our dockerfile will now use the “python:3.9-slim-buster” image as its base to pull. From there, it will create the /app folder, copy the requirements.txt file from our location, and then install the requirements via pip3.
Afterward, it will copy our main.py application and then attempt to run the Uvicorn application, which is built in main.py.
Note: Order of operations matters in a dockerfile for caching purposes. If you change any of the files that are called out in the docker file, then the cache will be discarded and a new pull of the file will happen. Typically, you want to place your most frequently changing files later in the dockerfile so that slower or non-changing files can remain cached for the build process.
app/main.py
The main.py application (GitHub) is a very simple application combining FastAPI and NiceGUI. The main application has been instrumented with the Starlette Elastic APM Agent, and a few buttons allow for making calls that will purposefully throw errors and messages at our APM environment.
Python:
from elasticapm.contrib.starlette import ElasticAPM, make_apm_client

apm = make_apm_client({
      'SERVICE_NAME': 'my_python_service',
      'SECRET_TOKEN': 'supersecrettoken',
      'SERVER_URL': 'http://fleet-server:8200',
      'ENVIRONMENT': 'development'
  })

app = FastAPI()
app.add_middleware(ElasticAPM, client=apm)

apm.capture_message(f"Custom Message: {message}")

@app.get("/error")
async def throw_error():
    try:
        1 / 0
    except Exception as e:
        apm.capture_exception()
return {"message": "Failed Successfully :)"}Above are snippets out of the code where we can see we’re importing the APM library, creating the APM client, and adding the middleware to our FastAPI application.
This application is meant only as a sample of how to interact with Elastic APM.
Docker Compose up
Now that we have everything configured, let’s bring up the cluster!
Running the command docker compose up will bring all the containers up and allow you to log in to Kibana at https://localhost:5601. Remember, since we have certificates in place now for Kibana, we’ll have to use HTTPS, so you may have to click any certificate warnings your browser gives you.
Upon login, you can navigate to Fleet via the Hamburger menu -> Management -> Fleet.
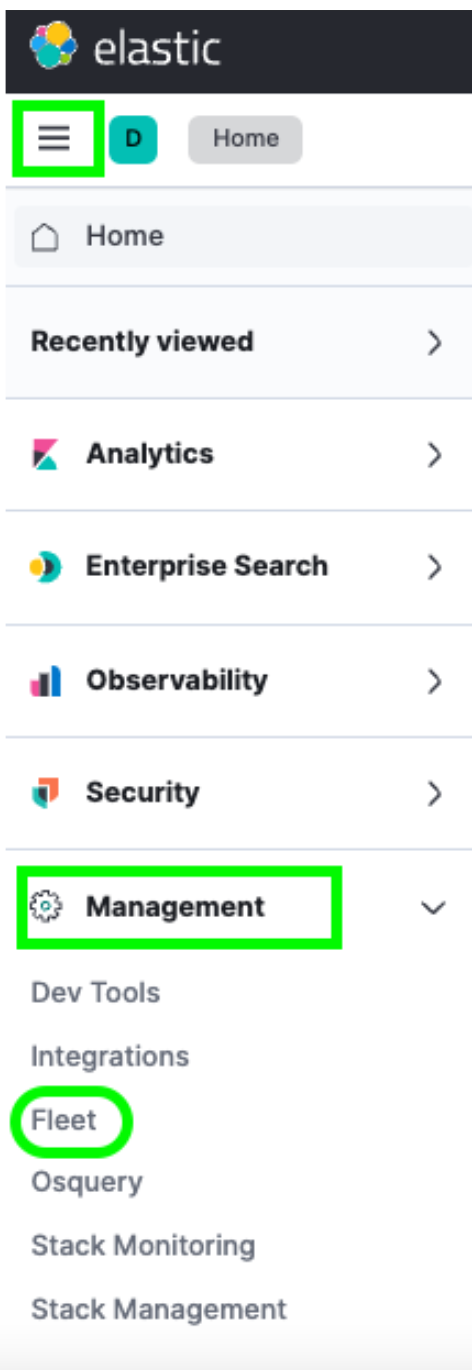
Once there, you will see a single Host under the Agents menu. This Fleet page is where you can check in on any and all Agents you have enrolled into your cluster. You can also create or change policies, enroll new Agents, and update any global Fleet configurations.
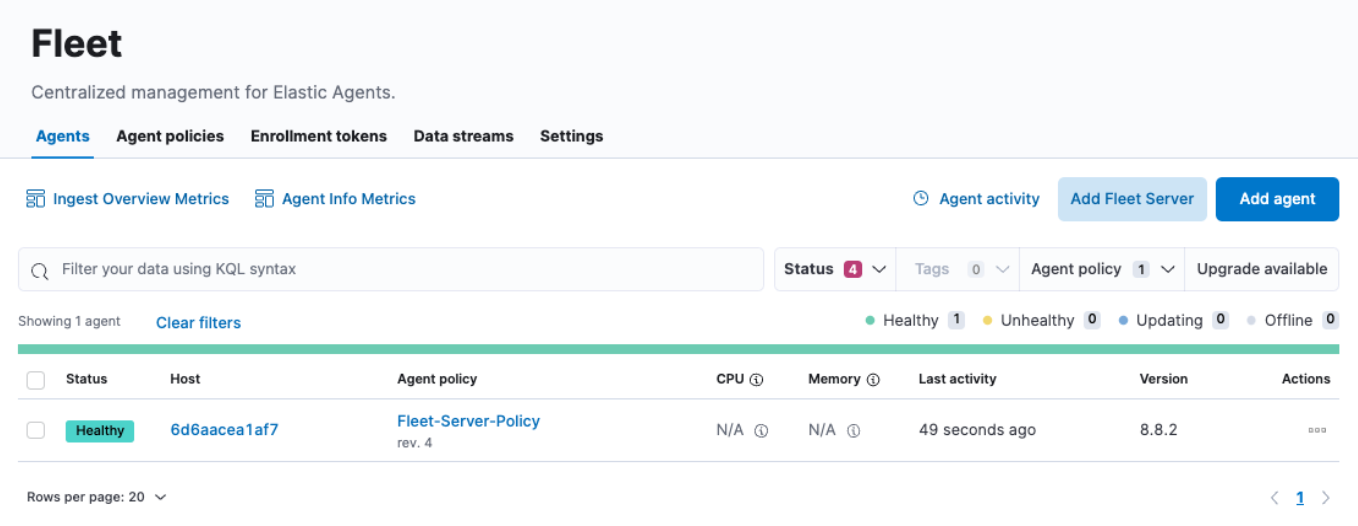
However, you may notice that the CPU and Memory usage fields are not being updated. Likewise, if you click on the Host link, it looks like the logs are not being populated either. Upon further investigation, we see errors in our fleet-server container logs similar to:
{"log.level":"info","message":"Attempting to reconnect to backoff(elasticsearch(http://localhost:9200)) with 17 reconnect attempt(s)","component":{"binary":"metricbeat","dataset":"elastic_agent.metricbeat","id":"http/metrics-monitoring","type":"http/metrics"},"log":{"source":"http/metrics-monitoring"},"log.origin":{"file.line":139,"file.name":"pipeline/client_worker.go"},"service.name":"metricbeat","ecs.version":"1.6.0","log.logger":"publisher_pipeline_output","ecs.version":"1.6.0"}
{"log.level":"error","message":"Error dialing dial tcp 127.0.0.1:9200: connect: connection refused","component":{"binary":"metricbeat","dataset":"elastic_agent.metricbeat","id":"http/metrics-monitoring","type":"http/metrics"},"log":{"source":"http/metrics-monitoring"},"service.name":"metricbeat","ecs.version":"1.6.0","log.logger":"esclientleg","log.origin":{"file.line":38,"file.name":"transport/logging.go"},"network":"tcp","address":"localhost:9200","ecs.version":"1.6.0"}This is because, by default, our Elastic Agent is attempting to log data to a local Elasticsearch instance, which is not correct for our Docker environment.
We will need to perform a couple of updates in the Fleet -> Settings UI in order to resolve this.
Let’s take a look.
Reconfigure output, add certificate
After navigating to Fleet -> Settings, we’ll want to look at the Outputs section and click on the Edit button under the Actions header:
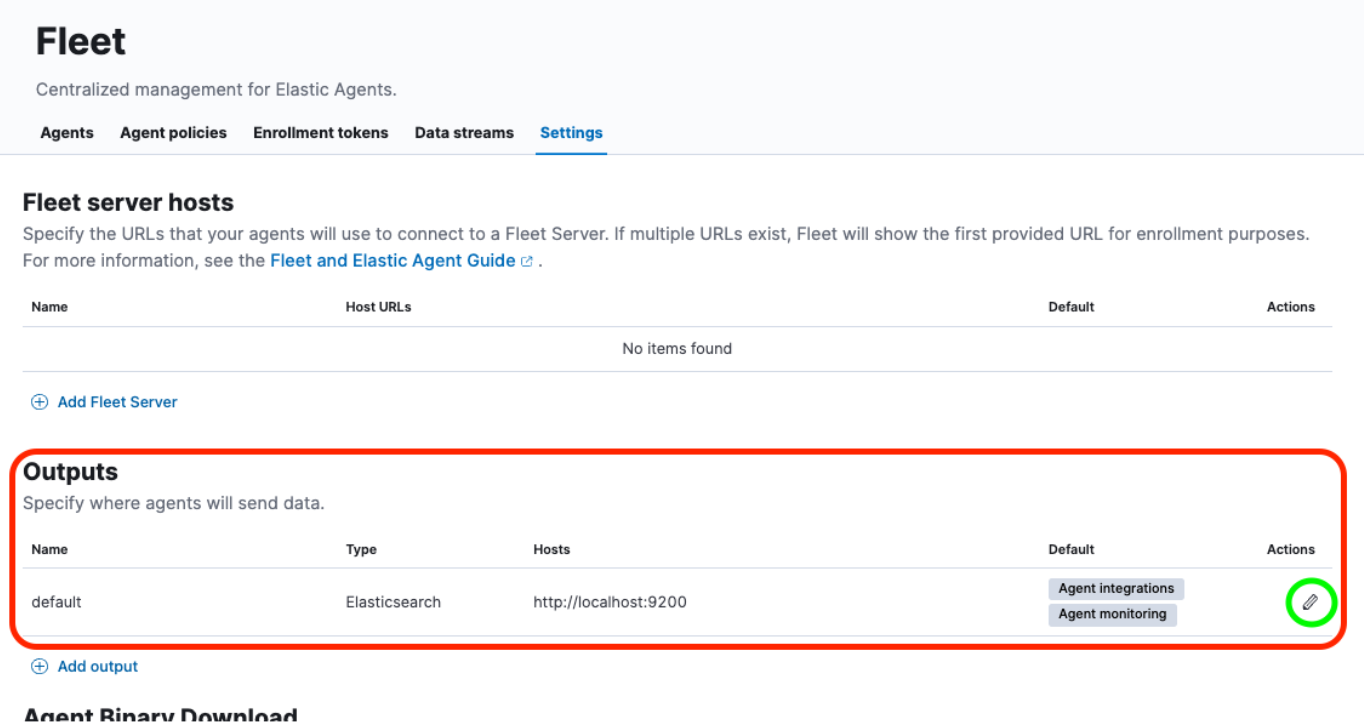
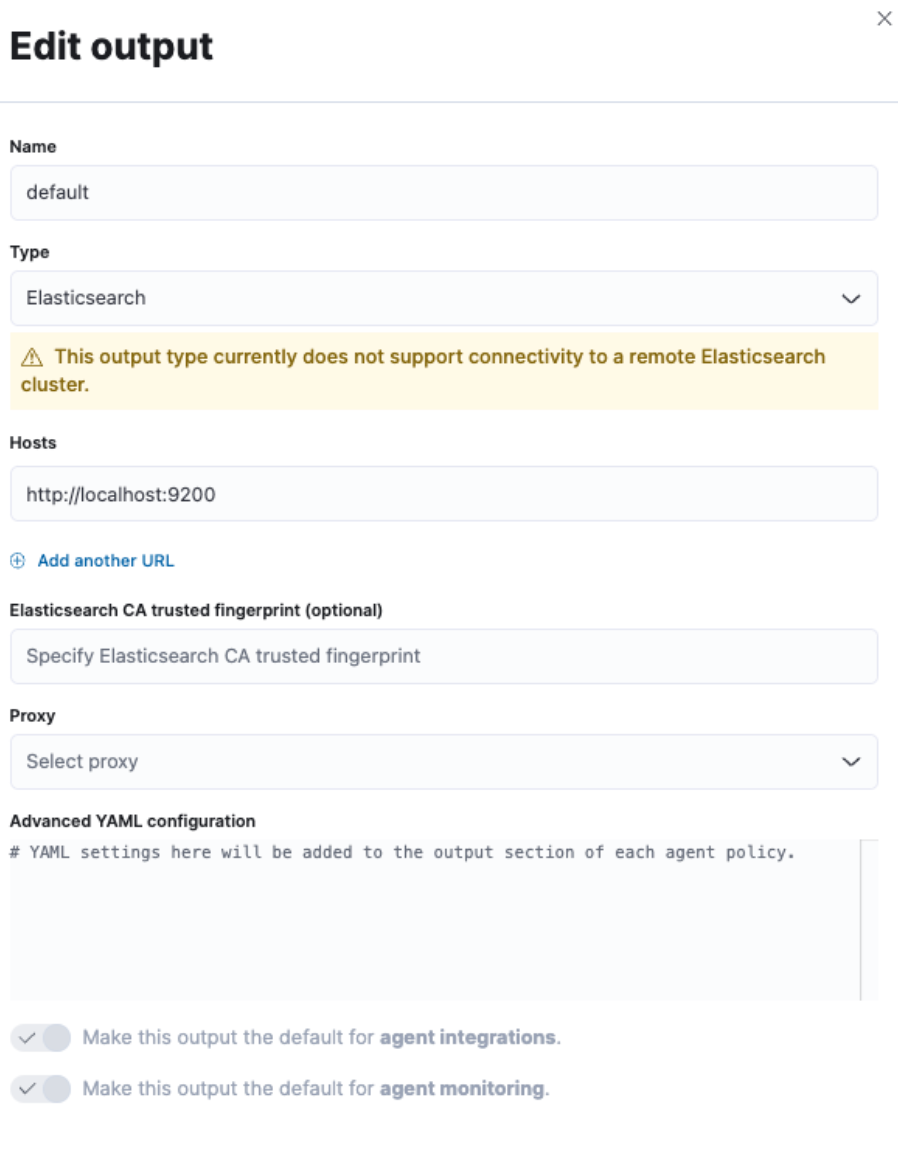
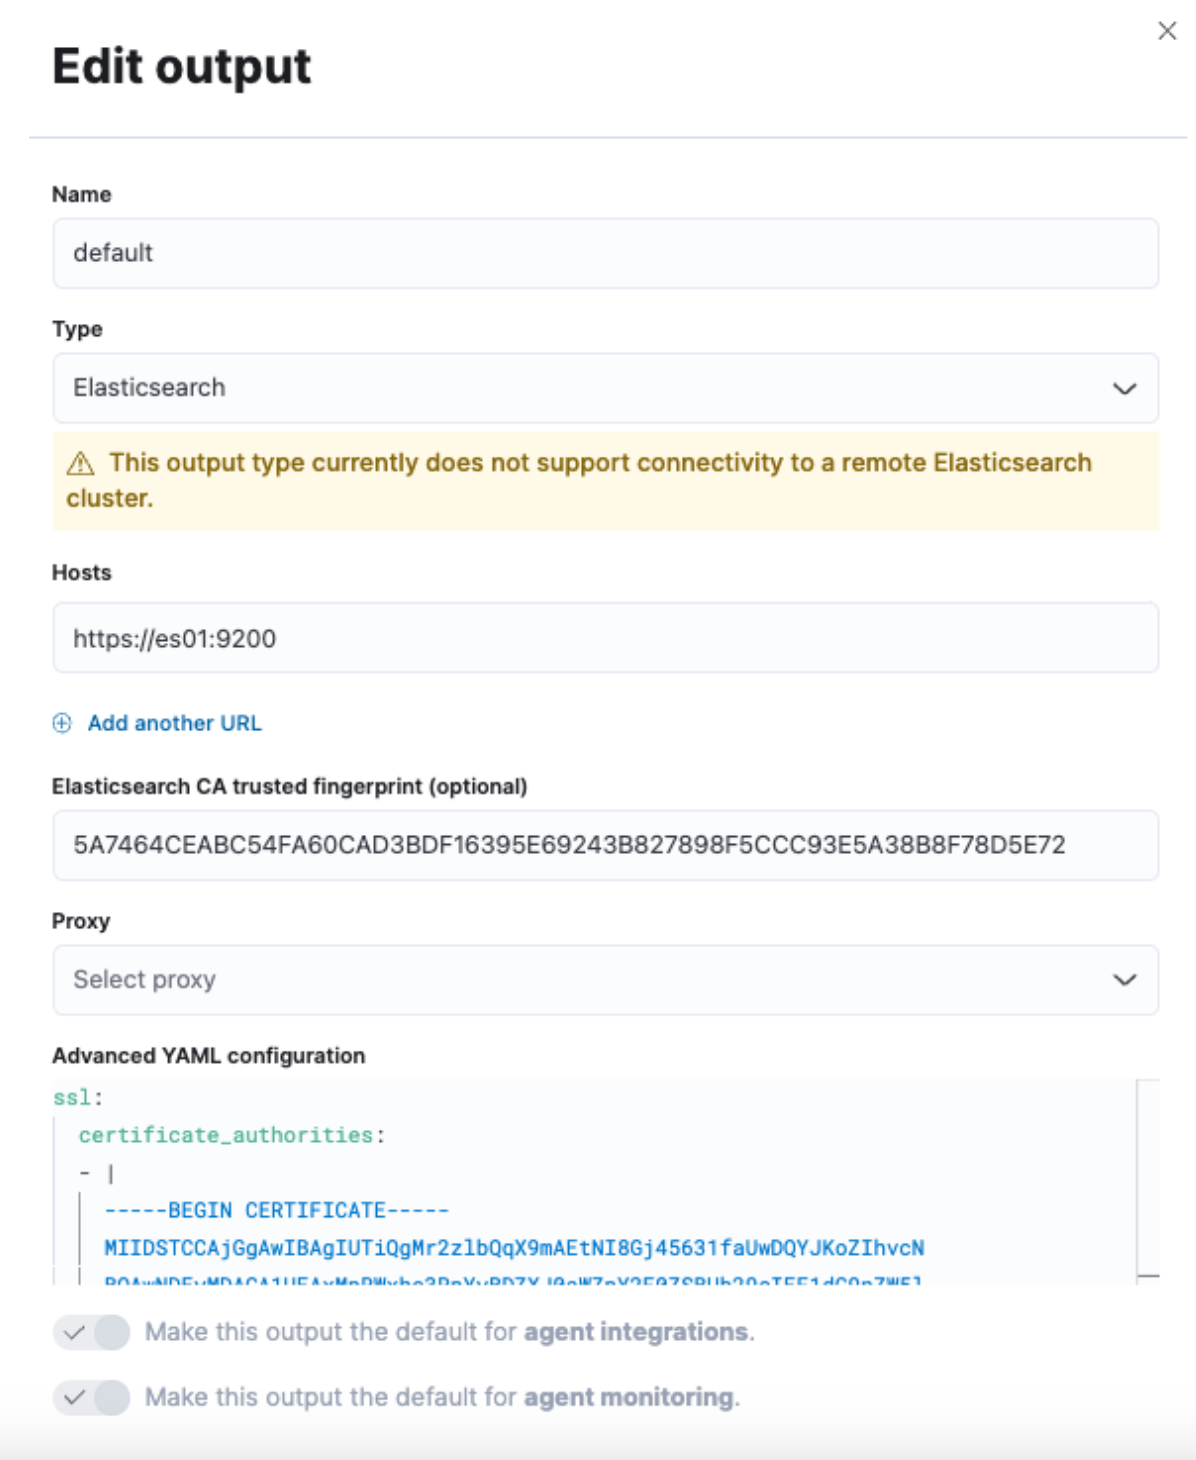
This will provide us with a slide-out from the right-hand side of the interface in order to modify the default output.
We’ll want to change the “Hosts” field along with the “Elasticsearch CA trusted fingerprint” field, as well as a change to the “Advanced YAML configuration” section.
However, we don't have all that information yet. So let's jump into a terminal and grab it.
First, we’ll need to pull the CA certificate from the cluster. This will be the same command we used in Part One:
docker cp es-cluster-es01-1:/usr/share/elasticsearch/config/certs/ca/ca.crt /tmp/.
Note: This command will be different based on either the directory you’re running the docker-compose.yml file from or the COMPOSE_PROJECT_NAME variable that is specified in the .env file.
Next, we will need to get the fingerprint of the certificate. For this, we can use an OpenSSL command:
openssl x509 -fingerprint -sha256 -noout -in /tmp/ca.crt | awk -F"=" {' print $2 '} | sed s/://g
This will produce a value similar to:
5A7464CEABC54FA60CAD3BDF16395E69243B827898F5CCC93E5A38B8F78D5E72
Finally, we need to get the whole cert into a yml format. We can do this with a cat command or just by opening the cert in a text editor:
cat /tmp/ca.crt
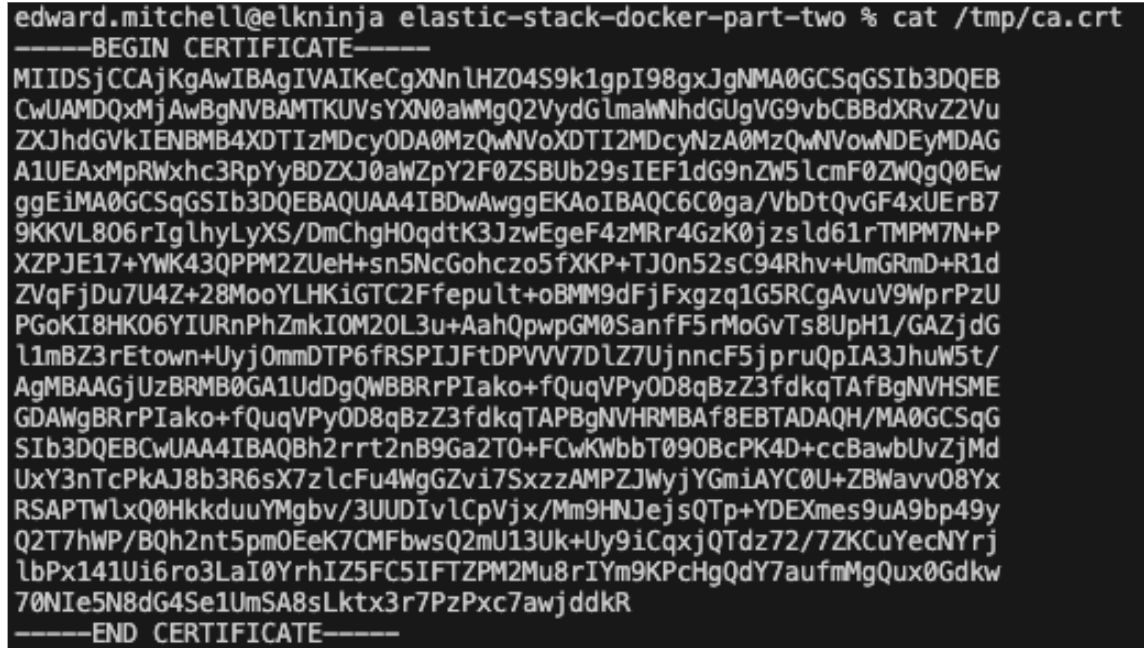
Once you have the certificate text, we will add it to a yml format and input all this information into the Fleet Settings screen from earlier.
For “Hosts,” we will want to use “https://es01:9200”. This is because the container that hosts the Fleet server understands how to communicate with the es01 container to send data.
Input the fingerprint that was produced for the field “Elasticsearch CA trusted fingerprint.”
Finally, add the certificate text to the “Advanced YAML configuration.” Since this is a yml configuration, it will throw an error if not spaced correctly.
Start with:
ssl:
certificate_authorities:
- |
And then paste the certificate text, making sure the indentation is correct.
Example:
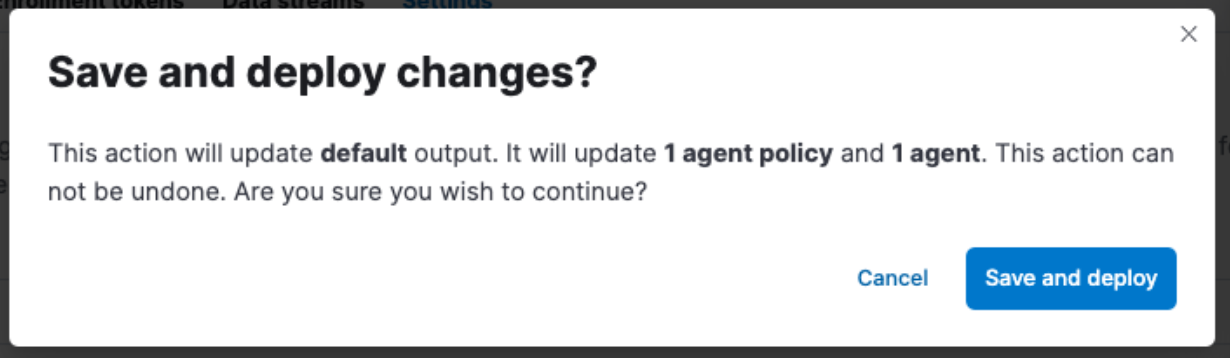
Don't forget to click “Save and Apply Settings” -> “Save and Deploy.”
Reviewing Elastic Agent data
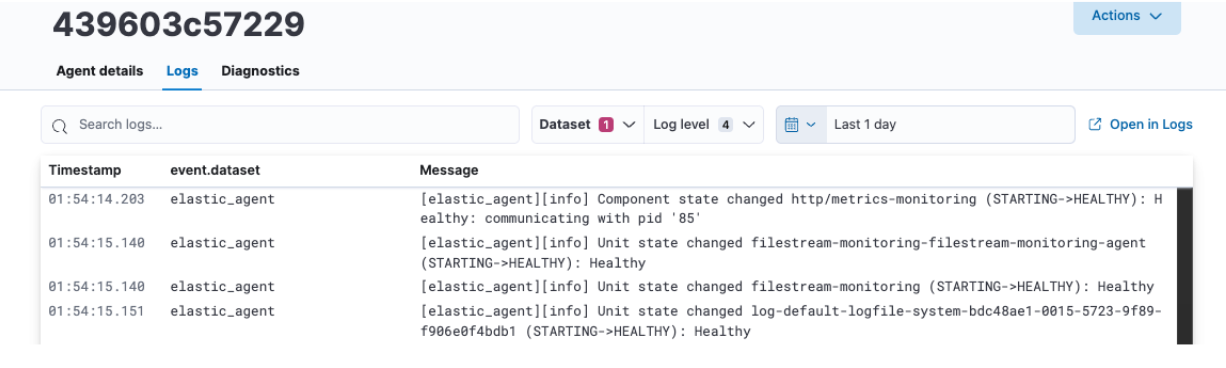
Once the Save and Deploy is complete, head back to the Agent tab, click on your agent name, and you should see CPU and Memory utilization properly displayed, as well as Logs being populated.
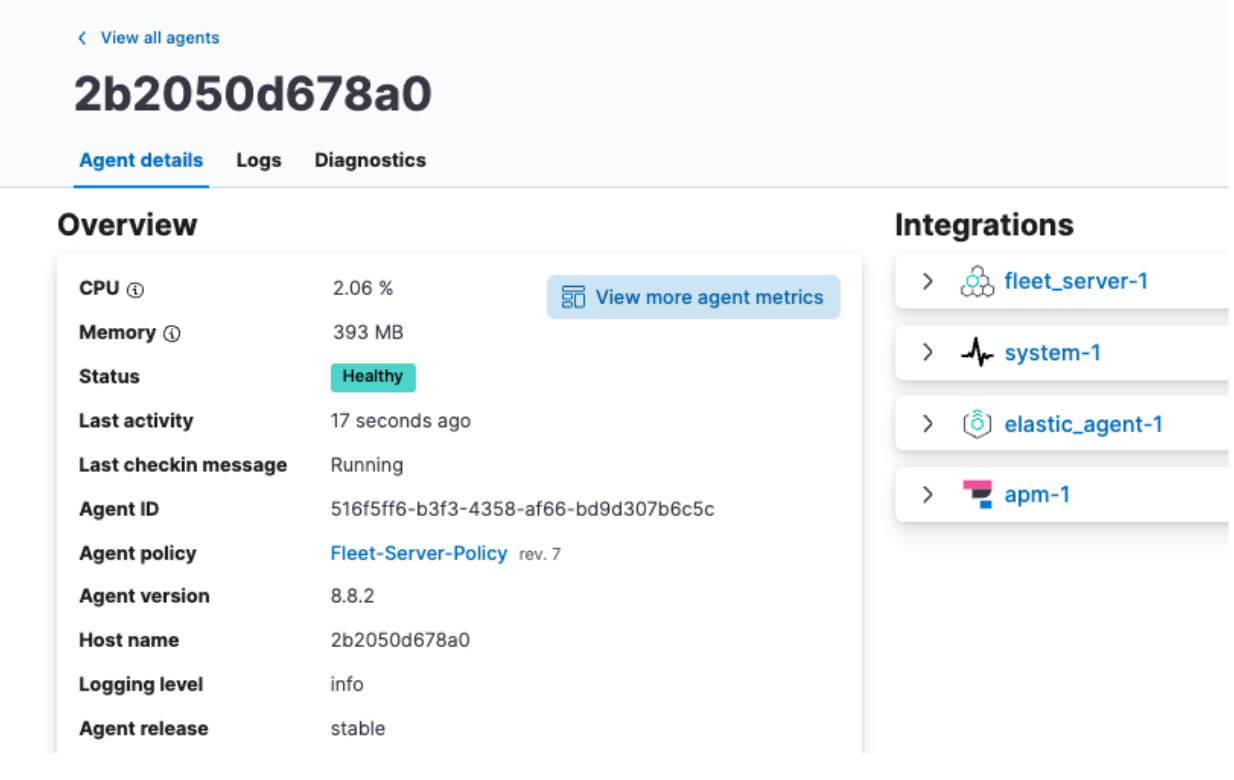
From here, you can also click on View more agent metrics to head to the Agent dashboards and see additional data.
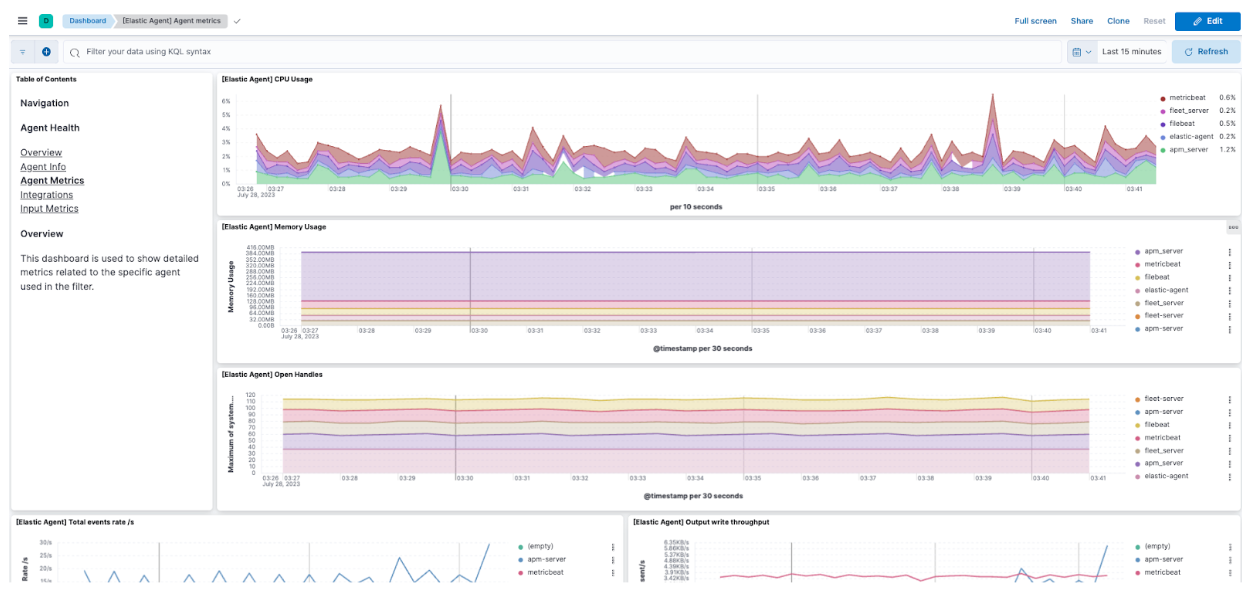
Take a look at the docs for additional information about monitoring Agents.
Reviewing Elastic APM data
Navigating to the Hamburger Menu -> Observability -> Overview, you will be able to start to see some of the Elastic APM metrics flowing in as well.
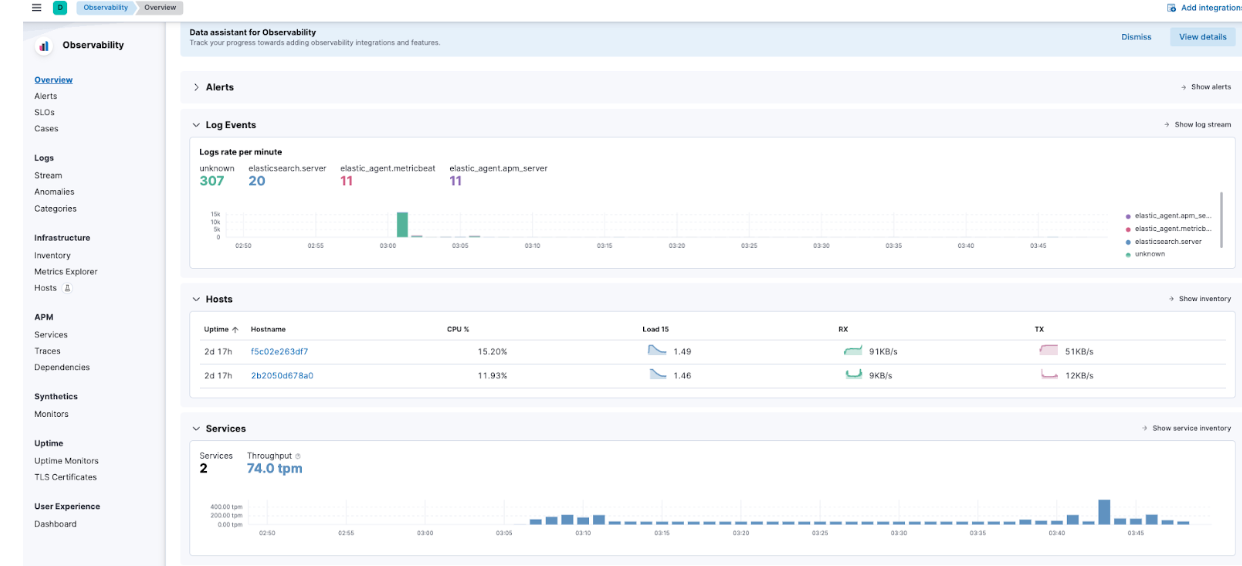
Specifically, navigate to APM -> Services and you will be able to see both Kibana and our demo application.
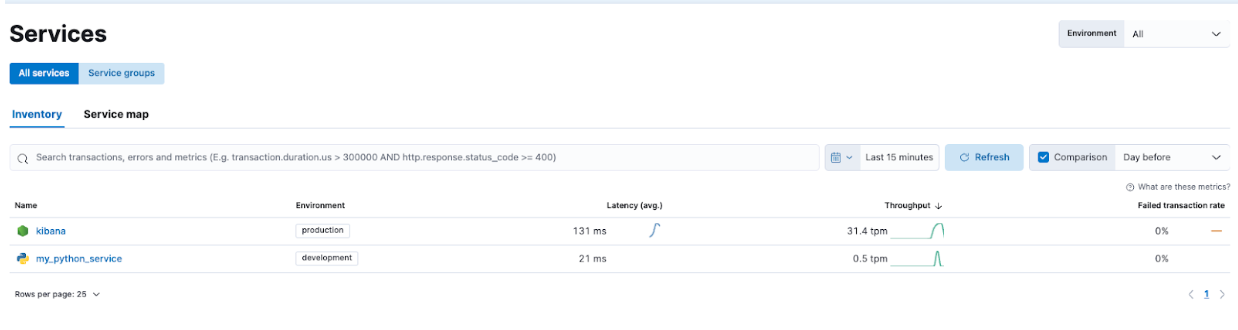
This will allow you to drill down into the services and familiarize yourself with what types of information Elastic APM is capturing.
Troubleshoot and scale seamlessly with the Elastic Stack
Part two of our Getting Started with the Elastic Stack and Docker Compose series focused on additional security and features such as Elastic Agent, Fleet, and Elastic APM. Adding a custom application via Dockerfile also helps illustrate the implementation of Elastic APM.
This allows for a great local learning platform to develop and test out features.
Instrumenting your applications with the Elastic APM Agents to monitor your applications will greatly improve your ability to enhance and troubleshoot your applications moving forward. Utilizing Elastic Agent and Fleet services will allow you to scale your instrumentation with ease.
Keep in mind that while we demonstrated the Elastic Agents and APM, this setup will also allow for testing of OTel configurations as well!
When you’re ready to move to a more production-ready cluster, check out Elastic Cloud to find a seamless transition of what you’ve learned locally into a production-ready environment with many integrations.
All files discussed here are available on GitHub. Questions and pull requests are welcome!
The release and timing of any features or functionality described in this post remain at Elastic's sole discretion. Any features or functionality not currently available may not be delivered on time or at all.
Share
- Share on Twitter
Share on Twitter
- Share on LinkedIn
Share on LinkedIn
- Share on Facebook
Share on Facebook
- Share by Email
Share by Email
- Print this page
Print