Getting started with the Elastic Stack and Docker Compose: Part 1


 Share on Twitter
Share on Twitter

 Share on LinkedIn
Share on LinkedIn

 Share on Facebook
Share on Facebook

 Share by Email
Share by Email

 Print this page
Print
As the Elastic Stack has grown over the years and the feature sets have increased, so has the complexity of getting started or attempting a proof-of-concept (POC) locally. And while Elastic Cloud is still the fastest and easiest way to get started with Elastic, the need for local development and testing is still widely abundant. As developers, we are drawn to quick setups and rapid development with low-effort results. Nothing screams fast setup and POC quite like Docker — which is what we’ll be focusing on to get started with an entire Elastic Stack build-out for your local enjoyment.
In part one of this two-part series, we’ll dive into configuring the components of a standard Elastic Stack consisting of Elasticsearch, Logstash, Kibana, and Beats (ELK-B), on which we can immediately begin developing.
In part two, we’ll enhance our base configuration and add many of the different features that power our evolving stack, such as APM, Agent, Fleet, Integrations, and Elasticsearch. We will also look at instrumenting these in our new local environment for development and POC purposes.
For those who have been through some of this before, you're welcome to TL;DR and head over to the repo to grab the files.
As a prerequisite, Docker Desktop or Docker Engine with Docker-Compose will need to be installed and configured. For this tutorial, we will be using Docker Desktop.
Our focus for these Docker containers will primarily be Elasticsearch and Kibana. However, we’ll be utilizing Metricbeat to give us some cluster insight as well as Filebeat and Logstash for some ingestion basics.
File structure
First, let's start by defining the outline of our file structure.
├── .env
├── docker-compose.yml
├── filebeat.yml
├── logstash.conf
└── metricbeat.yml
We’ll keep it simple initially. Elasticsearch and Kibana will be able to start from the docker-compose file, while Filebeat, Metricbeat, and Logstash will all need additional configuration from yml files.
Environment file
Next, we’ll define variables to pass to the docker-compose via the .env file. These parameters will help us establish ports, memory limits, component versions, etc.
.env
# Project namespace (defaults to the current folder name if not set)
#COMPOSE_PROJECT_NAME=myproject


# Password for the 'elastic' user (at least 6 characters)
ELASTIC_PASSWORD=changeme


# Password for the 'kibana_system' user (at least 6 characters)
KIBANA_PASSWORD=changeme


# Version of Elastic products
STACK_VERSION=8.7.1


# Set the cluster name
CLUSTER_NAME=docker-cluster


# Set to 'basic' or 'trial' to automatically start the 30-day trial
LICENSE=basic
#LICENSE=trial


# Port to expose Elasticsearch HTTP API to the host
ES_PORT=9200


# Port to expose Kibana to the host
KIBANA_PORT=5601


# Increase or decrease based on the available host memory (in bytes)
ES_MEM_LIMIT=1073741824
KB_MEM_LIMIT=1073741824
LS_MEM_LIMIT=1073741824


# SAMPLE Predefined Key only to be used in POC environments
ENCRYPTION_KEY=c34d38b3a14956121ff2170e5030b471551370178f43e5626eec58b04a30fae2
Note that the placeholder word “changeme” for all the passwords and the sample key are used for demonstration purposes only. These should be changed even for your local POC needs.
As you can see here, we specify ports 9200 and 5601 for Elasticsearch and Kibana respectively. This is also where you can change from “basic” to “trial” license type in order to test additional features.
We make use of the `STACK_VERSION' environment variable here in order to pass it to each of the services (containers) in our docker-compose.yml file. When using Docker, opting to hard-code the version number as opposed to using something like the :latest tag is a good way to maintain positive control over the environment. For components of the Elastic Stack, the :latest tag is not supported and we require version numbers to pull the images.
Setup and Elasticsearch node
One of the first bits of trouble that's often run into when getting started is security configuration. As of 8.0, security is enabled by default. Therefore, we'll need to make sure we have the certificate CA setup correctly by utilizing a "setup" node to establish the certificates. Having security enabled is a recommended practice and should not be disabled, even in POC environments.
docker-compose.yml (‘setup’ container)
version: "3.8"


volumes:
 certs:
   driver: local
 esdata01:
   driver: local
 kibanadata:
   driver: local
 metricbeatdata01:
   driver: local
 filebeatdata01:
   driver: local
 logstashdata01:
   driver: local


networks:
 default:
   name: elastic
   external: false


services:
 setup:
   image: docker.elastic.co/elasticsearch/elasticsearch:${STACK_VERSION}
   volumes:
     - certs:/usr/share/elasticsearch/config/certs
   user: "0"
   command: >
     bash -c '
       if [ x${ELASTIC_PASSWORD} == x ]; then
         echo "Set the ELASTIC_PASSWORD environment variable in the .env file";
         exit 1;
       elif [ x${KIBANA_PASSWORD} == x ]; then
         echo "Set the KIBANA_PASSWORD environment variable in the .env file";
         exit 1;
       fi;
       if [ ! -f config/certs/ca.zip ]; then
         echo "Creating CA";
         bin/elasticsearch-certutil ca --silent --pem -out config/certs/ca.zip;
         unzip config/certs/ca.zip -d config/certs;
       fi;
       if [ ! -f config/certs/certs.zip ]; then
         echo "Creating certs";
         echo -ne \
         "instances:\n"\
         "  - name: es01\n"\
         "    dns:\n"\
         "      - es01\n"\
         "      - localhost\n"\
         "    ip:\n"\
         "      - 127.0.0.1\n"\
         "  - name: kibana\n"\
         "    dns:\n"\
         "      - kibana\n"\
         "      - localhost\n"\
         "    ip:\n"\
         "      - 127.0.0.1\n"\
         > config/certs/instances.yml;
         bin/elasticsearch-certutil cert --silent --pem -out config/certs/certs.zip --in config/certs/instances.yml --ca-cert config/certs/ca/ca.crt --ca-key config/certs/ca/ca.key;
         unzip config/certs/certs.zip -d config/certs;
       fi;
       echo "Setting file permissions"
       chown -R root:root config/certs;
       find . -type d -exec chmod 750 \{\} \;;
       find . -type f -exec chmod 640 \{\} \;;
       echo "Waiting for Elasticsearch availability";
       until curl -s --cacert config/certs/ca/ca.crt https://es01:9200 | grep -q "missing authentication credentials"; do sleep 30; done;
       echo "Setting kibana_system password";
       until curl -s -X POST --cacert config/certs/ca/ca.crt -u "elastic:${ELASTIC_PASSWORD}" -H "Content-Type: application/json" https://es01:9200/_security/user/kibana_system/_password -d "{\"password\":\"${KIBANA_PASSWORD}\"}" | grep -q "^{}"; do sleep 10; done;
       echo "All done!";
     '
   healthcheck:
     test: ["CMD-SHELL", "[ -f config/certs/es01/es01.crt ]"]
     interval: 1s
     timeout: 5s
retries: 120At the top of the docker-compose.yml we set the compose version, followed by the volumes and default networking configuration that will be used throughout our different containers.
We also see that we're standing up a container labeled “setup” with some bash magic to specify our cluster nodes. This allows us to call the elasticsearch-certutil, passing the server names in yml format in order to create the CA cert and node certs. If you wanted to have more than one Elasticsearch node in your stack, this is where you would add the server name to allow the cert creation.
Note: In a future post, we’ll adopt the recommended method of using a keystore to keep secrets, but for now, this will allow us to get the cluster up and running.
This setup container will start up first, wait for the ES01 container to come online, and then use our environment variables to set up the passwords we want in our cluster. We’re also saving all certificates to the “certs” volume so that all other containers can have access to them.
Since the Setup container is dependent on the ES01 container, let's take a quick look at the next configuration so we can start them both up:
docker-compose.yml (‘es01’ container)
 es01:
   depends_on:
     setup:
       condition: service_healthy
   image: docker.elastic.co/elasticsearch/elasticsearch:${STACK_VERSION}
   labels:
     co.elastic.logs/module: elasticsearch
   volumes:
     - certs:/usr/share/elasticsearch/config/certs
     - esdata01:/usr/share/elasticsearch/data
   ports:
     - ${ES_PORT}:9200
   environment:
     - node.name=es01
     - cluster.name=${CLUSTER_NAME}
     - discovery.type=single-node
     - ELASTIC_PASSWORD=${ELASTIC_PASSWORD}
     - bootstrap.memory_lock=true
     - xpack.security.enabled=true
     - xpack.security.http.ssl.enabled=true
     - xpack.security.http.ssl.key=certs/es01/es01.key
     - xpack.security.http.ssl.certificate=certs/es01/es01.crt
     - xpack.security.http.ssl.certificate_authorities=certs/ca/ca.crt
     - xpack.security.transport.ssl.enabled=true
     - xpack.security.transport.ssl.key=certs/es01/es01.key
     - xpack.security.transport.ssl.certificate=certs/es01/es01.crt
     - xpack.security.transport.ssl.certificate_authorities=certs/ca/ca.crt
     - xpack.security.transport.ssl.verification_mode=certificate
     - xpack.license.self_generated.type=${LICENSE}
   mem_limit: ${ES_MEM_LIMIT}
   ulimits:
     memlock:
       soft: -1
       hard: -1
   healthcheck:
     test:
       [
         "CMD-SHELL",
         "curl -s --cacert config/certs/ca/ca.crt https://localhost:9200 | grep -q 'missing authentication credentials'",
       ]
     interval: 10s
     timeout: 10s
retries: 120This will be the single-node cluster of Elasticsearch that we’re using for testing.
Notice we’ll be using the CA cert and node certificates that were generated.
You will also notice that we’re storing the Elasticsearch data in a volume outside of the container by specifying - esdata01:/usr/share/elasticsearch/data The two primary reasons for this are performance and data persistence. If we were to leave the data directory inside the container, we would see a significant degradation in the performance of our Elasticsearch node, as well as lose data anytime we needed to change the configuration of the container within our docker-compose file.
With both configurations in place, we can perform our first `docker-compose up` command.
Docker Compose tips
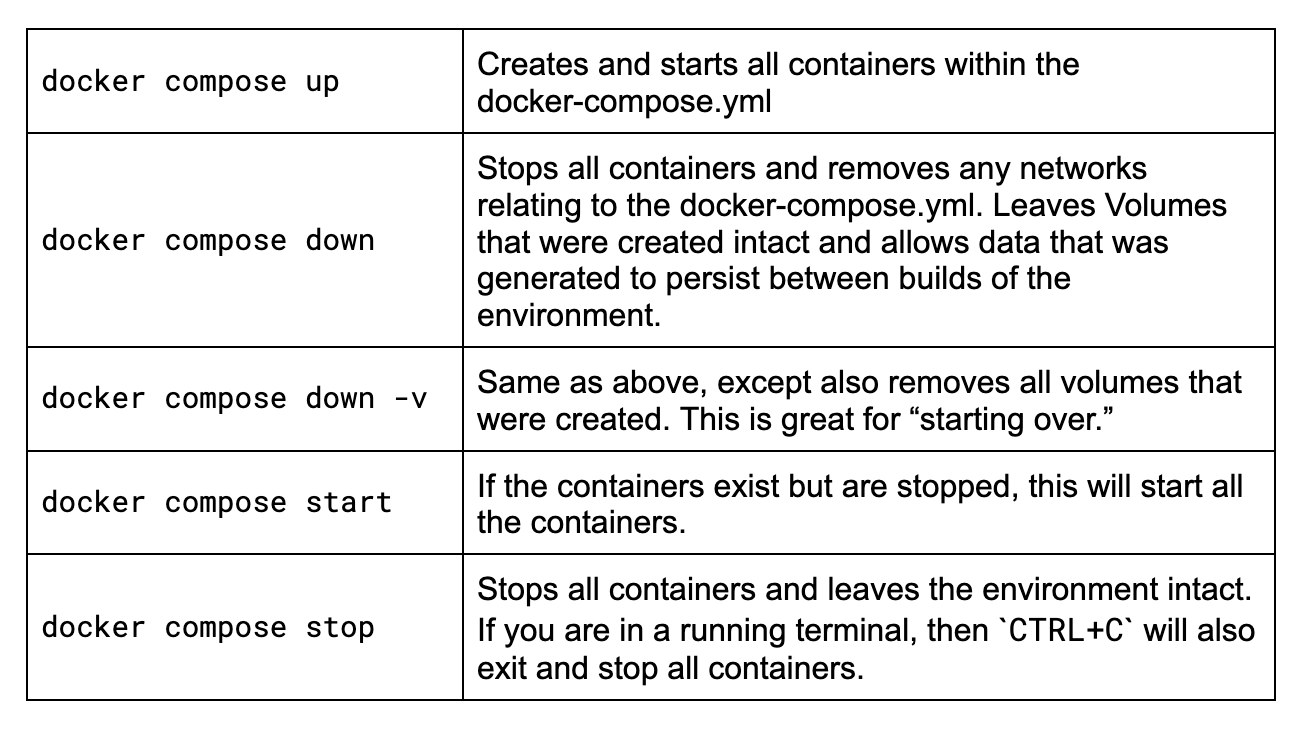
If you’re new to Docker Compose or it’s been a while since you’ve had to remember some of the commands, let’s quickly review the primary ones you will want to know for this adventure.
You will want to run all these commands in a terminal while in the same folder in which your docker-compose.yml file resides. My example folder:
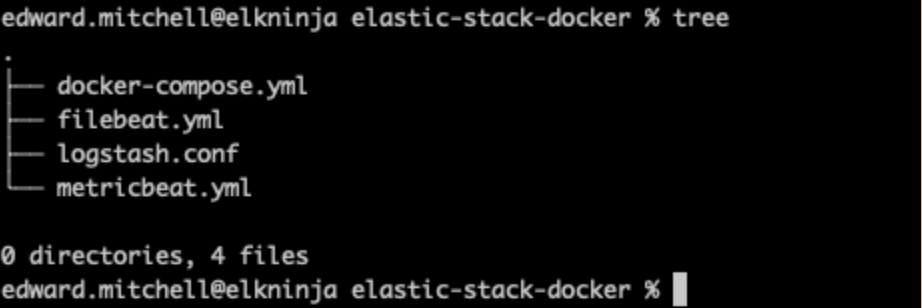
Let’s take a look at those commands.
Now, lets run `docker-compose up`.
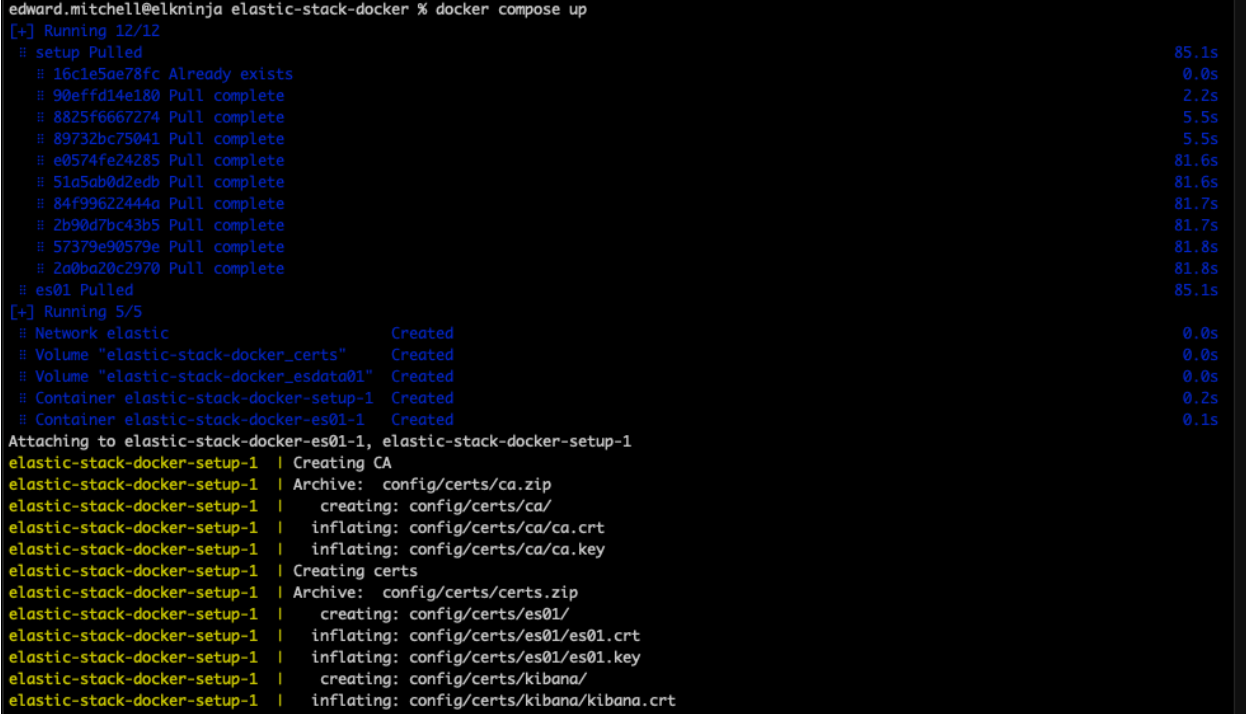
At this point, if the syntax is correct, Docker will begin to download all images and build the environment that is listed in the docker-compose.yml file. This may take a few minutes depending on the speed of your internet. If you want to see the images outside of Docker Desktop, you can always find them in the official Elastic Docker Hub.
Troubleshooting Virtual Memory misconfigurations
When starting up the Elasticsearch node for the first time, many users get stuck on the Virtual Memory configuration and receive an error message such as:
{"@timestamp":"2023-04-14T13:16:22.148Z", "log.level":"ERROR", "message":"node validation exception\n[1] bootstrap checks failed. You must address the points described in the following [1] lines before starting Elasticsearch.\nbootstrap check failure [1] of [1]: max virtual memory areas vm.max_map_count [65530] is too low, increase to at least [262144]", "ecs.version": "1.2.0","service.name":"ES_ECS","event.dataset":"elasticsearch.server","process.thread.name":"main","log.logger":"org.elasticsearch.bootstrap.Elasticsearch","elasticsearch.node.name":"es01","elasticsearch.cluster.name":"docker-cluster"}The key takeaway here is max virtual memory areas vm.max_map_count [65530] is too low, increase to at least [262144].
Ultimately, the command sysctl -w vm.max_map_count=262144 needs to be run where the containers are being hosted.
In the case of Mac, check these instructions for Docker for Mac. Follow these instructions for Docker Desktop. For Linux users, see these instructions. Windows users, if you have Docker Desktop, you can try these instructions. However, if you’re using WSLv2 with Docker Desktop, take a look here.
Once complete, you can reboot Docker Desktop and retry your docker-compose up command.
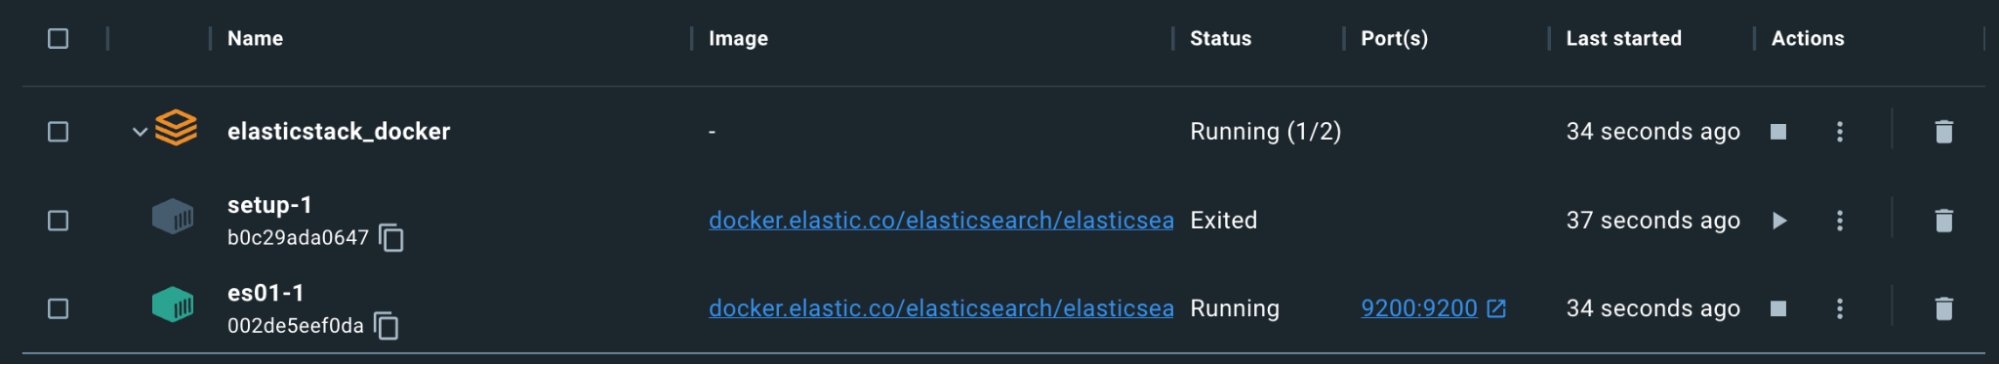
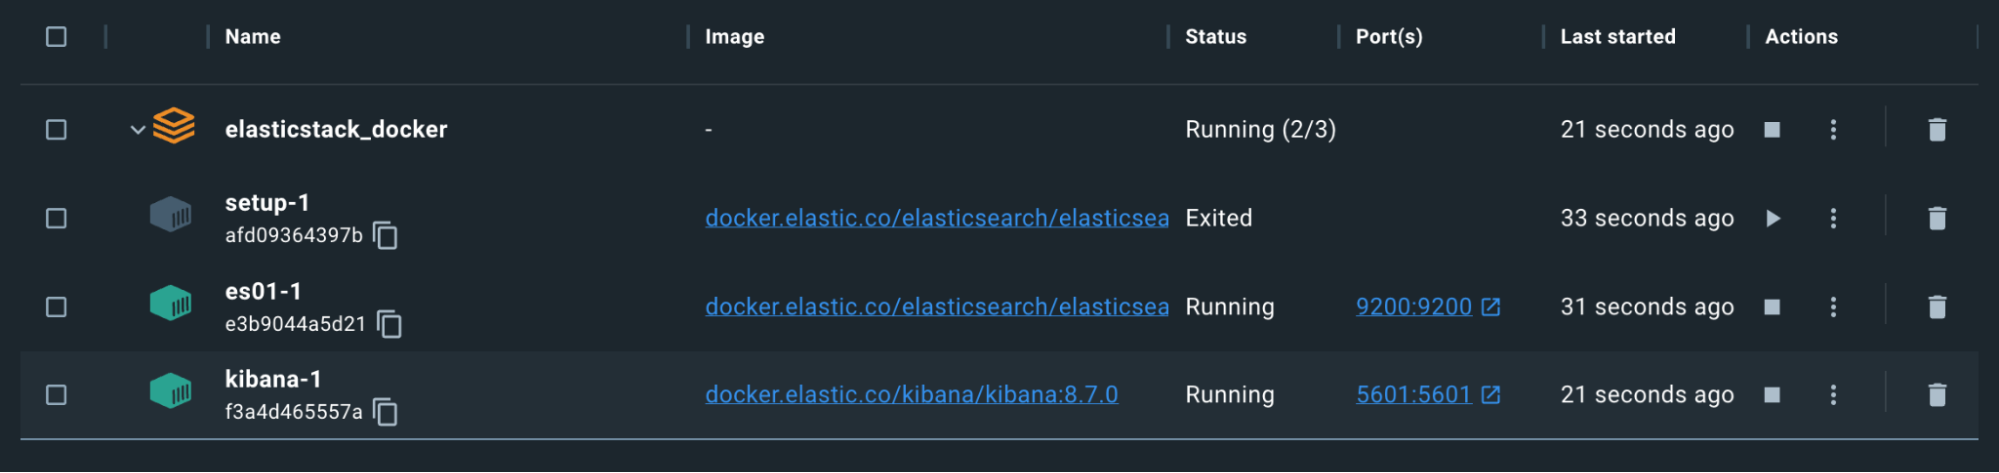
Remember, the Setup container will exit on purpose after it has completed generating the certs and passwords.
So far so good, but let's test.
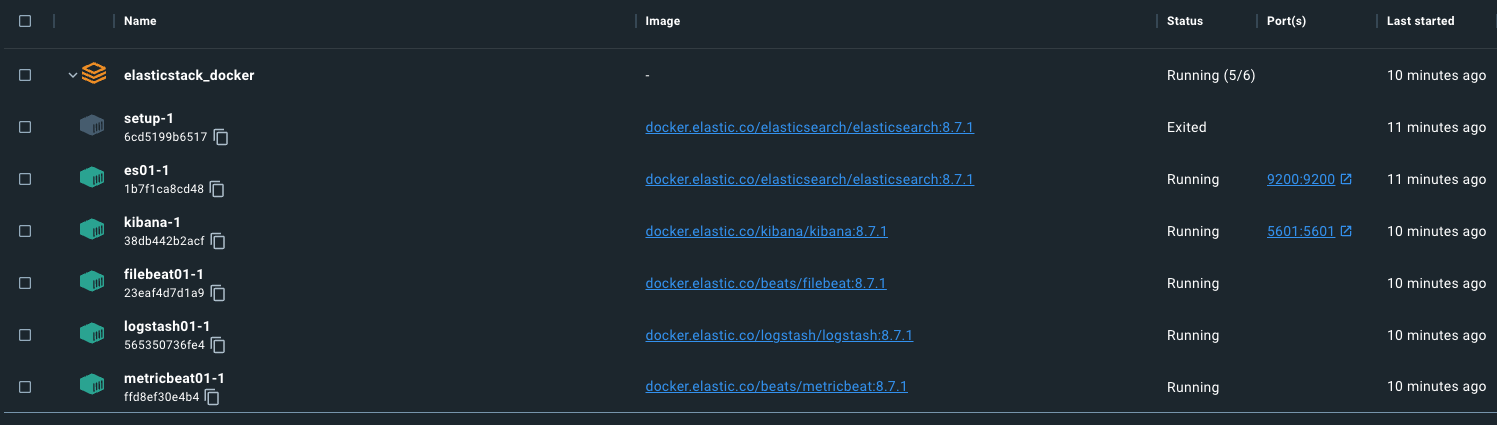
We can use a command to copy the ca.crt out of the es01-1 container. Remember, the name of the set of containers is based on the folder from which the docker-compose.yml is running. For example, my directory is “elasticstack_docker” therefore, my command would look like this, based on the screenshot above:
docker cp
elasticstack_docker-es01-1:/usr/share/elasticsearch/config/certs/ca/ca.crt /tmp/.
Once the certificate is downloaded, run a curl command to query the Elasticsearch node:
curl --cacert /tmp/ca.crt -u elastic:changeme https://localhost:9200
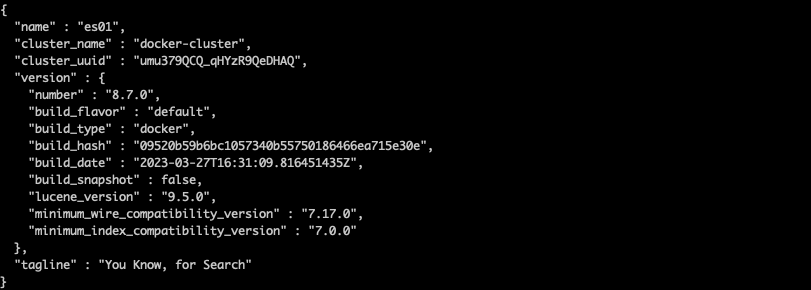
Success!
Notice that we’re accessing Elasticsearch using localhost:9200. This is thanks to the port, which has been specified via the ports section of docker-compose.yml. This setting maps ports on the container to ports on the host and allows traffic to pass through your machine and into the docker container with that port specified.
Kibana
For the Kibana config, we will utilize the certificate output from earlier. We will also specify that this node doesn't start until it sees that the Elasticsearch node above is up and running correctly.
docker-compose.yml (‘kibana’ container)
kibana:
   depends_on:
     es01:
       condition: service_healthy
   image: docker.elastic.co/kibana/kibana:${STACK_VERSION}
   labels:
     co.elastic.logs/module: kibana
   volumes:
     - certs:/usr/share/kibana/config/certs
     - kibanadata:/usr/share/kibana/data
   ports:
     - ${KIBANA_PORT}:5601
   environment:
     - SERVERNAME=kibana
     - ELASTICSEARCH_HOSTS=https://es01:9200
     - ELASTICSEARCH_USERNAME=kibana_system
     - ELASTICSEARCH_PASSWORD=${KIBANA_PASSWORD}
     - ELASTICSEARCH_SSL_CERTIFICATEAUTHORITIES=config/certs/ca/ca.crt
     - XPACK_SECURITY_ENCRYPTIONKEY=${ENCRYPTION_KEY}
     - XPACK_ENCRYPTEDSAVEDOBJECTS_ENCRYPTIONKEY=${ENCRYPTION_KEY}
     - XPACK_REPORTING_ENCRYPTIONKEY=${ENCRYPTION_KEY}
   mem_limit: ${KB_MEM_LIMIT}
   healthcheck:
     test:
       [
         "CMD-SHELL",
         "curl -s -I http://localhost:5601 | grep -q 'HTTP/1.1 302 Found'",
       ]
     interval: 10s
     timeout: 10s
retries: 120Notice in our `environment` section that we’re specifying ELASTICSEARCH_HOSTS=https://es01:9200 We’re able to specify the container name here for our ES01 Elasticsearch container since we’re utilizing the Docker default networking. All containers that are using the “elastic” network that was specified at the beginning of our docker-compose.yml file will be able to properly resolve other container names and communicate with each other.
Let's load up Kibana and see if we can access it.
The containers are green. We should now be able to reach http://localhost:5601.
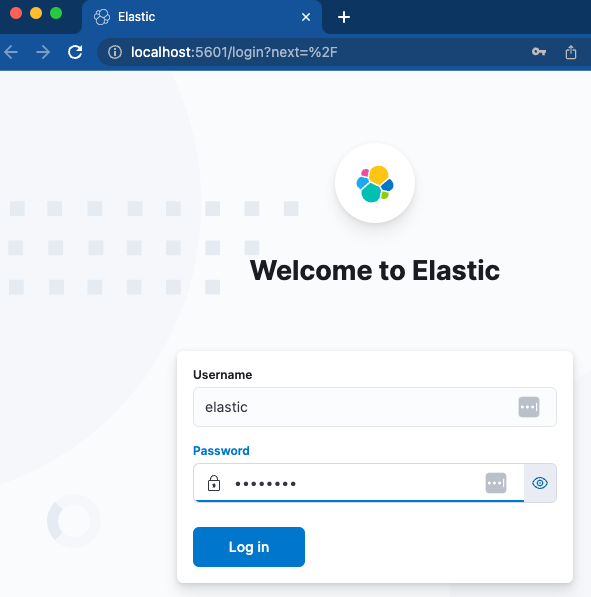
A quick login with the username and password that was specified should drop us right into a brand-new instance of Kibana. Excellent!
Metricbeat
Now that we have Kibana and Elasticsearch up and running and communicating, let’s configure Metricbeat to help us keep an eye on things. This will require both configuration in our docker-compose file, and also in a standalone metricbeat.yml file.
Note: For Logstash, Filebeat, and Metricbeat, the configuration files are using bind mounts. Bind mounts for files will retain the same permissions and ownership within the container that they have on the host system. Be sure to set permissions such that the files will be readable and, ideally, not writeable by the container’s user. You will receive an error in the container otherwise. Removing the write permissions on your host may suffice.
docker-compose.yml (‘metricbeat01’ container)
 metricbeat01:
   depends_on:
     es01:
       condition: service_healthy
     kibana:
       condition: service_healthy
   image: docker.elastic.co/beats/metricbeat:${STACK_VERSION}
   user: root
   volumes:
     - certs:/usr/share/metricbeat/certs
     - metricbeatdata01:/usr/share/metricbeat/data
     - "./metricbeat.yml:/usr/share/metricbeat/metricbeat.yml:ro"
     - "/var/run/docker.sock:/var/run/docker.sock:ro"
     - "/sys/fs/cgroup:/hostfs/sys/fs/cgroup:ro"
     - "/proc:/hostfs/proc:ro"
     - "/:/hostfs:ro"
   environment:
     - ELASTIC_USER=elastic
     - ELASTIC_PASSWORD=${ELASTIC_PASSWORD}
     - ELASTIC_HOSTS=https://es01:9200
     - KIBANA_HOSTS=http://kibana:5601
- LOGSTASH_HOSTS=http://logstash01:9600Here, we’re exposing host information regarding processes, filesystem, and the docker daemon to the Metricbeat container in a read-only fashion. This enables Metricbeat to collect the data to send to Elasticsearch.
metricbeat.yml
metricbeat.config.modules:
path: ${path.config}/modules.d/*.yml
reload.enabled: false
metricbeat.modules:
- module: elasticsearch
xpack.enabled: true
period: 10s
hosts: ${ELASTIC_HOSTS}
ssl.certificate_authorities: "certs/ca/ca.crt"
ssl.certificate: "certs/es01/es01.crt"
ssl.key: "certs/es01/es01.key"
username: ${ELASTIC_USER}
password: ${ELASTIC_PASSWORD}
ssl.enabled: true
- module: logstash
xpack.enabled: true
period: 10s
hosts: ${LOGSTASH_HOSTS}
- module: kibana
metricsets:
- stats
period: 10s
hosts: ${KIBANA_HOSTS}
username: ${ELASTIC_USER}
password: ${ELASTIC_PASSWORD}
xpack.enabled: true
- module: docker
metricsets:
- "container"
- "cpu"
- "diskio"
- "healthcheck"
- "info"
#- "image"
- "memory"
- "network"
hosts: ["unix:///var/run/docker.sock"]
period: 10s
enabled: true
processors:
- add_host_metadata: ~
- add_docker_metadata: ~
output.elasticsearch:
hosts: ${ELASTIC_HOSTS}
username: ${ELASTIC_USER}
password: ${ELASTIC_PASSWORD}
ssl:
certificate: "certs/es01/es01.crt"
certificate_authorities: "certs/ca/ca.crt"
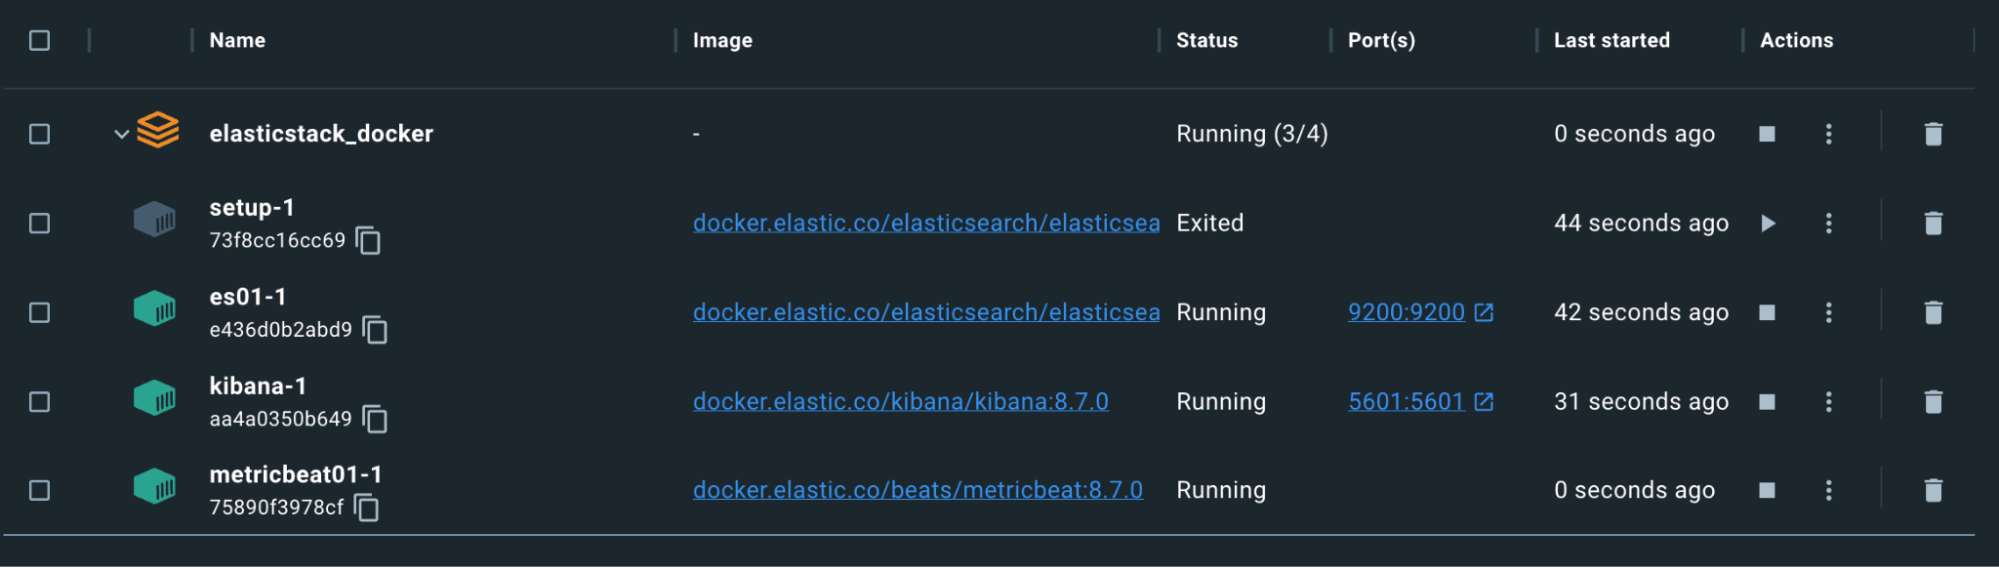
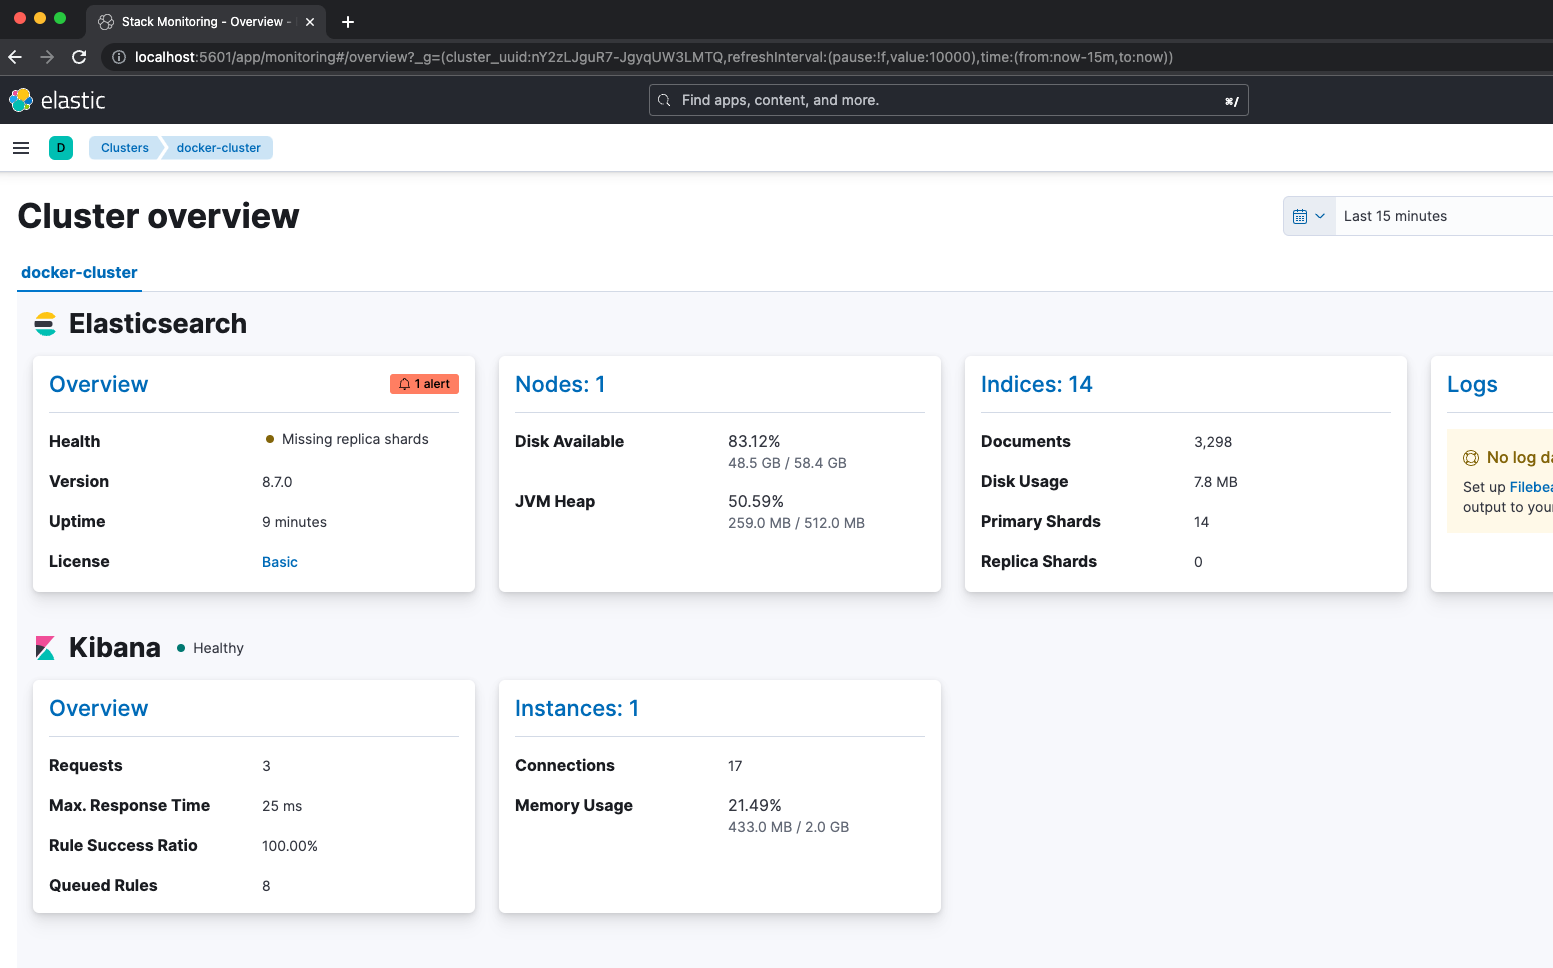
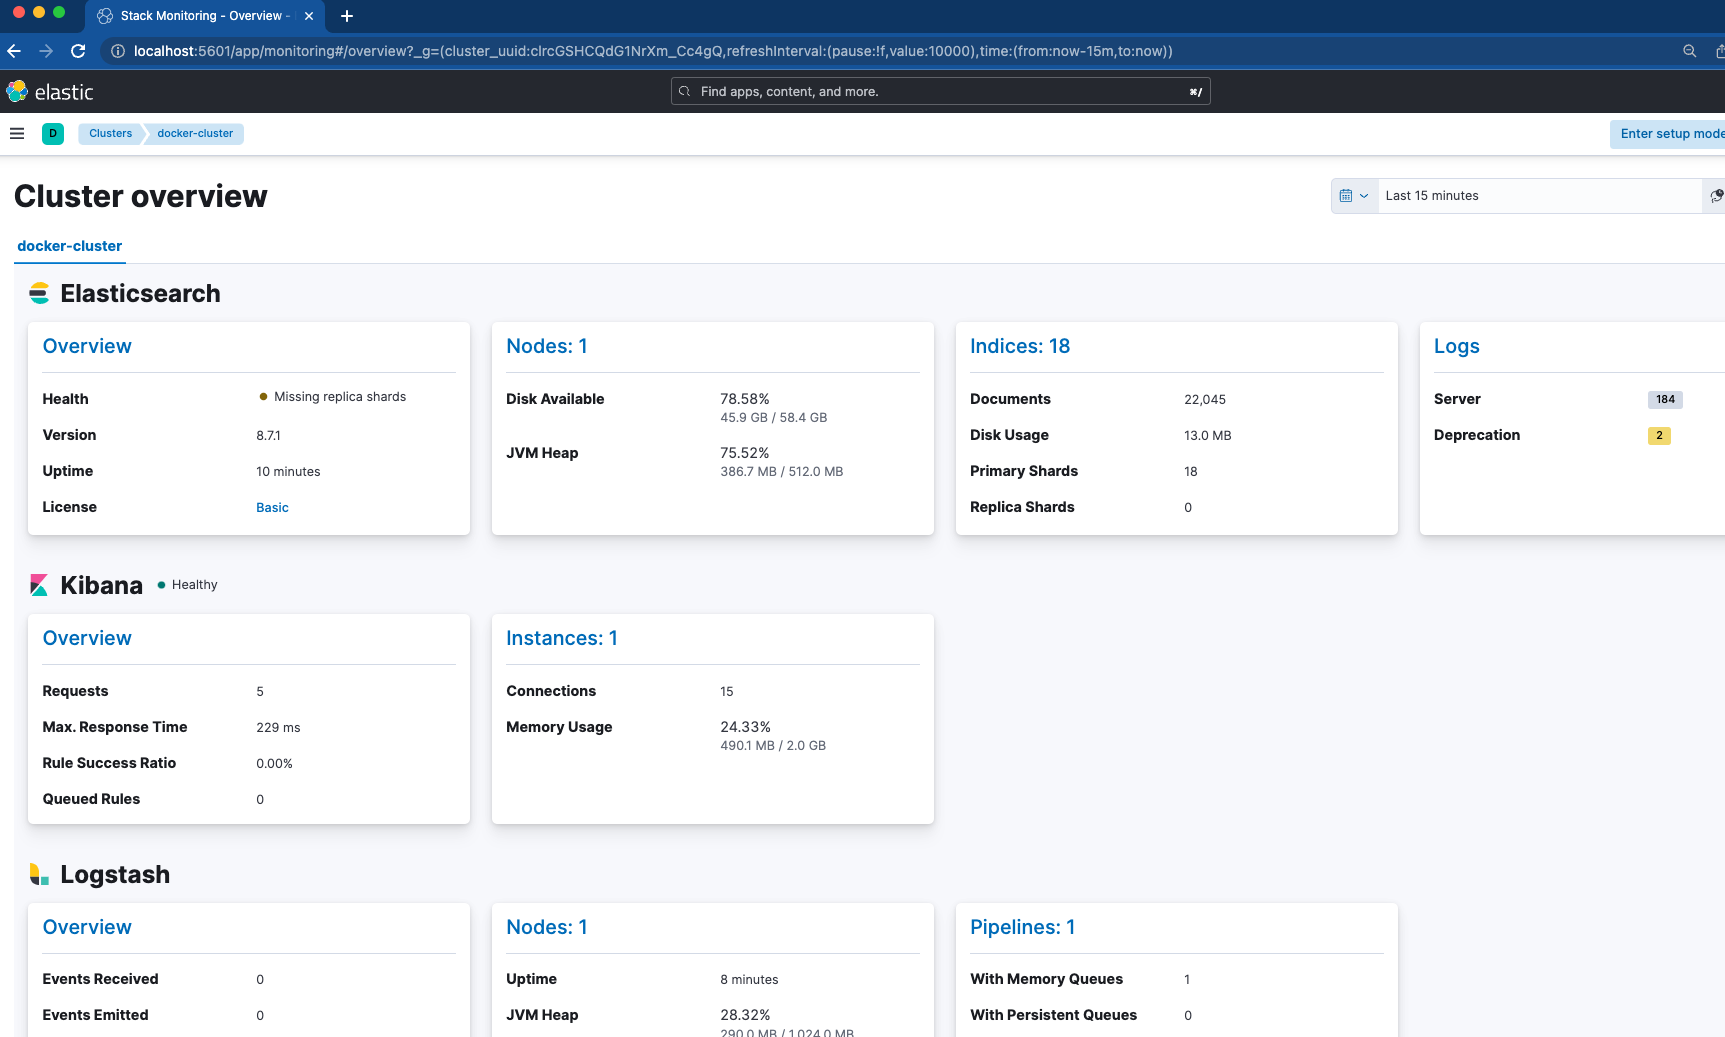
key: "certs/es01/es01.key"Our Metricbeat is dependent on ES01 and Kibana nodes being healthy before starting. The notable configurations here are in the metricbeat.yml file. We have enabled four modules for gathering metrics including Elasticsearch, Kibana, Logstash, and Docker. This means, once we verify Metricbeat is up, we can hop into Kibana and navigate to “Stack Monitoring” to see how things look.
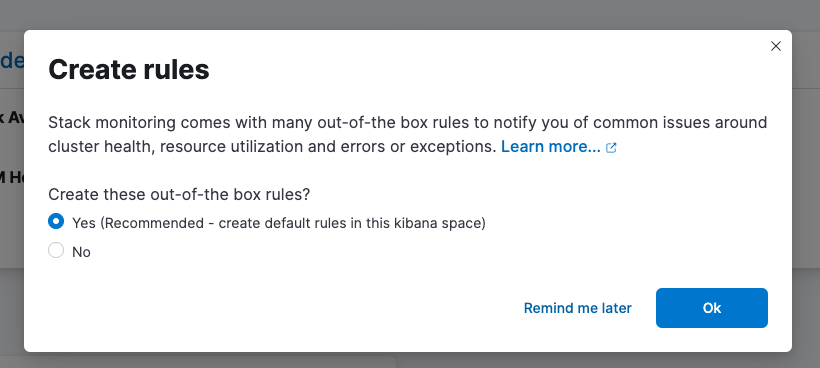
Don't forget to set up your out-of-the-box rules!
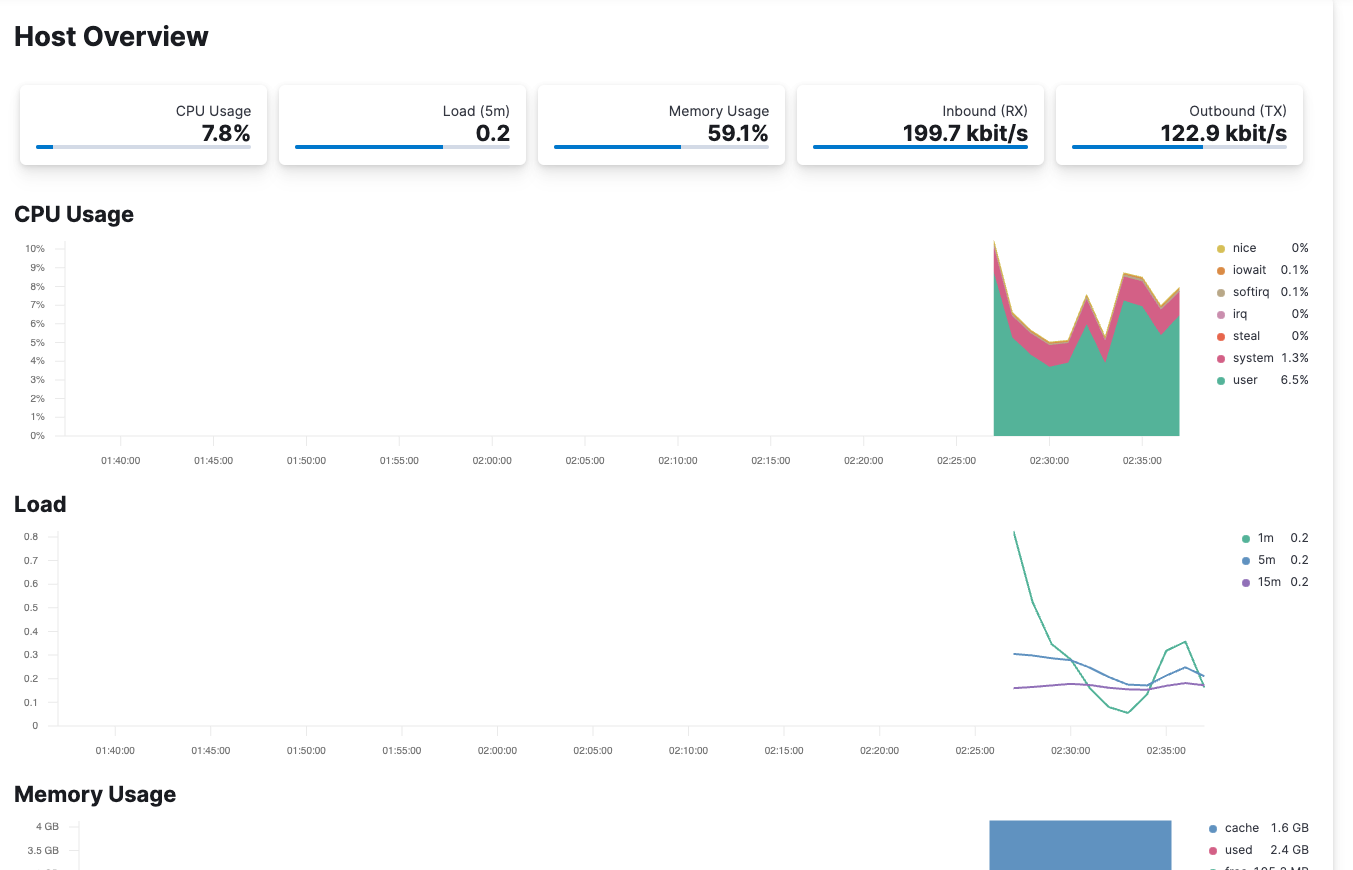
Metricbeat is also configured for monitoring the container’s host through /var/run/docker.sock Checking Elastic Observability allows you to see metrics coming in from your host.
Filebeat
Now that the cluster is stable and monitored with Metricbeat, let’s look at Filebeat for log ingestion. Here, our Filebeat will be utilized in two different ways:
docker-compose.yml (‘filebeat01’ container)
 filebeat01:
   depends_on:
     es01:
       condition: service_healthy
   image: docker.elastic.co/beats/filebeat:${STACK_VERSION}
   user: root
   volumes:
     - certs:/usr/share/filebeat/certs
     - filebeatdata01:/usr/share/filebeat/data
     - "./filebeat_ingest_data/:/usr/share/filebeat/ingest_data/"
     - "./filebeat.yml:/usr/share/filebeat/filebeat.yml:ro"
     - "/var/lib/docker/containers:/var/lib/docker/containers:ro"
     - "/var/run/docker.sock:/var/run/docker.sock:ro"
   environment:
     - ELASTIC_USER=elastic
     - ELASTIC_PASSWORD=${ELASTIC_PASSWORD}
     - ELASTIC_HOSTS=https://es01:9200
     - KIBANA_HOSTS=http://kibana:5601
- LOGSTASH_HOSTS=http://logstash01:9600filebeat.yml
filebeat.inputs:
- type: filestream
 id: default-filestream
 paths:
   - ingest_data/*.log


filebeat.autodiscover:
 providers:
   - type: docker
     hints.enabled: true


processors:
- add_docker_metadata: ~


setup.kibana:
 host: ${KIBANA_HOSTS}
 username: ${ELASTIC_USER}
 password: ${ELASTIC_PASSWORD}


output.elasticsearch:
 hosts: ${ELASTIC_HOSTS}
 username: ${ELASTIC_USER}
 password: ${ELASTIC_PASSWORD}
 ssl.enabled: true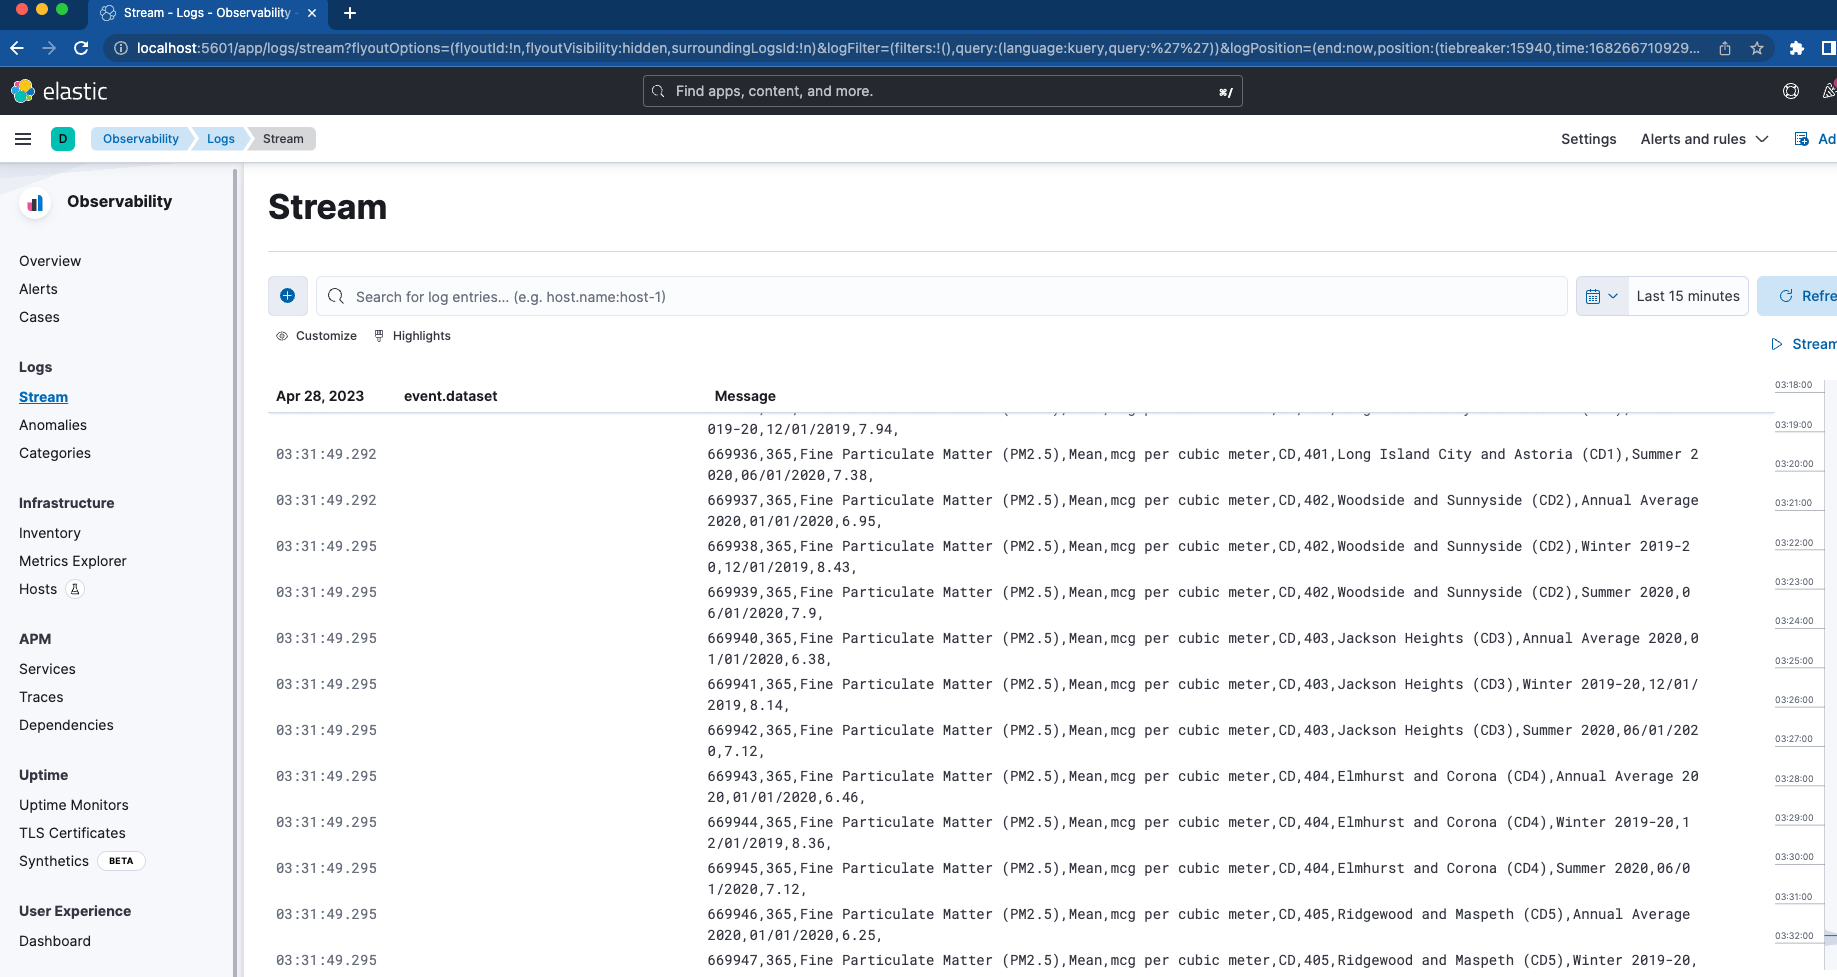
ssl.certificate_authorities: "certs/ca/ca.crt"First, we set a bind mount to map the folder “filebeat_ingest_data” into the container. If this folder doesn't exist on your host, it will be created when the container spins up. If you’d like to test the Logs Stream viewer within Elastic Observability for your custom logs, you can easily drop any file with a .log extension into /filebeat_ingest_data/ and the logs will be read into the default Filebeat Datastream.
Alongside this, we also map in /var/lib/docker/containers and /var/run/docker.sock which, combined with the filebeat.autodiscover section and hints-based autodiscover, allows Filebeat to pull in the logs for all the containers. These logs will also be found in the Logs Stream viewer mentioned above.
Logstash
Our final container to bring to life is none other than Logstash.
docker-compose.yml (‘logstash01’ container)
 logstash01:
   depends_on:
     es01:
       condition: service_healthy
     kibana:
       condition: service_healthy
   image: docker.elastic.co/logstash/logstash:${STACK_VERSION}
   labels:
     co.elastic.logs/module: logstash
   user: root
   volumes:
     - certs:/usr/share/logstash/certs
     - logstashdata01:/usr/share/logstash/data
     - "./logstash_ingest_data/:/usr/share/logstash/ingest_data/"
     - "./logstash.conf:/usr/share/logstash/pipeline/logstash.conf:ro"
   environment:
     - xpack.monitoring.enabled=false
     - ELASTIC_USER=elastic
     - ELASTIC_PASSWORD=${ELASTIC_PASSWORD}
- ELASTIC_HOSTS=https://es01:9200logstash.conf
input {
 file {
   #https://www.elastic.co/guide/en/logstash/current/plugins-inputs-file.html
   #default is TAIL which assumes more data will come into the file.
   #change to mode => "read" if the file is a compelte file.  by default, the file will be removed once reading is complete -- backup your files if you need them.
   mode => "tail"
   path => "/usr/share/logstash/ingest_data/*"
 }
}


filter {
}


output {
 elasticsearch {
   index => "logstash-%{+YYYY.MM.dd}"
   hosts=> "${ELASTIC_HOSTS}"
   user=> "${ELASTIC_USER}"
   password=> "${ELASTIC_PASSWORD}"
   cacert=> "certs/ca/ca.crt"
 }
}
The Logstash configuration is very similar to the Filebeat configuration. Again we’re using a bind mount and mapping a folder called /logstash_ingest_data/ from the host into the Logstash container. Here, you can test out some of the many input plugins and filter plugins by modifying the logstash.yml file. Then drop your data into the /logstash_ingest_data/ folder. You may need to restart your Logstash container after modifying the logstash.yml file.
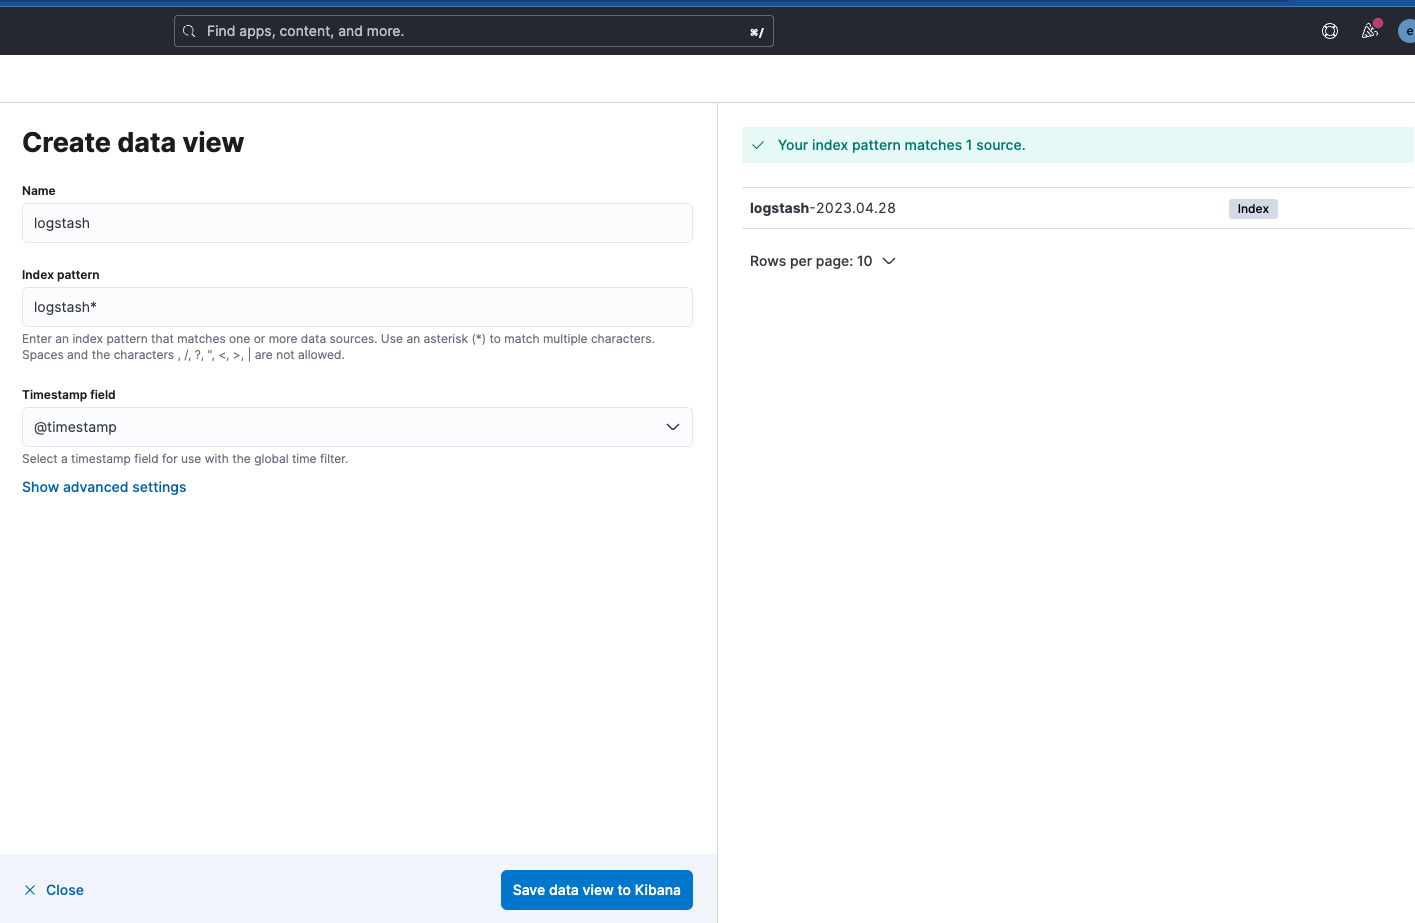
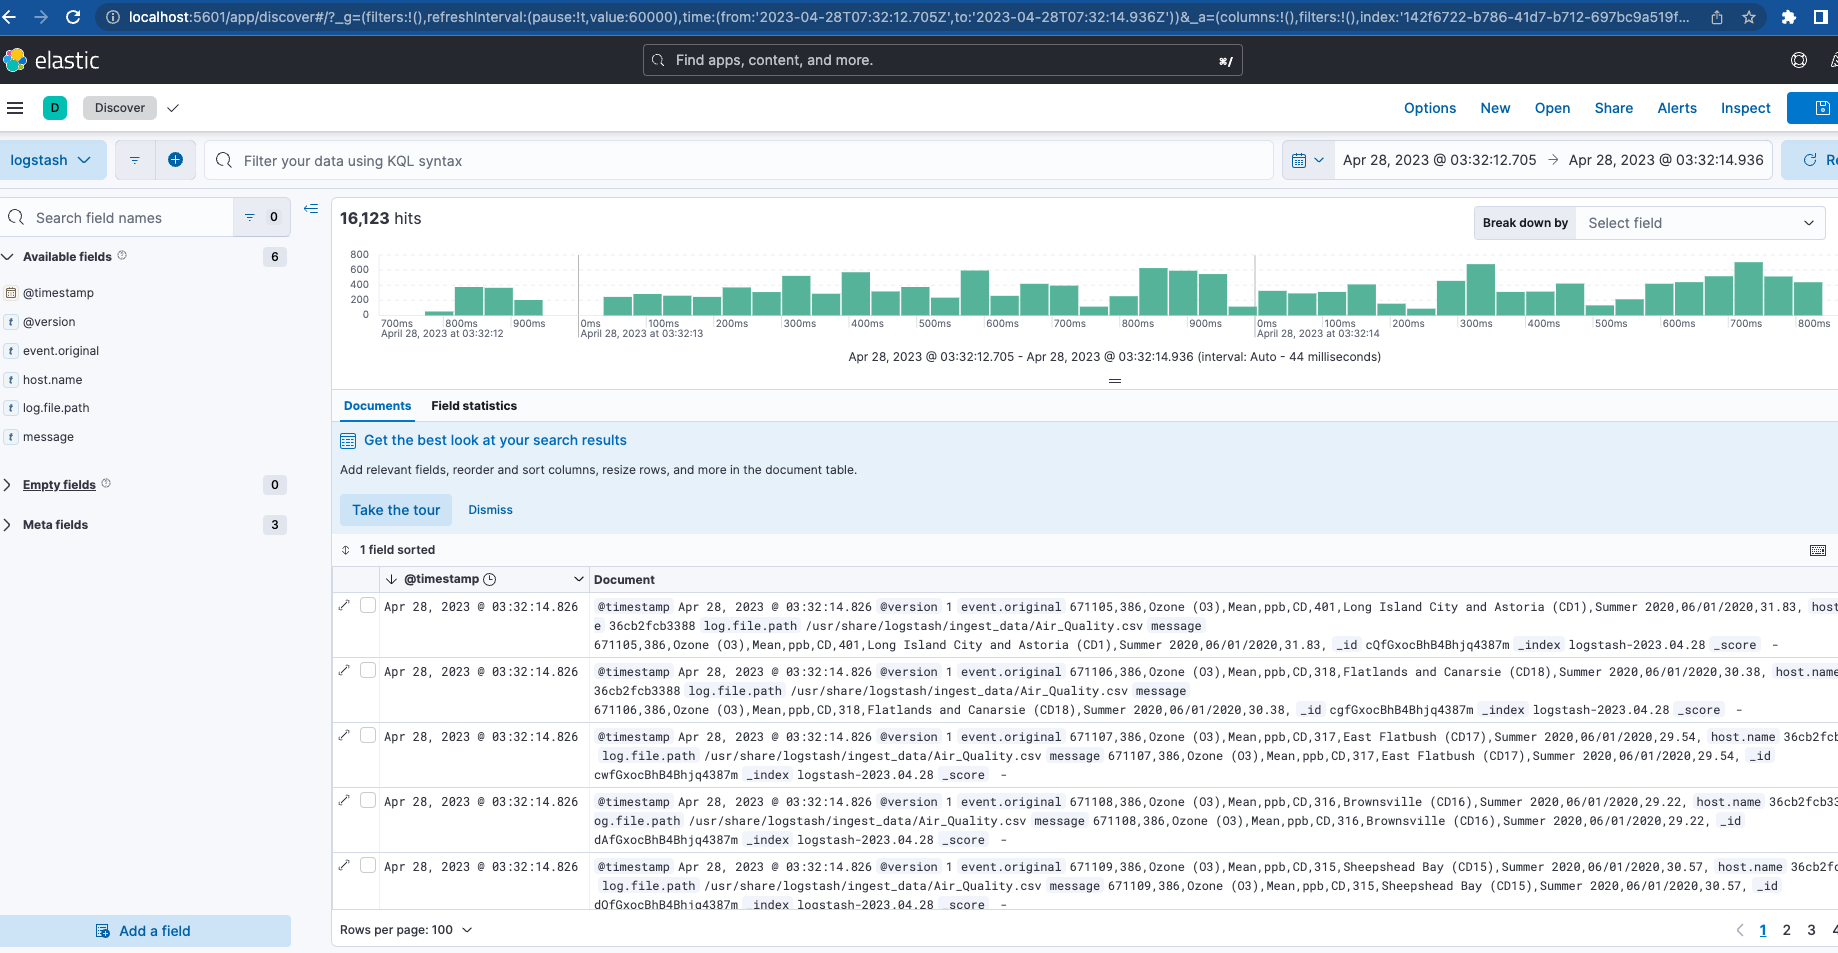
Note, the Logstash output index name is "logstash-%{+YYYY.MM.dd}". To see the data, you will need to create a Data View for the “logstash-*” pattern, as seen below.
Now, with Filebeat and Logstash both up and running, if you navigate back to Cluster Monitoring you will see Logstash being monitored, as well as some metrics and links for Elasticsearch Logs.
Conclusion
Part one of this series has covered a full active cluster with monitoring and ingestion as the foundation of our stack. This will act as your local playground to test some of the features of the Elastic ecosystem.
Ready to learn more? Check out part two! We dive into optimizing this foundation, along with setting up additional features such as APM Server, Elastic Agents, Elastic Integrations, and Elastic Search. We also deploy and test an application that you can instrument with some of these pieces.
All files discussed here are available on GitHub along with some sample data to ingest for Filebeat and Logstash.
Share
- Share on Twitter
Share on Twitter
- Share on LinkedIn
Share on LinkedIn
- Share on Facebook
Share on Facebook
- Share by Email
Share by Email
- Print this page
Print