Filtering Input Data to Refine Machine Learning Jobs
Editor's Note (August 3, 2021): This post uses deprecated features. Please reference the map custom regions with reverse geocoding documentation for current instructions.
Elastic machine learning is fast. It’s easy. It’s accurate. It allows users to analyze mountains of data in near real-time. It’s amazing. (Okay, we’re biased).
But what if you want to be a little more selective about the data that machine learning analyzes? In this blog, we’ll show how curating the data you send to a machine learning job allows you to focus on just the anomalies you are interested in. We will do so by applying a filtered query to the datafeed, which will limit the data to only the parts that are pertinent to the desired use case.
You may ask what the "datafeed” is. In an Elastic machine learning job, there are two fundamental parts related to the operation of the job:
- The routine query that obtains data from Elasticsearch to be analyzed (called the
datafeed) - The actual statistical analysis of the data based upon a given configuration (called the
analysis_config)
We will focus our efforts on how to customize the datafeed, and we’ll do so via a very practical example.
Consider NGINX web access logs ingested with Filebeat. Each document has a URL, HTTP response code, HTTP method and other fields of interest. We want to use machine learning on this data and have configured a simple job to find unusual rates of HTTP response codes (200, 404, etc.).
 "analysis_config": {
    "bucket_span": "15m",
    "detectors": [
      {
        "detector_description": "count partitionfield=nginx.access.response_code",
        "function": "count",
        "partition_field_name": "nginx.access.response_code"
      }
    ],
    "influencers": [
      "nginx.access.response_code"
    ]
  }
Running the job on some sample NGINX data yields the following results in the machine learning Anomaly Explorer:
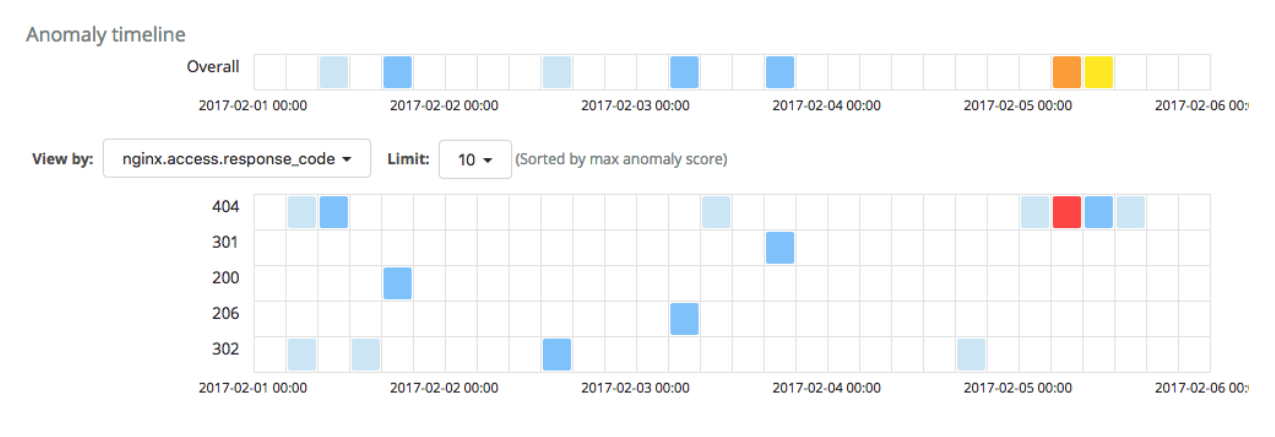
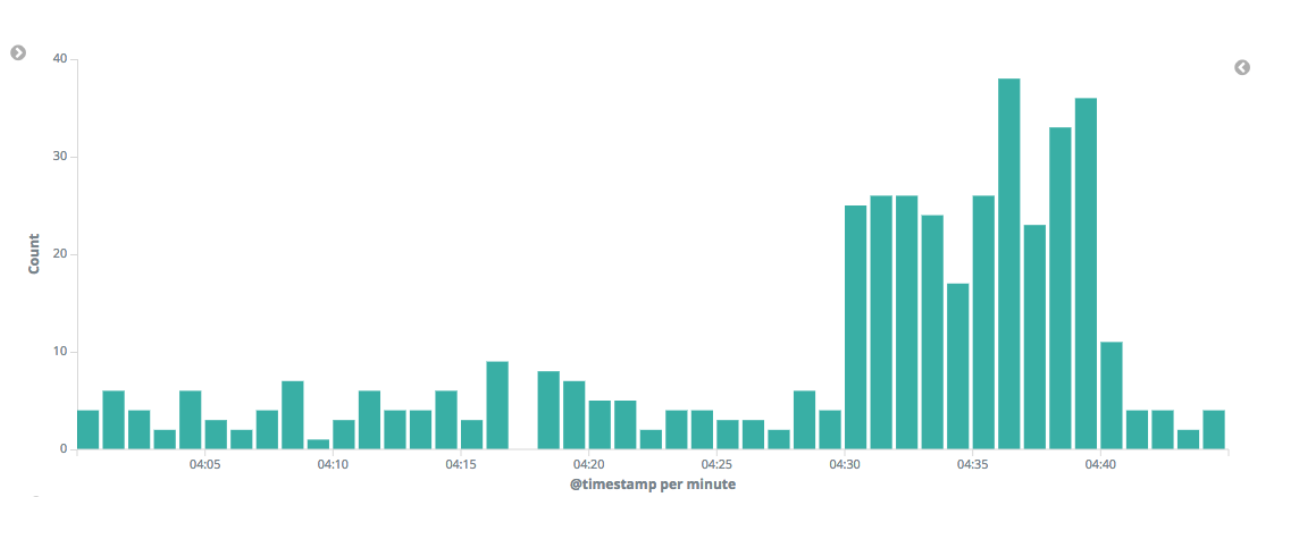
The analysis has identified one critical anomaly in the rate of request documents with a 404 response code. Surely this is worthy of investigation. Drilling down into the data, we see that the count of 404 responses did indeed increase during the period of time when the anomaly was identified.
User Agents
Each HTTP request has an associated user agent (the type of web client used by the entity making the request), many of which are from ordinary browsers such as Chrome or Firefox. But a significant number come from automated bots or web crawlers such as PingdomBot. The chart below shows the distribution for some of the most active user agents:
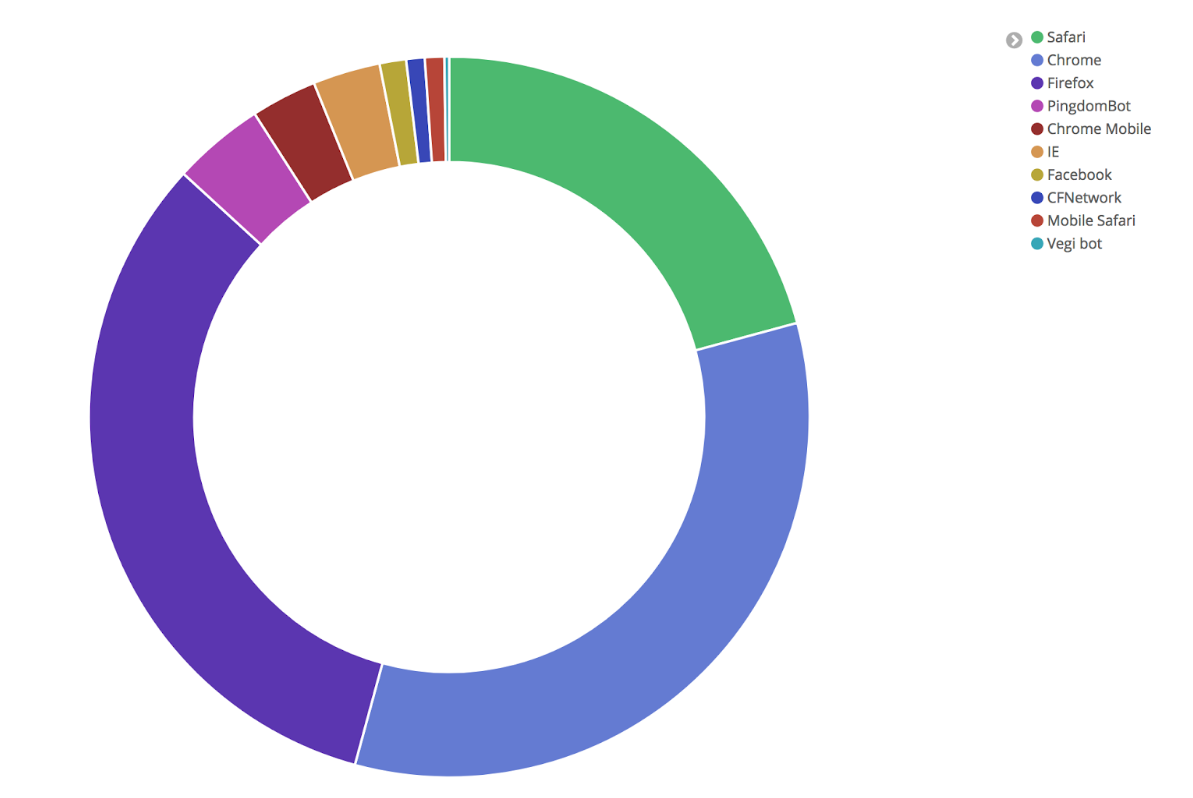
Studying the NGINX logs, we can see that there are a total of 269 different user agents, only a small number of which are everyday browsers that real users employ (Firefox, Chrome, Safari, etc.). Inspecting the user agents for the requests that contributed to the anomaly, it is apparent that the majority of those hits are coming from bots, and if the bot activity is removed the anomalous increase is diminished.
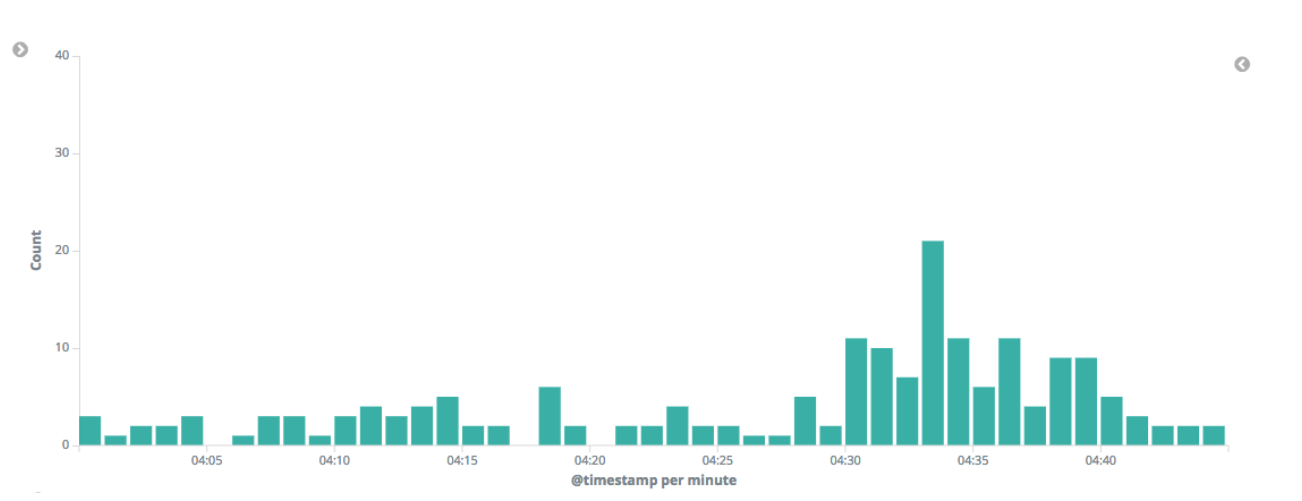
The critical anomaly is thus mostly attributed to bots generating multiple 404 responses. In general, it’s safe to say that we should care more about real users’ experiences rather than being troubled by bots failing to find pages. If we could remove the contribution of the bots’ traffic, we should see more meaningful results. We don’t want this extraneous bot traffic to overshadow more pertinent anomalies encountered by real users.
Filtering the Datafeed
It’s intriguing to see what the analysis looks like without the bots’ requests. This can be achieved by filtering the data with a Terms Lookup query in the datafeed. We’ll accomplish this with a simple, two-step process:
First, let’s create a simple index with a document containing all the browser user agents that we care about:
POST machine-learning-lookups/doc/browser_user_agents
{
  "user_agents": ["Chrome", "Safari", "Firefox", "IE", "Chrome Mobile", "Edge", "Mobile Safari"]
}
Second, when we configure the machine learning job, we’ll modify the query that the datafeed uses to only match documents where nginx.access.user_agent.name is one of the browser user agents listed above by specifying the following query syntax:
"query": {
  "terms": {
    "nginx.access.user_agent.name": {
      "index": "machine-learning-lookups",
      "type": "doc",
      "id": "browser_user_agents",
      "path": "user_agents"
    }
  }
}
We accomplish this by cloning the original job and editing the query JSON like so:
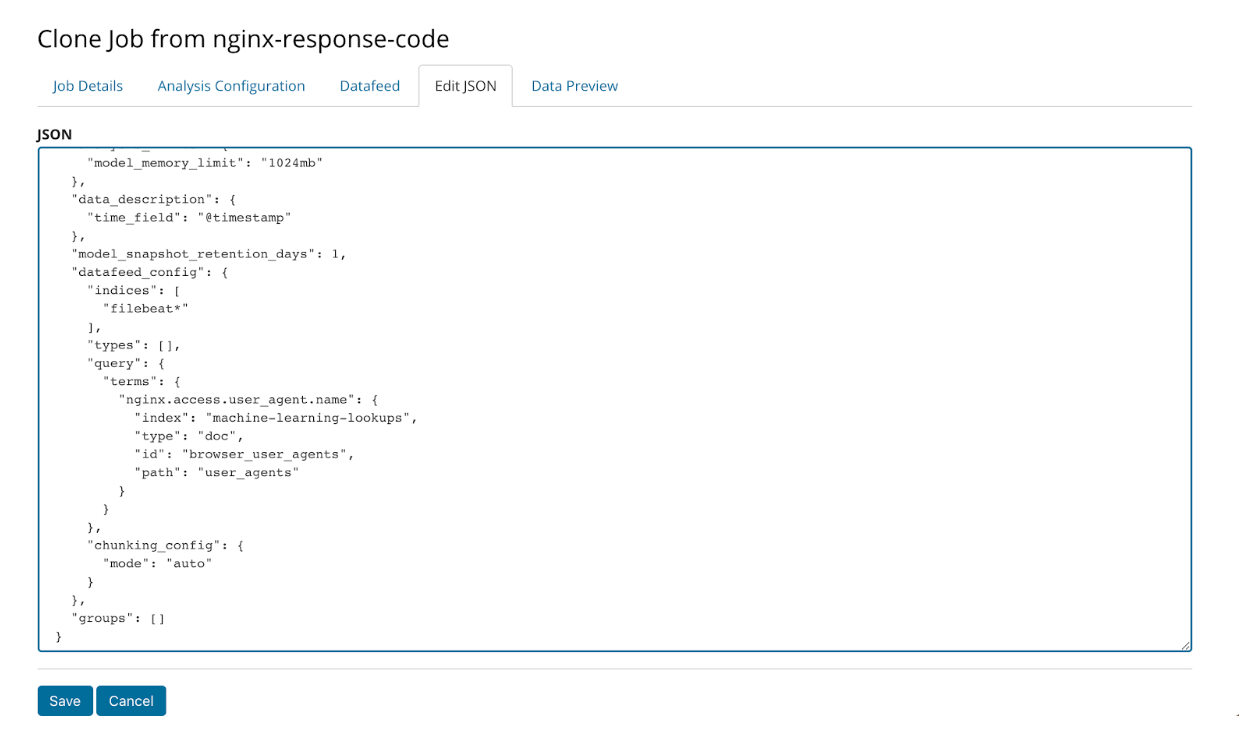
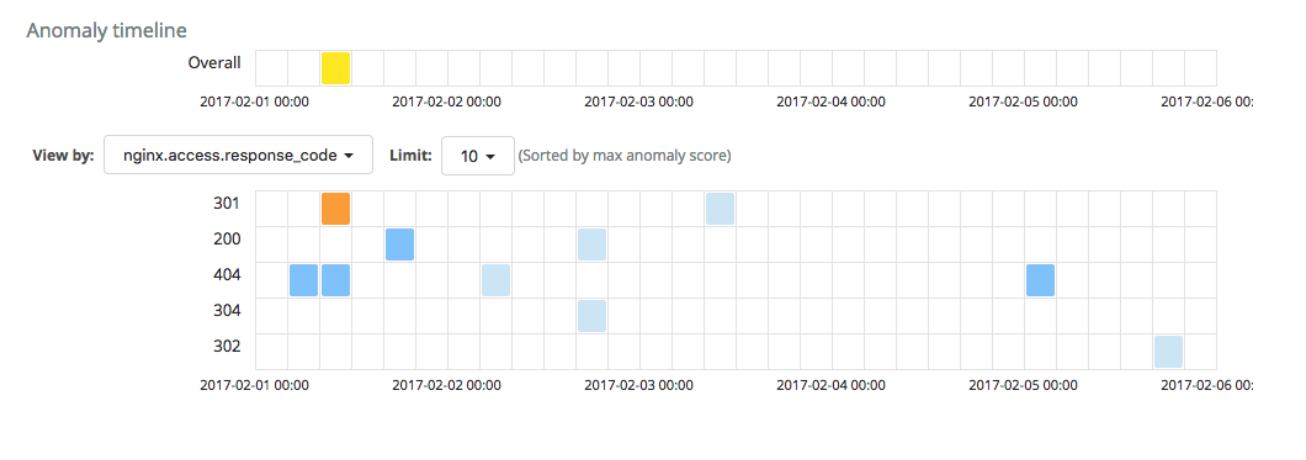
Once this edit is made, the new job with the modified datafeed query is run. The results are much more tranquil without any critical anomalies:
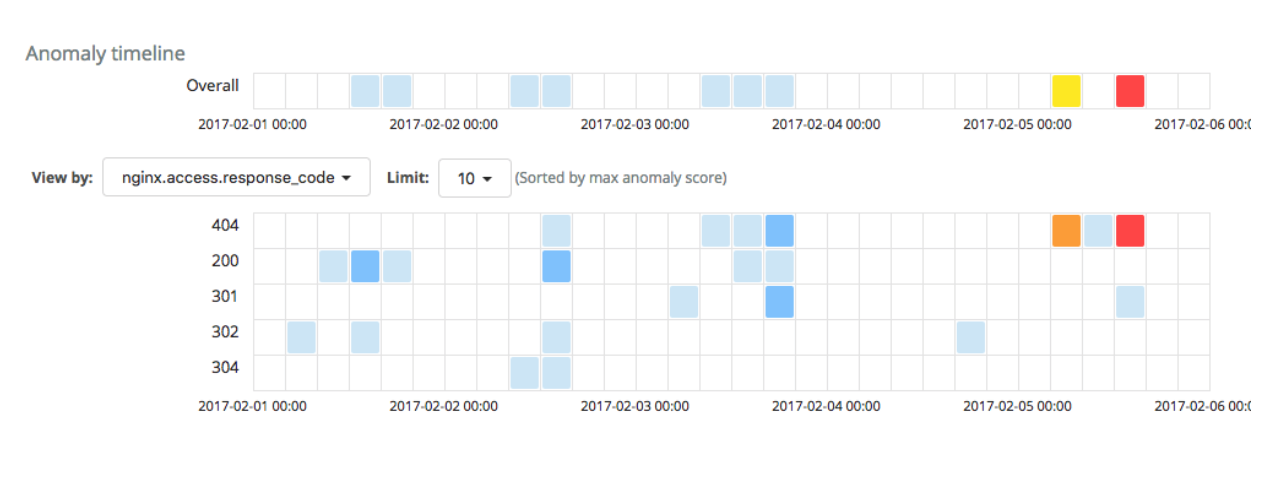
 Conversely, if we were to create a job with the inverse lookup - analyzing only the bot traffic - the critical anomaly in the 404 rate would pop up again:
In conclusion, Elastic machine learning always provides the user with statistically unusual anomalies. However, these anomalies may not be exactly aligned with the use case that the user had in mind. Via the flexibility of customizing and filtering the datafeed query, the user has complete control over how to shape the outcome of machine learning jobs. This will reduce the number of unwanted alerts and will make for a more productive analysis.