Deploying a Hot-Warm Logging Cluster on the Elasticsearch Service
Want to learn more about the differences between the Amazon Elasticsearch Service and our official Elasticsearch Service? Visit our AWS Elasticsearch comparison page.
We recently added a ton of new features to the Elasticsearch Service on Elastic Cloud that power up all your use cases — from logging to search analytics and beyond. One key announcement was the addition of hot-warm architecture deployment templates which, paired with a reduced pricing model, gives you more value when using the Elasticsearch Service for logging use cases.
In this blog post we cover how to use the new hot-warm deployment template, along with other powerful Elastic Stack features such as machine learning and alerting, to help you find more insights within your logs data — all in less than 10 minutes. If you don’t have an Elasticsearch Service account, be sure to sign up for a 14-day free trial
What is Hot-Warm Architecture?
Hot-warm architecture is a powerful way to separate an Elasticsearch deployment into “hot” data nodes and “warm” data nodes. Hot data nodes handle all the fresh incoming data and have faster storage to ensure that they can ingest and retrieve data quickly. Warm nodes have higher storage density and are more cost effective at storing longer retention periods for logging data. These two types of data nodes, when brought together, allows you to effectively handle incoming data and make it available for querying, while at the same time retain data for longer periods of time without breaking the bank.
This is especially helpful for logging use cases, where most of the focus is on the recent logs (e.g. last 2 weeks), and the older logs (which may be needed for compliance or other reasons) can accommodate slower query times.
Creating a Hot-Warm Deployment
The Elasticsearch Service makes deploying hot-warm architecture a breeze, including managing the index curation policies to move data from the hot data nodes to the warm data nodes — a feature that makes Elastic Cloud unique from other hosted Elasticsearch providers. How much of a breeze? In this blog, we'll have a hot-warm logging cluster up and running in less than 5 minutes — including a complimentary 1GB machine learning node and 1GB Kibana node.
To get started, we’ll go the Elasticsearch Service console and click Create Deployment.
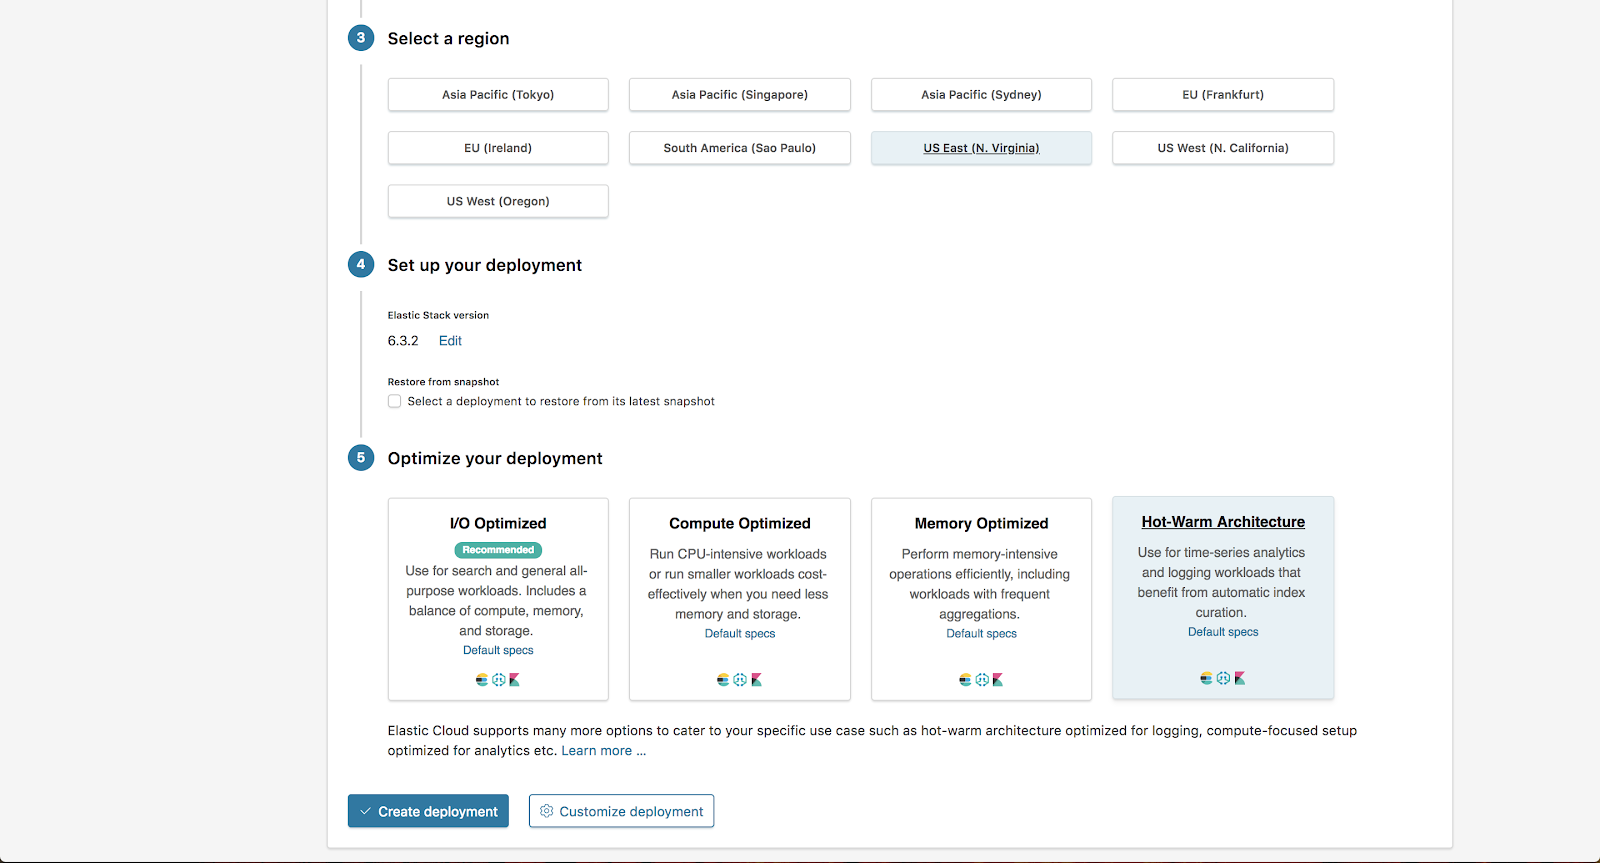
For this example, we are choosing the US East region with AWS and selecting the “Hot-Warm Architecture” option from the “Optimize your deployment” section. From here we are going to select Customize Deployment.
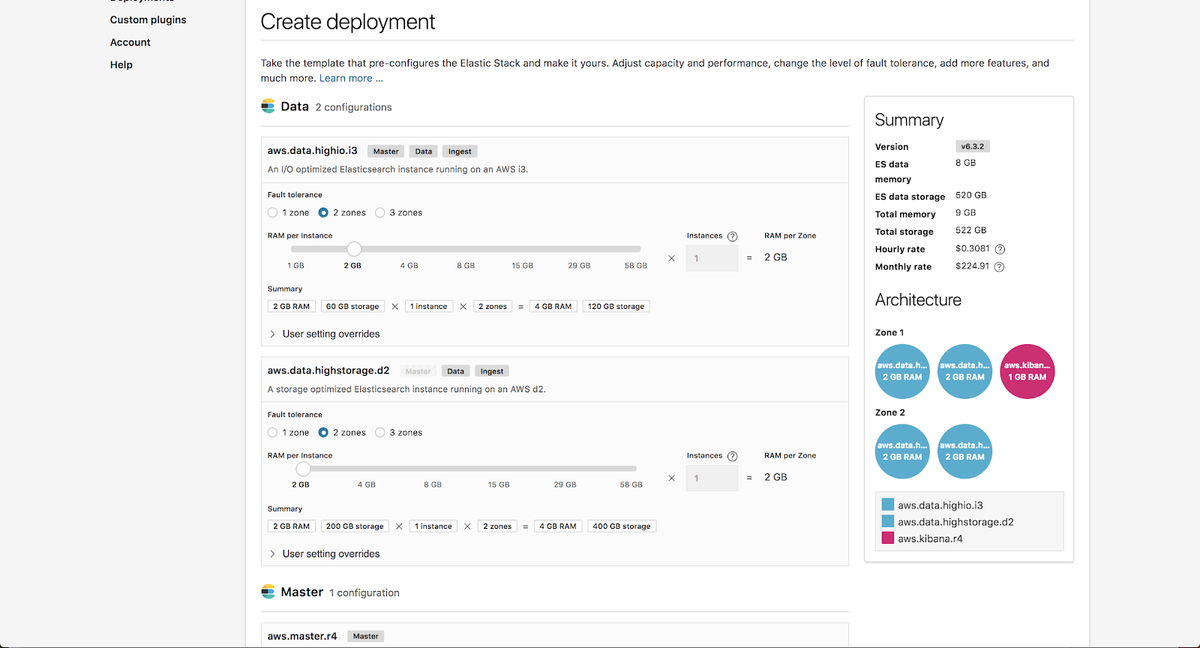
On the Customization page, you can independently scale the hot instance configuration and the warm instance configuration. To learn how to size these instances for your specific needs, be sure to check out our hot-warm sizing blog post.
We are going to keep the values at their defaults for this example.
Additionally, we are going to enable Machine Learning on our deployment. All deployments on Elasticsearch Service include a complimentary 1GB machine learning node and 1GB Kibana node.
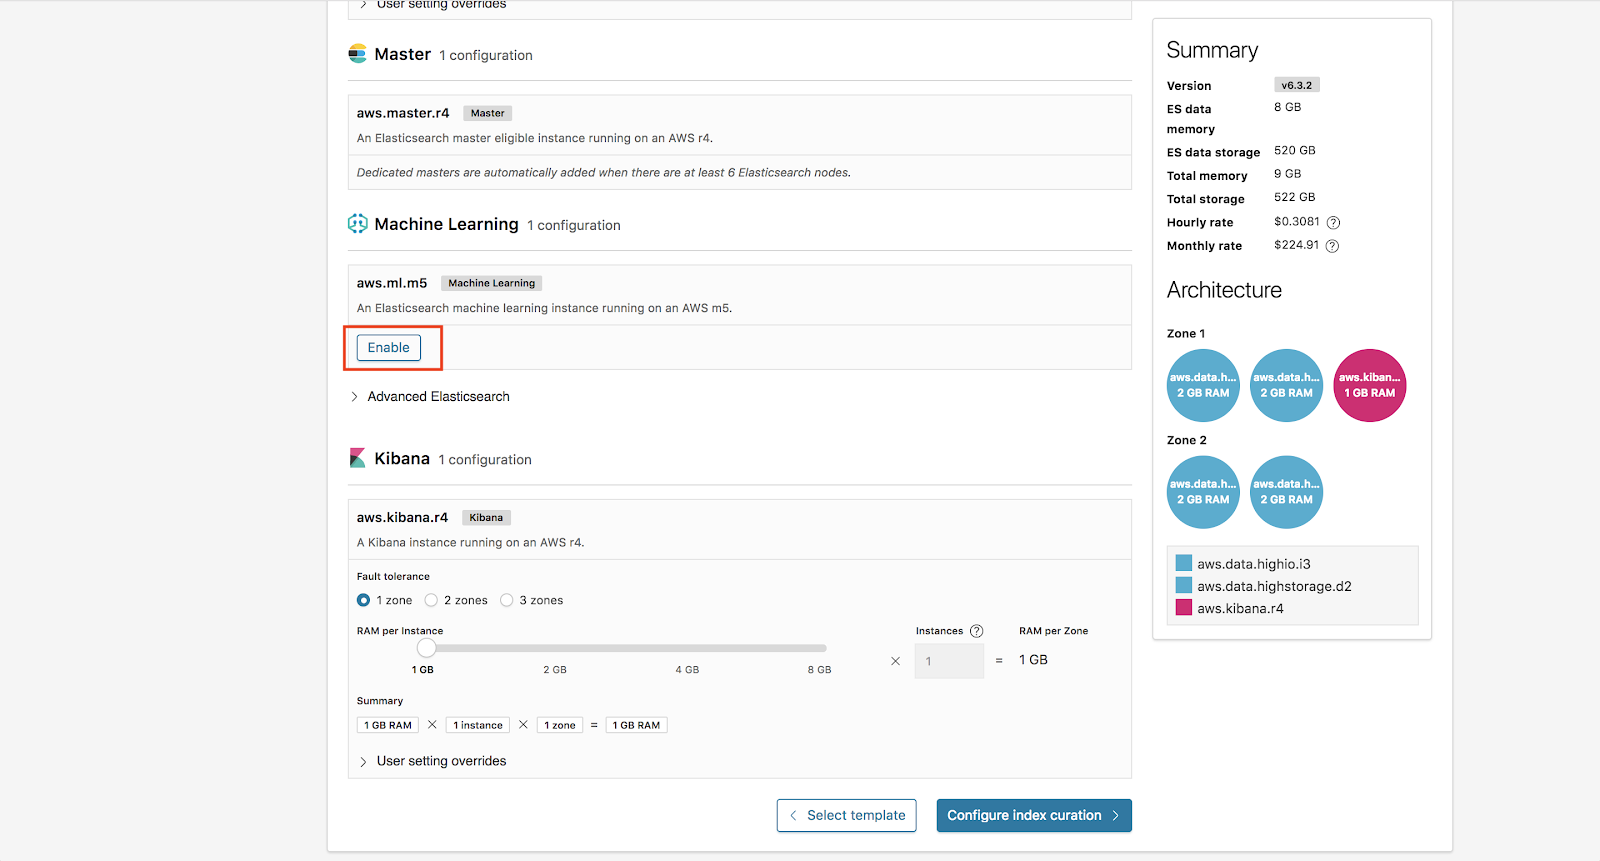
From here, we now click Configure Index Curation.
Index Curation
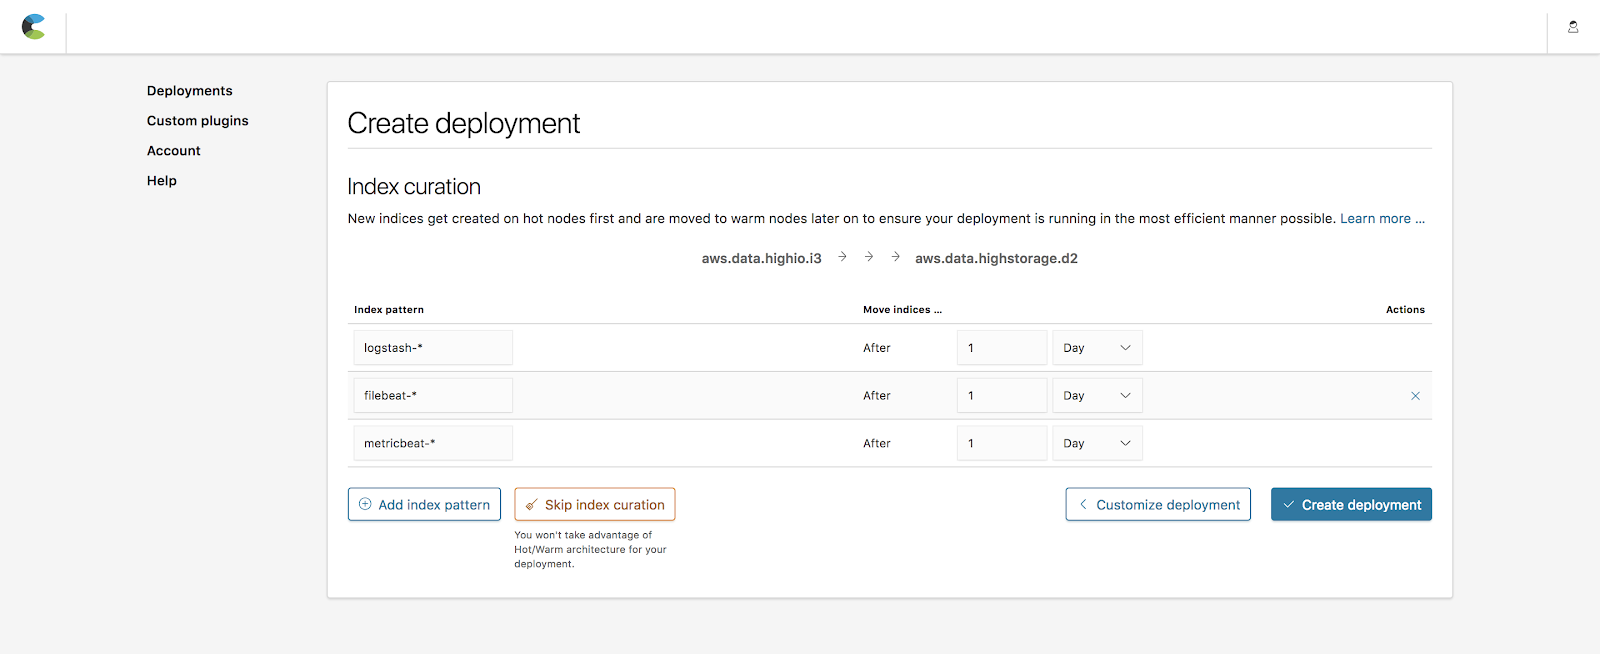
Index curation allows you to define how long indices are kept on hot nodes before being moved to the warm nodes. The default values include popular indices created by Beats (metricbeat-*, filebeat-*) and Logstash (logstash-*) with a 1-day period before moving over. We are going to keep these values for this example.
Note: You can always change these rules after deploying by going to the Operations page under the deployment.
Once this is finished we are going to click Create Deployment.
Congratulations you are now the proud deployer of the powerful hot-warm architecture!
Sending Data
Now that our hot-warm deployment is up, let’s start sending it some logging data. To do this we are going to install Beats on our local machine and then use the Elasticsearch Service cloud id and the password generated from our deployment to start sending data. For full details on setting up Beats and Elasticsearch Service take a look at our blog post on using Metricbeat with the Elasticsearch Service.
To find the cloud iD we can go to Deployments page and then go to Cloud ID:
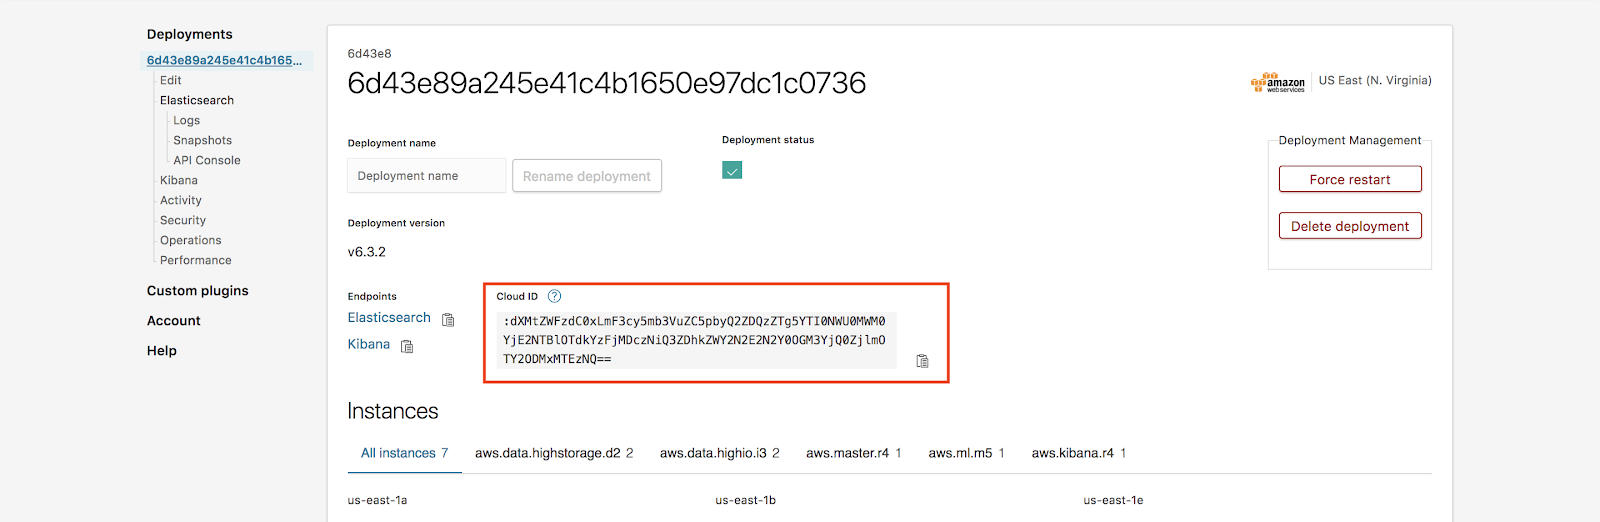
Note: Forgot your password? No problem! Elasticsearch Service allows you to reset the elastic user password under Deployment -> Security -> Reset password.
Now that we have data flowing from our local machine, let’s log into Kibana and check the dashboard. As we continue to get more data, Elasticsearch Service will continue to roll data from the hot nodes to warm nodes every day.
Adding Machine Learning
Another awesome new feature of the Elasticsearch Service is that it now support machine learning. Plus, all users can add a 1GB Machine Learning node to their deployments for free. Since we have already included this in our deployment, we can navigate to Kibana and open the machine learning app to create machine learning jobs.
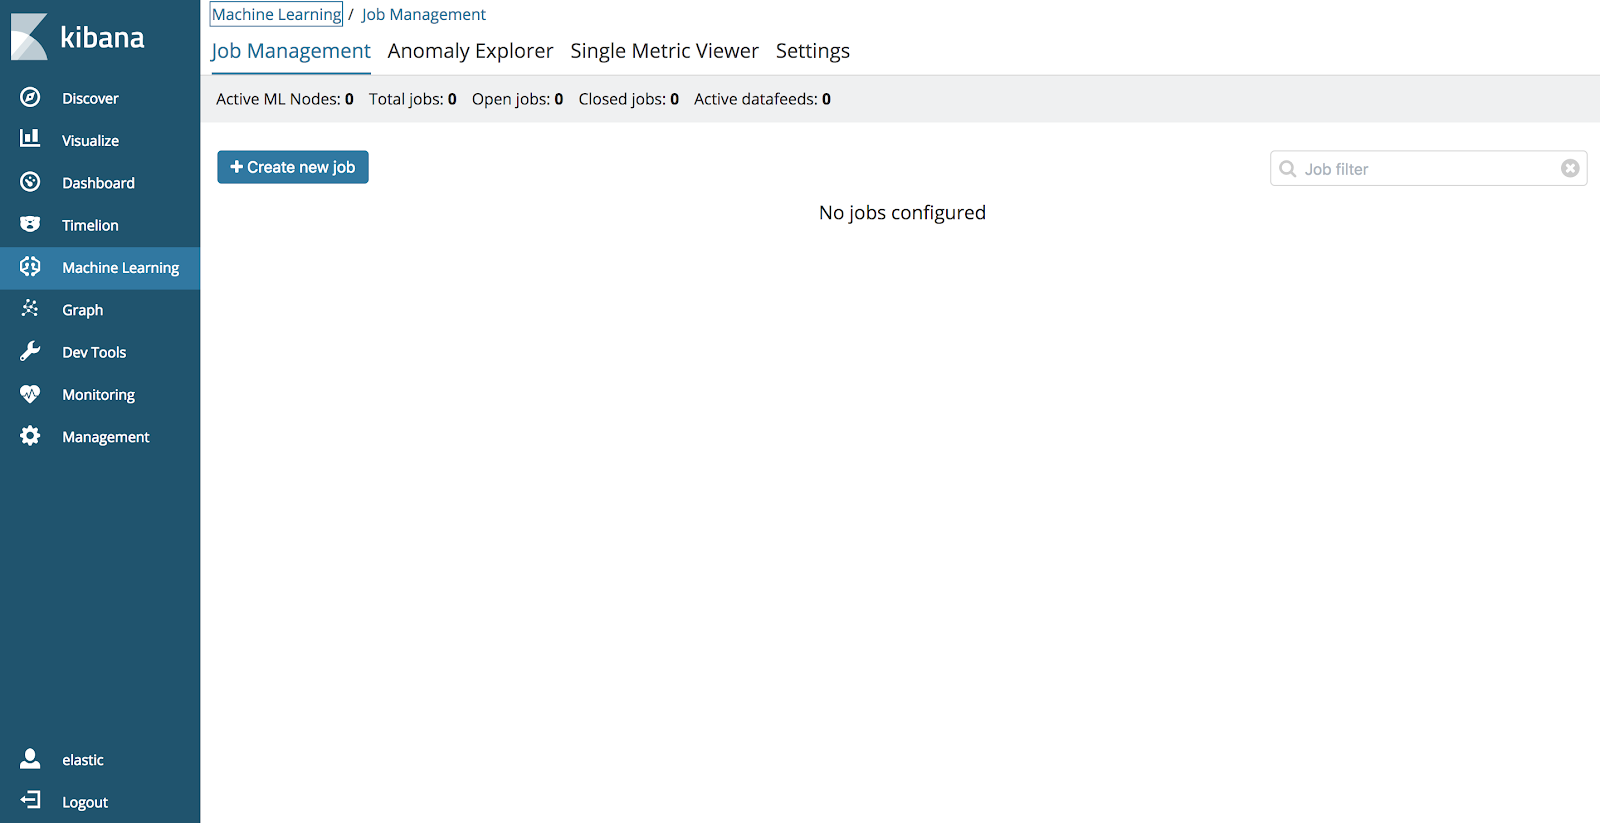
For more information about machine learning and other use cases be sure to check out the following Elastic machine learning feature page.
Conclusion
The new features of the Elasticsearch Service make getting started with the powerful hot-warm architecture as easy as a few simple clicks. Additionally, with other Elastic Stack features such as machine learning and security, monitoring your logs and metrics with the Elasticsearch Service is more powerful than ever.
Curious? Be sure to give it a spin with our 14-day trial.